. 2024 Sep 4;112(17):2886-2909.e16.
doi: 10.1016/j.neuron.2024.06.002. Epub 2024 Jul 29.

Rapid iPSC inclusionopathy models shed light on formation, consequence, and molecular subtype of α-synuclein inclusions

Affiliations

Rapid iPSC inclusionopathy models shed light on formation, consequence, and molecular subtype of α-synuclein inclusions

Isabel Lam et al. Neuron. .

Erratum in

  • Rapid iPSC inclusionopathy models shed light on formation, consequence, and molecular subtype of α-synuclein inclusions.
    Lam I, Ndayisaba A, Lewis AJ, Fu Y, Sagredo GT, Kuzkina A, Zaccagnini L, Celikag M, Sandoe J, Sanz RL, Vahdatshoar A, Martin TD, Morshed N, Ichihashi T, Tripathi A, Ramalingam N, Oettgen-Suazo C, Bartels T, Boussouf M, Schäbinger M, Hallacli E, Jiang X, Verma A, Tea C, Wang Z, Hakozaki H, Yu X, Hyles K, Park C, Wang X, Theunissen TW, Wang H, Jaenisch R, Lindquist S, Stevens B, Stefanova N, Wenning G, van de Berg WDJ, Luk KC, Sanchez-Pernaute R, Gómez-Esteban JC, Felsky D, Kiyota Y, Sahni N, Yi SS, Chung CY, Stahlberg H, Ferrer I, Schöneberg J, Elledge SJ, Dettmer U, Halliday GM, Bartels T, Khurana V. Lam I, et al. Neuron. 2025 Feb 19;113(4):637. doi: 10.1016/j.neuron.2025.01.018. Epub 2025 Feb 1. Neuron. 2025. PMID: 39894019 Free PMC article. No abstract available.

Abstract

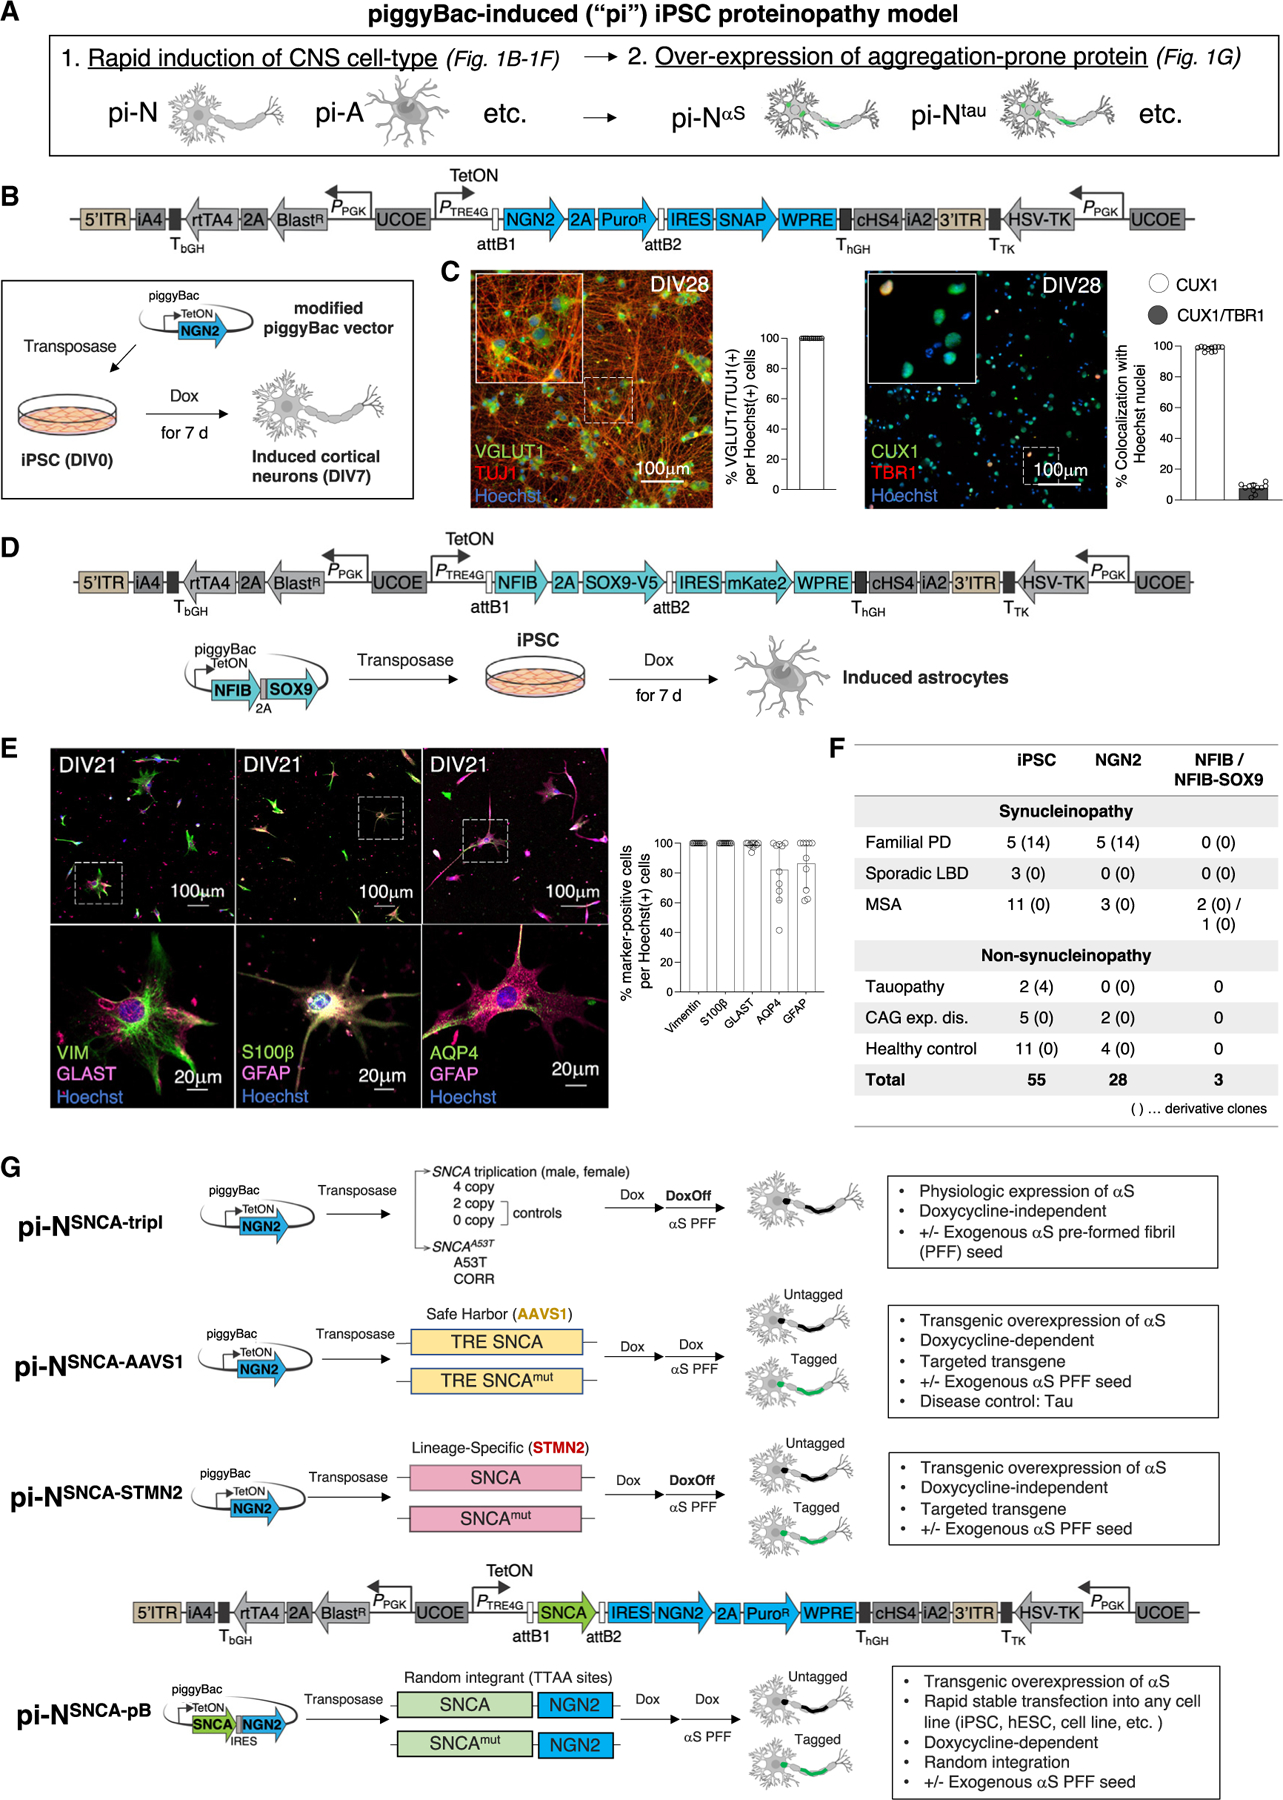
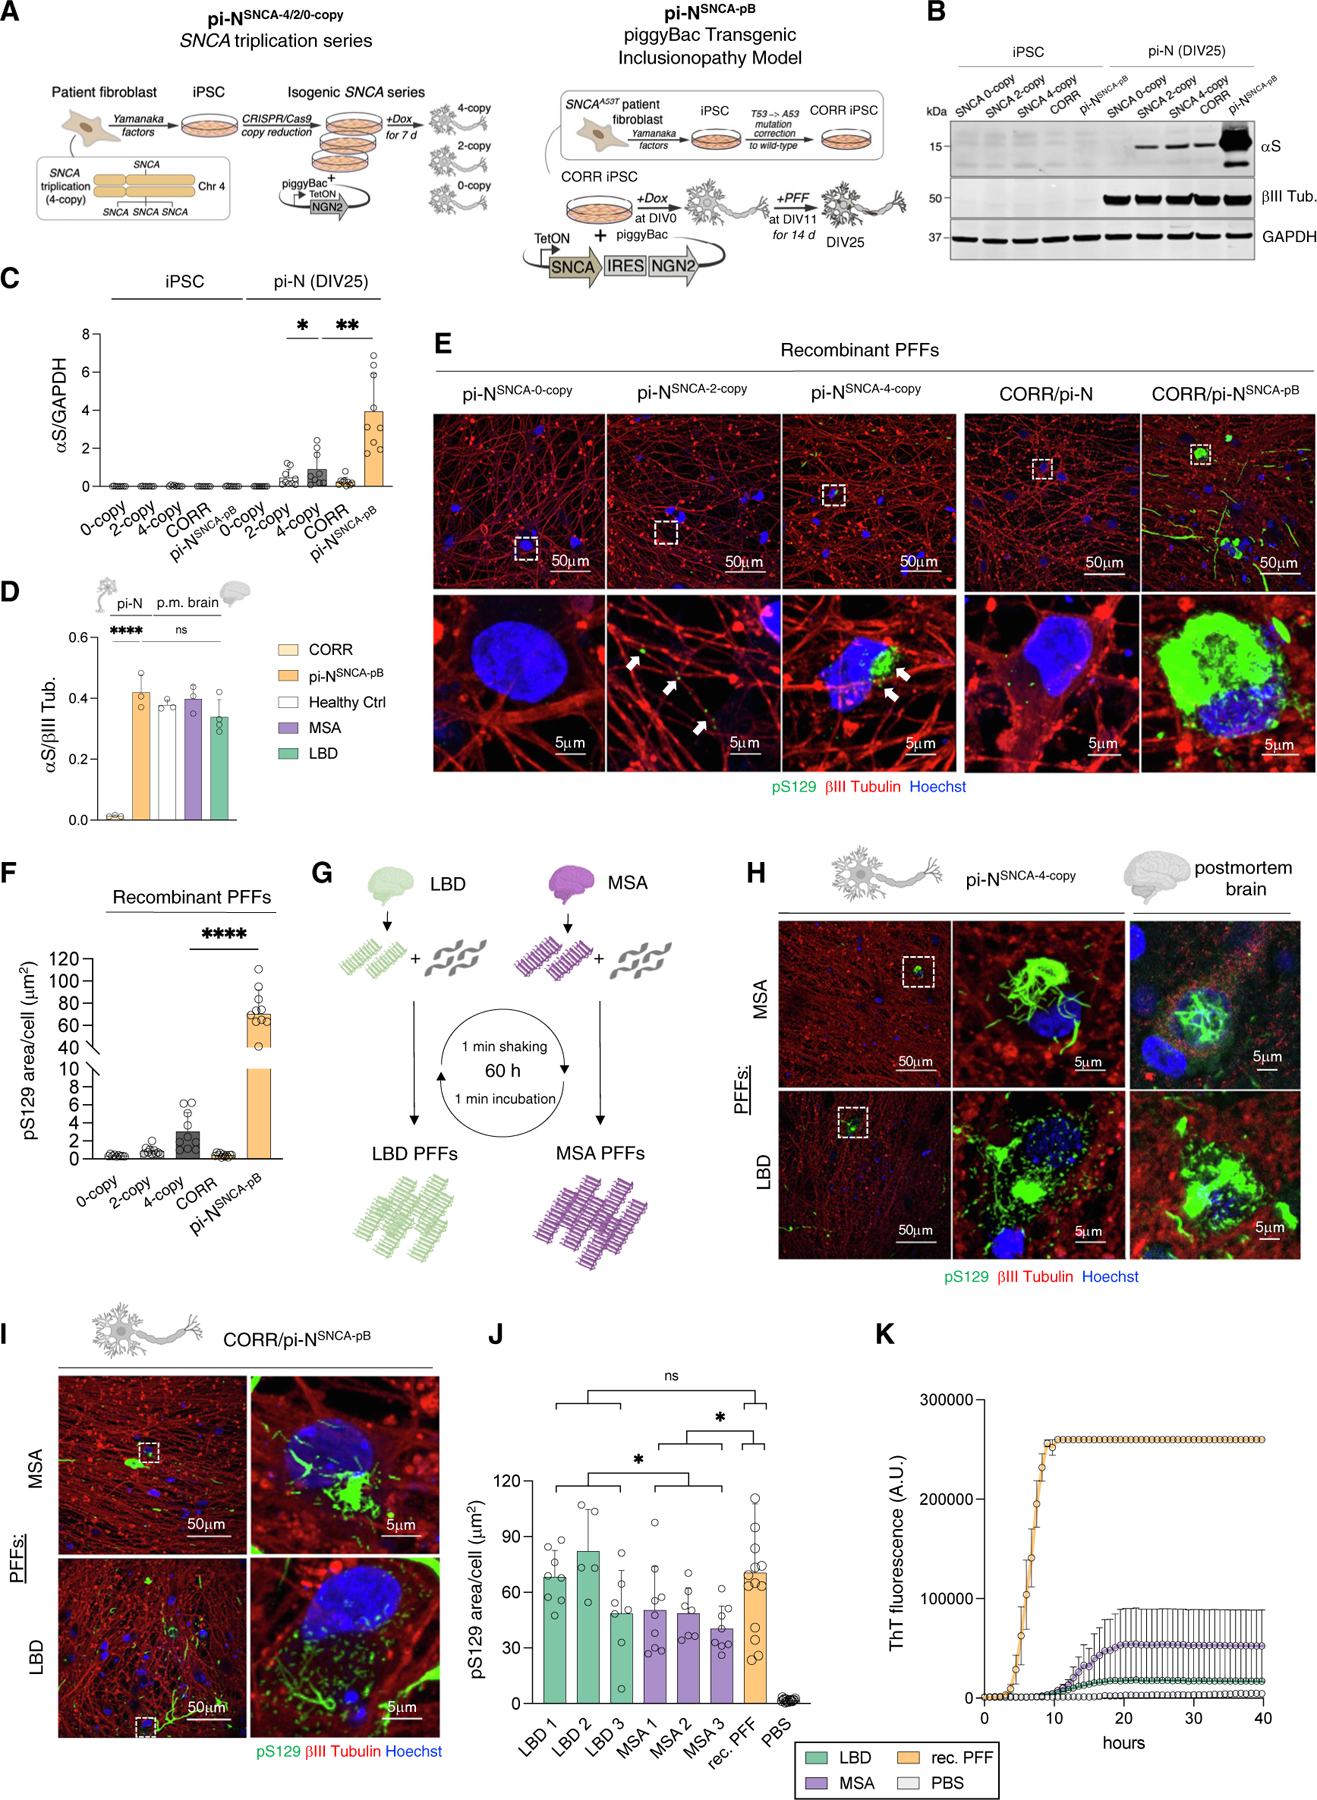
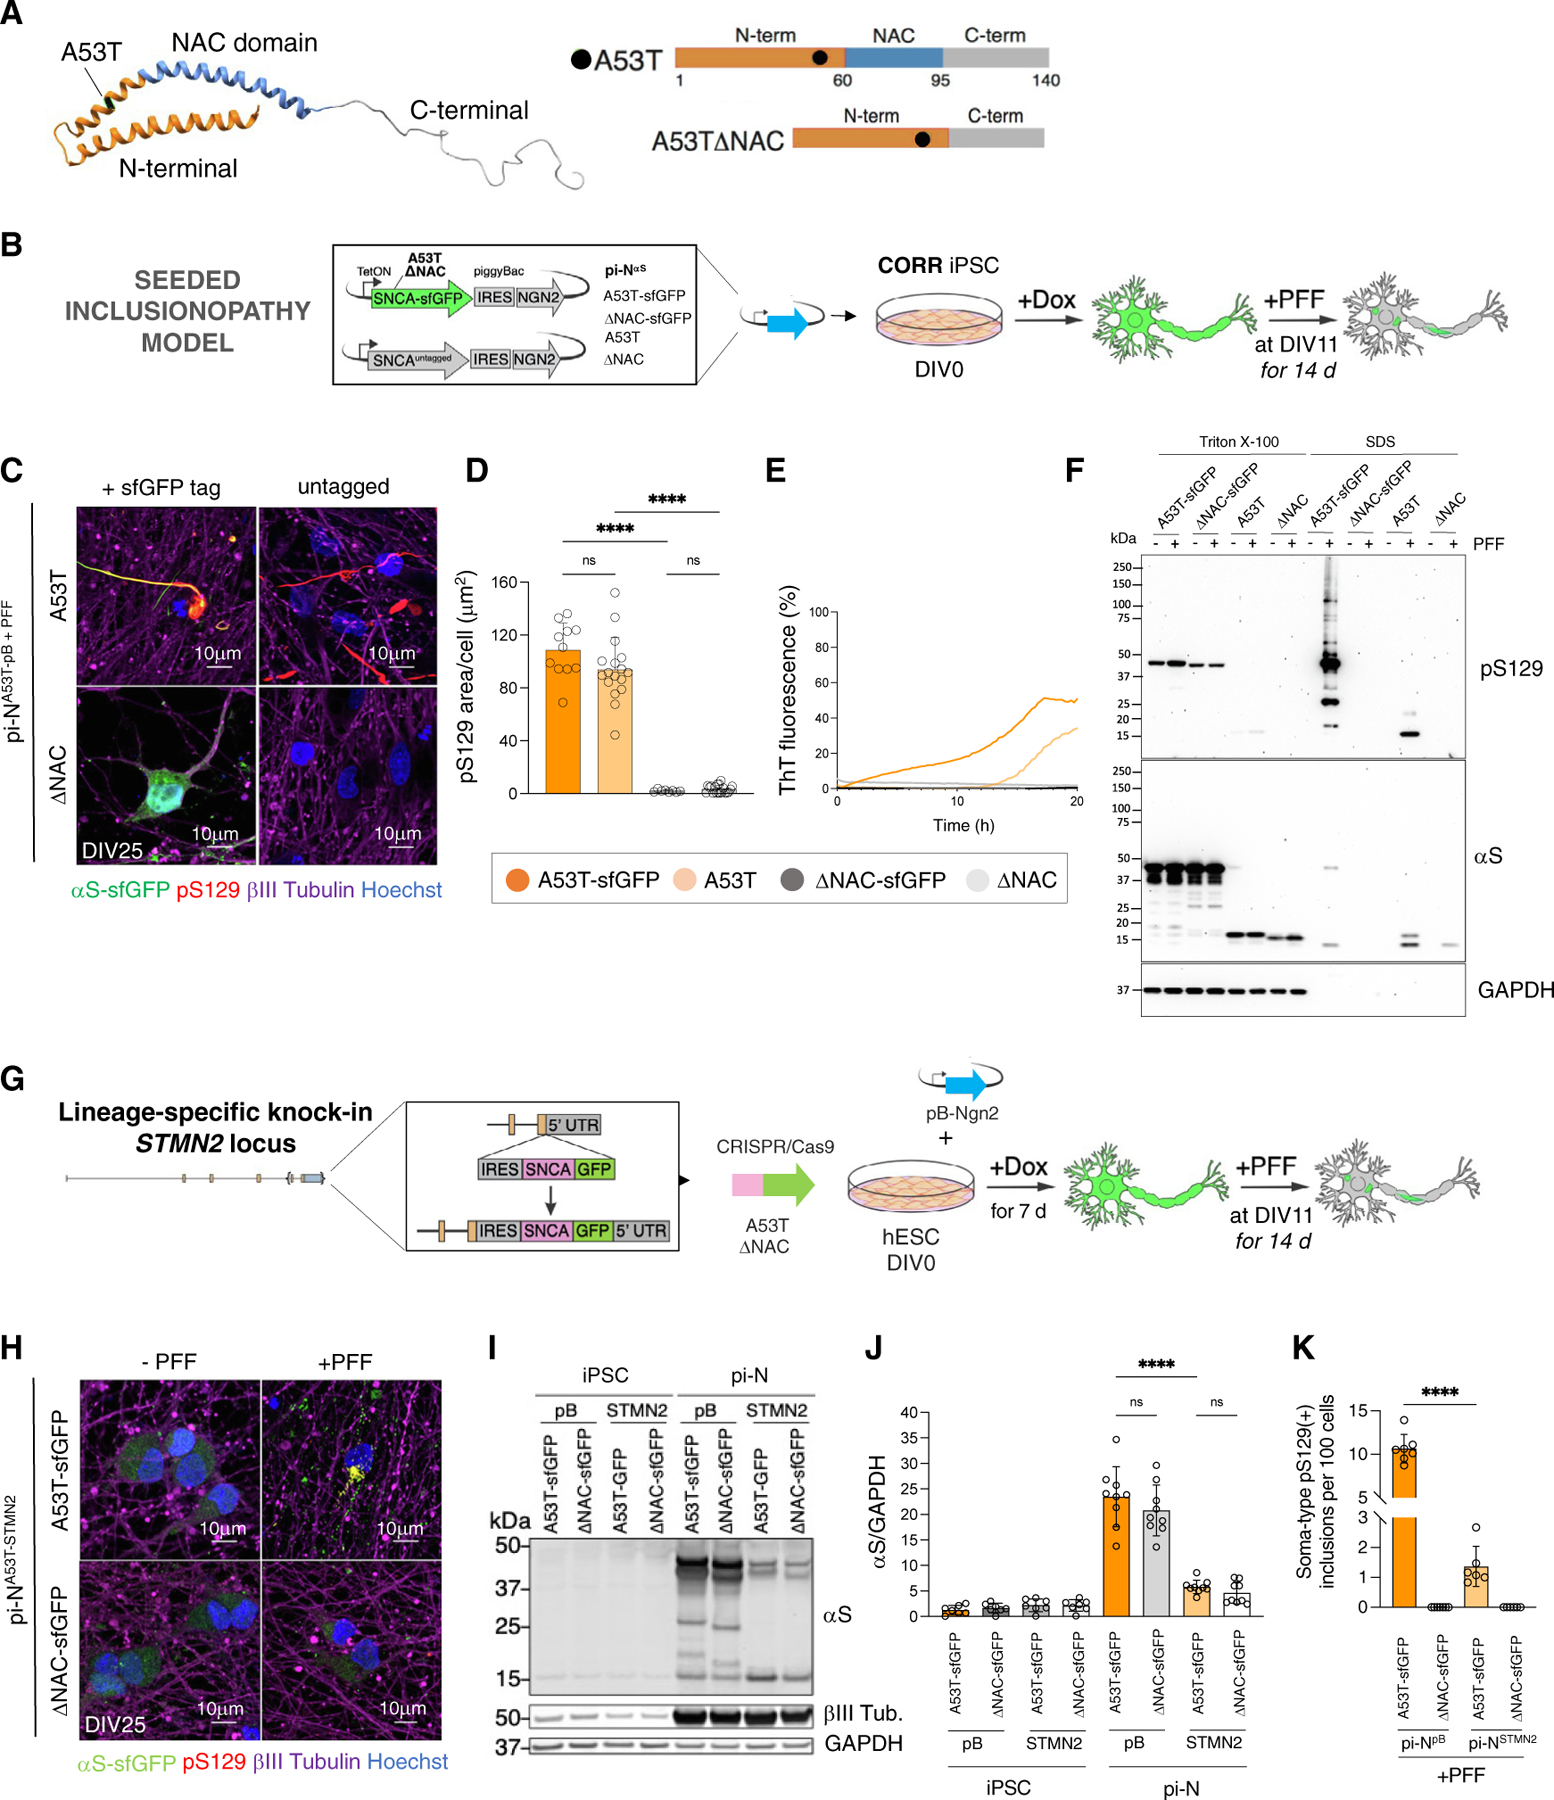
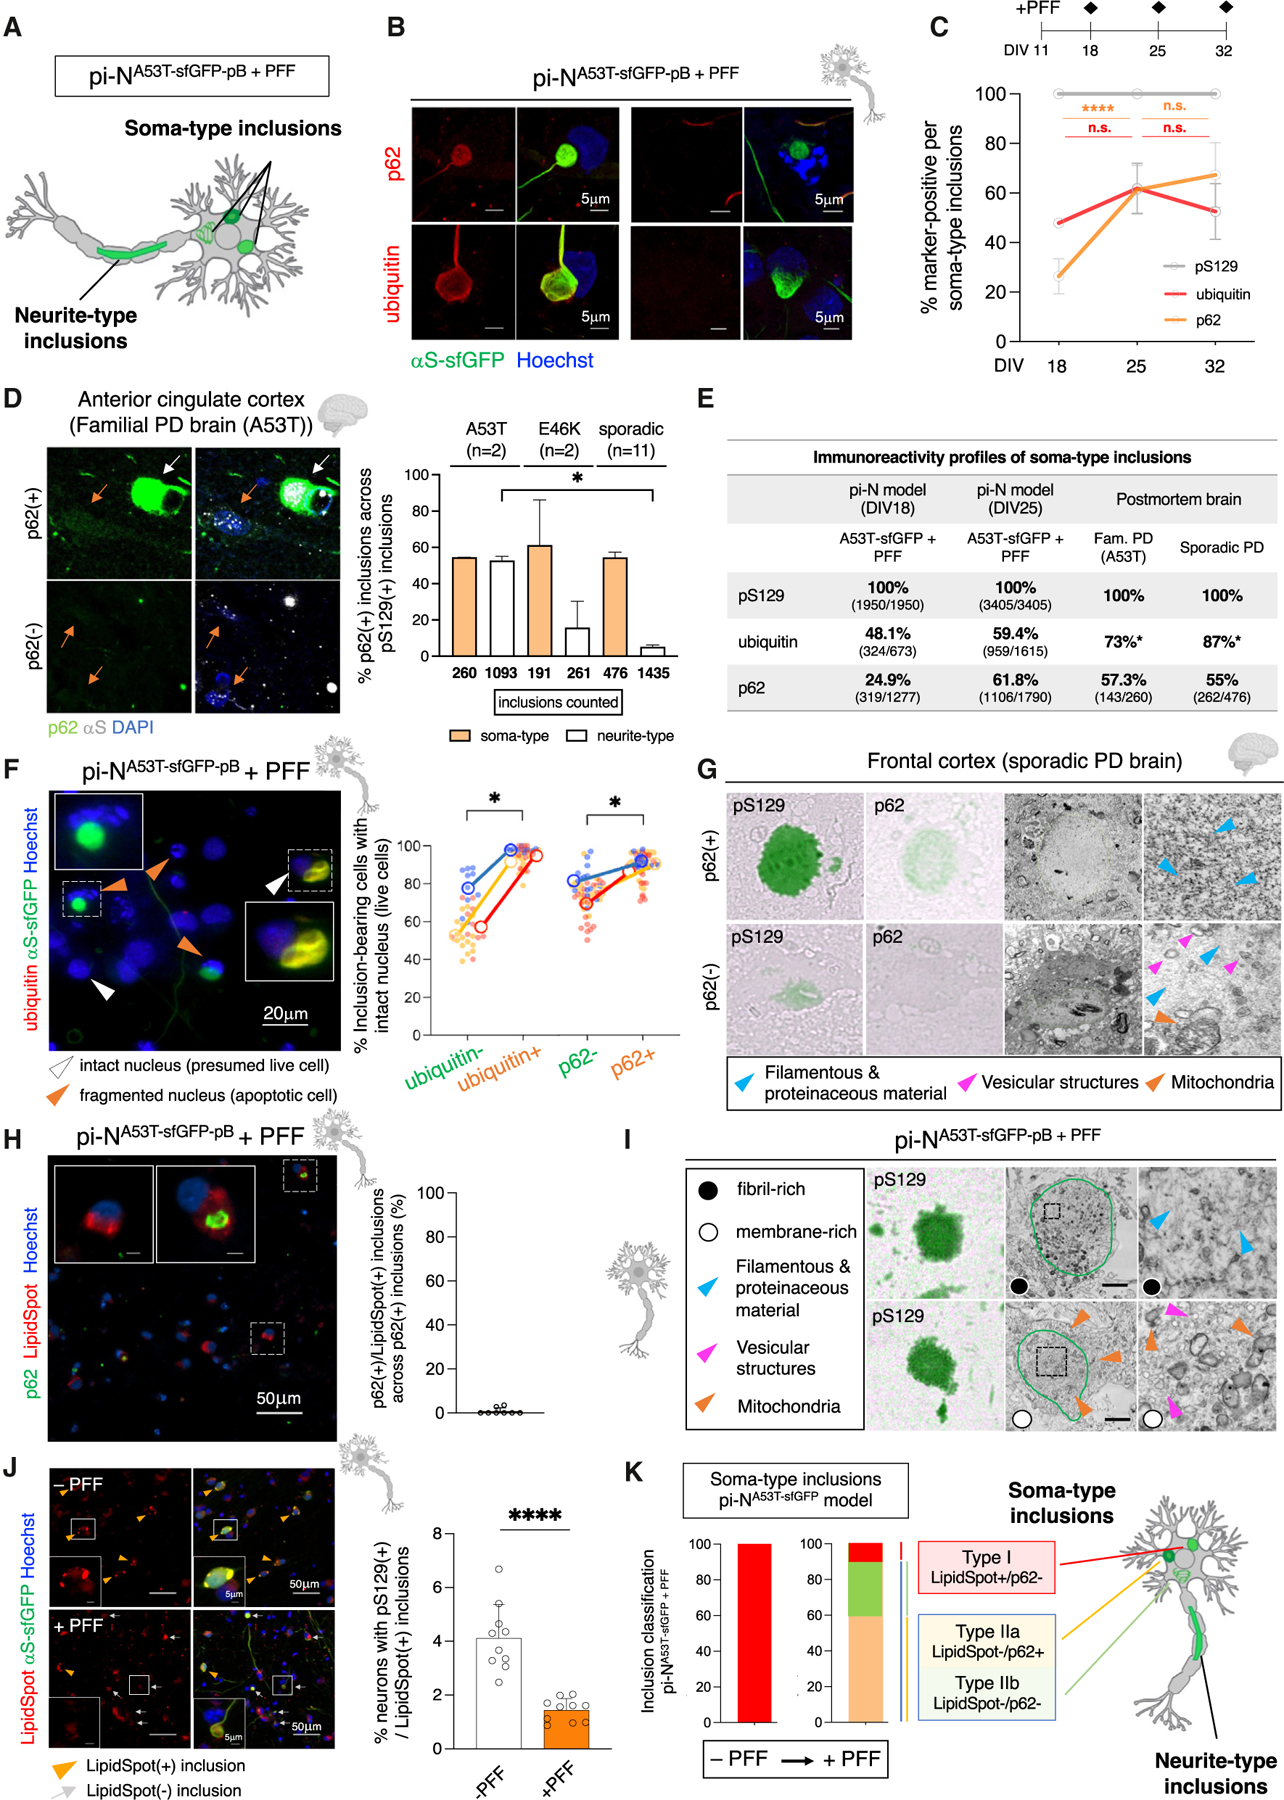
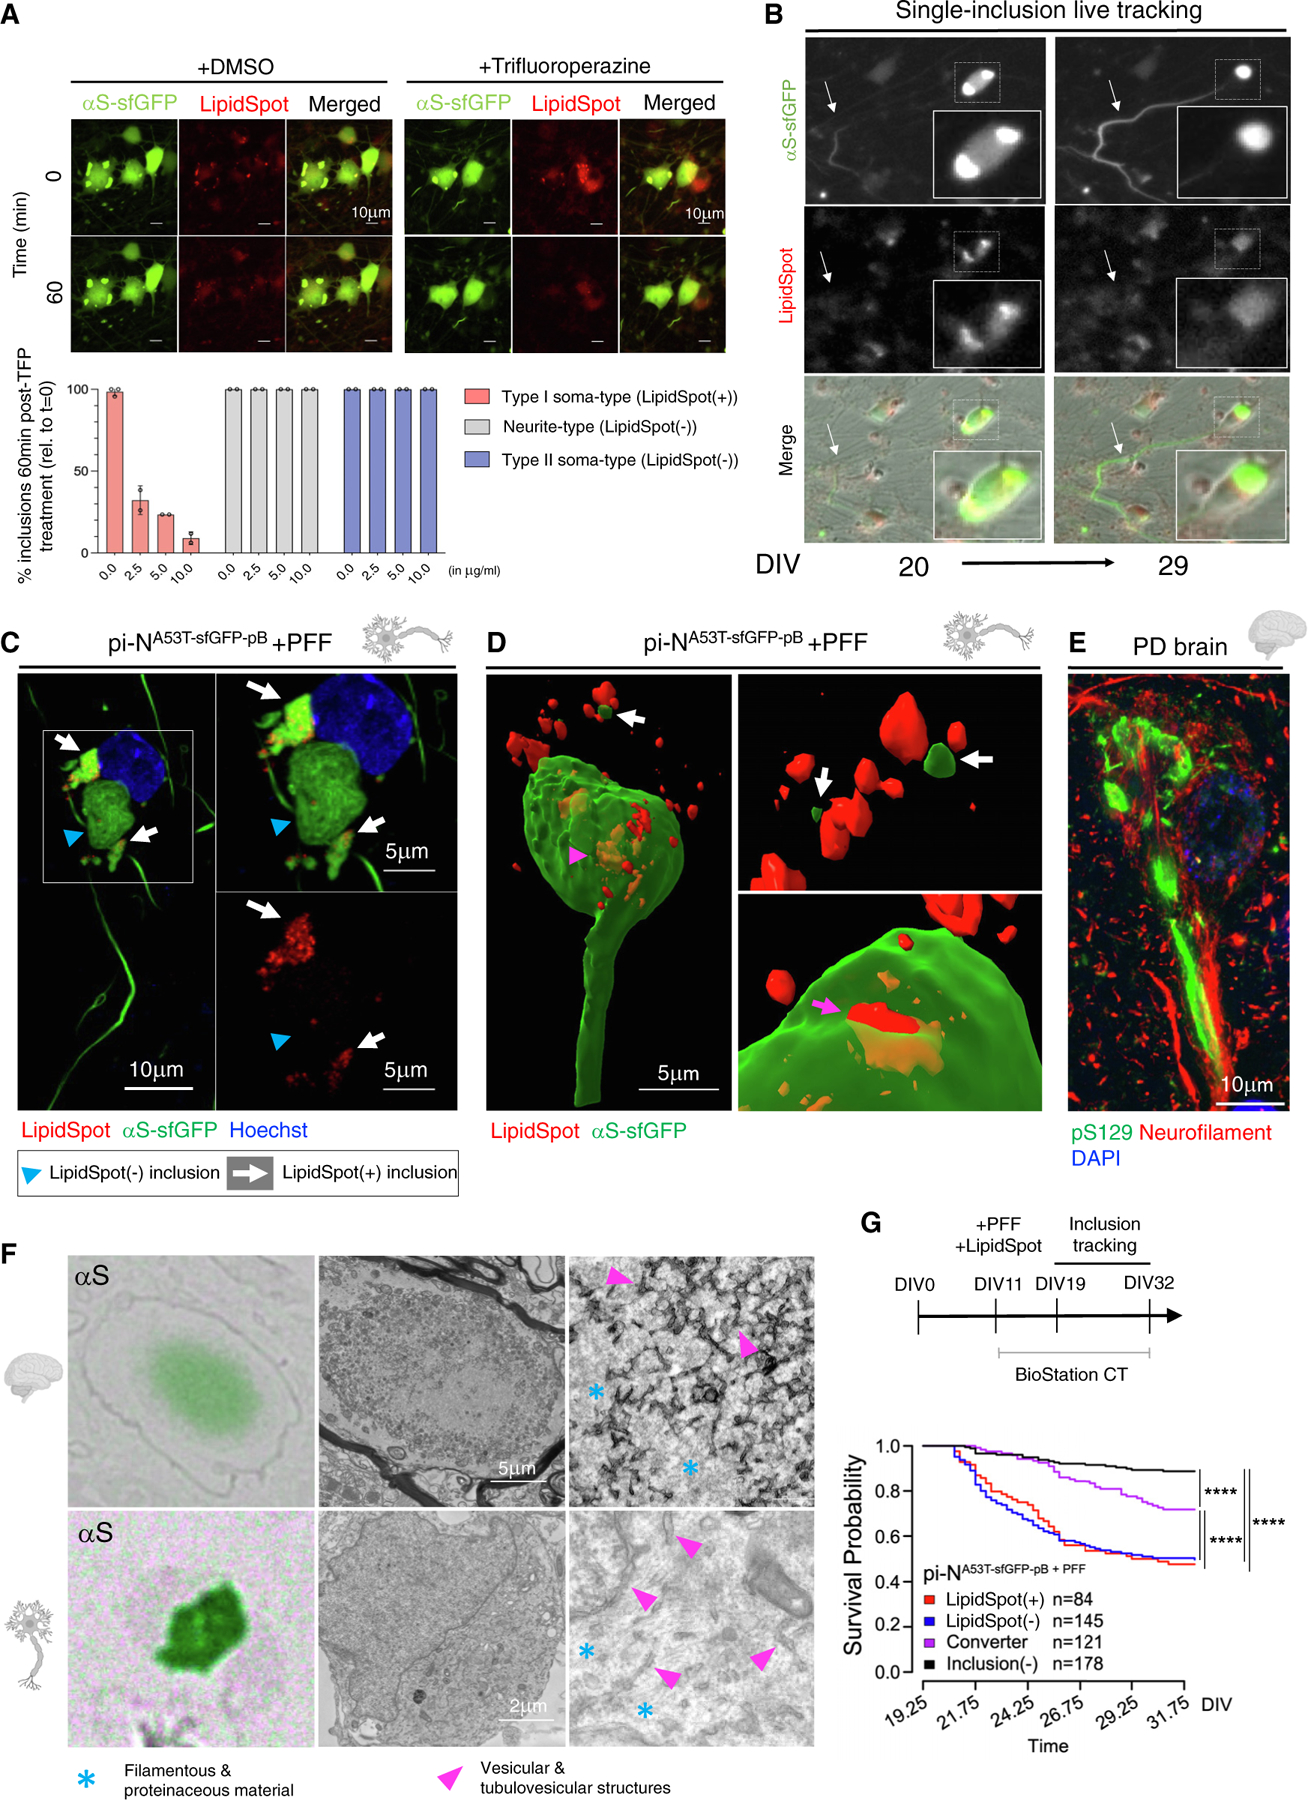
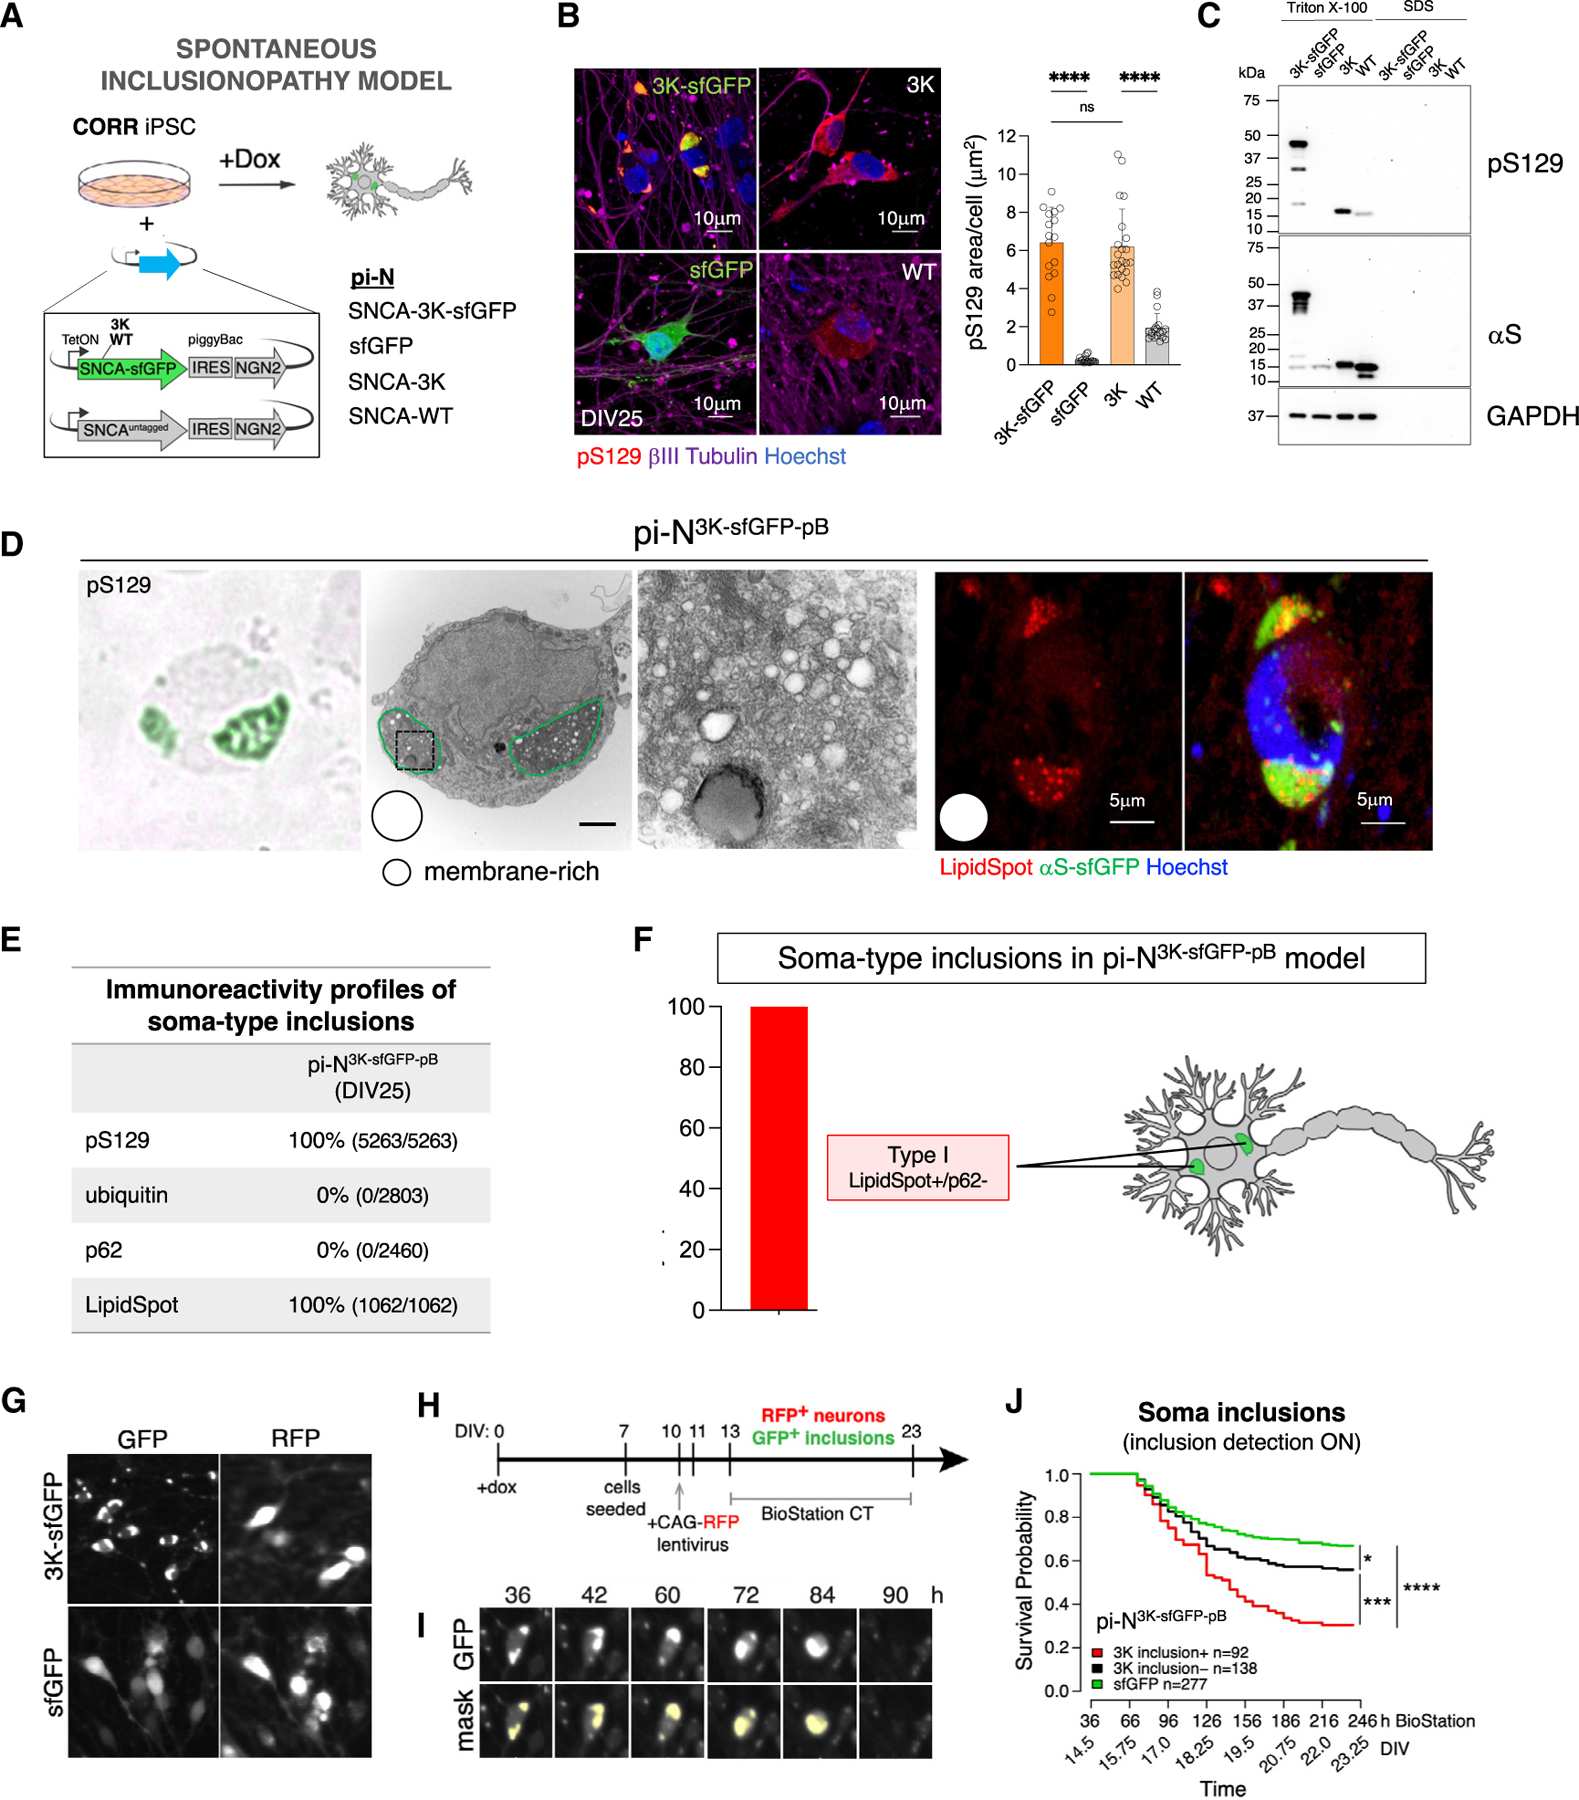
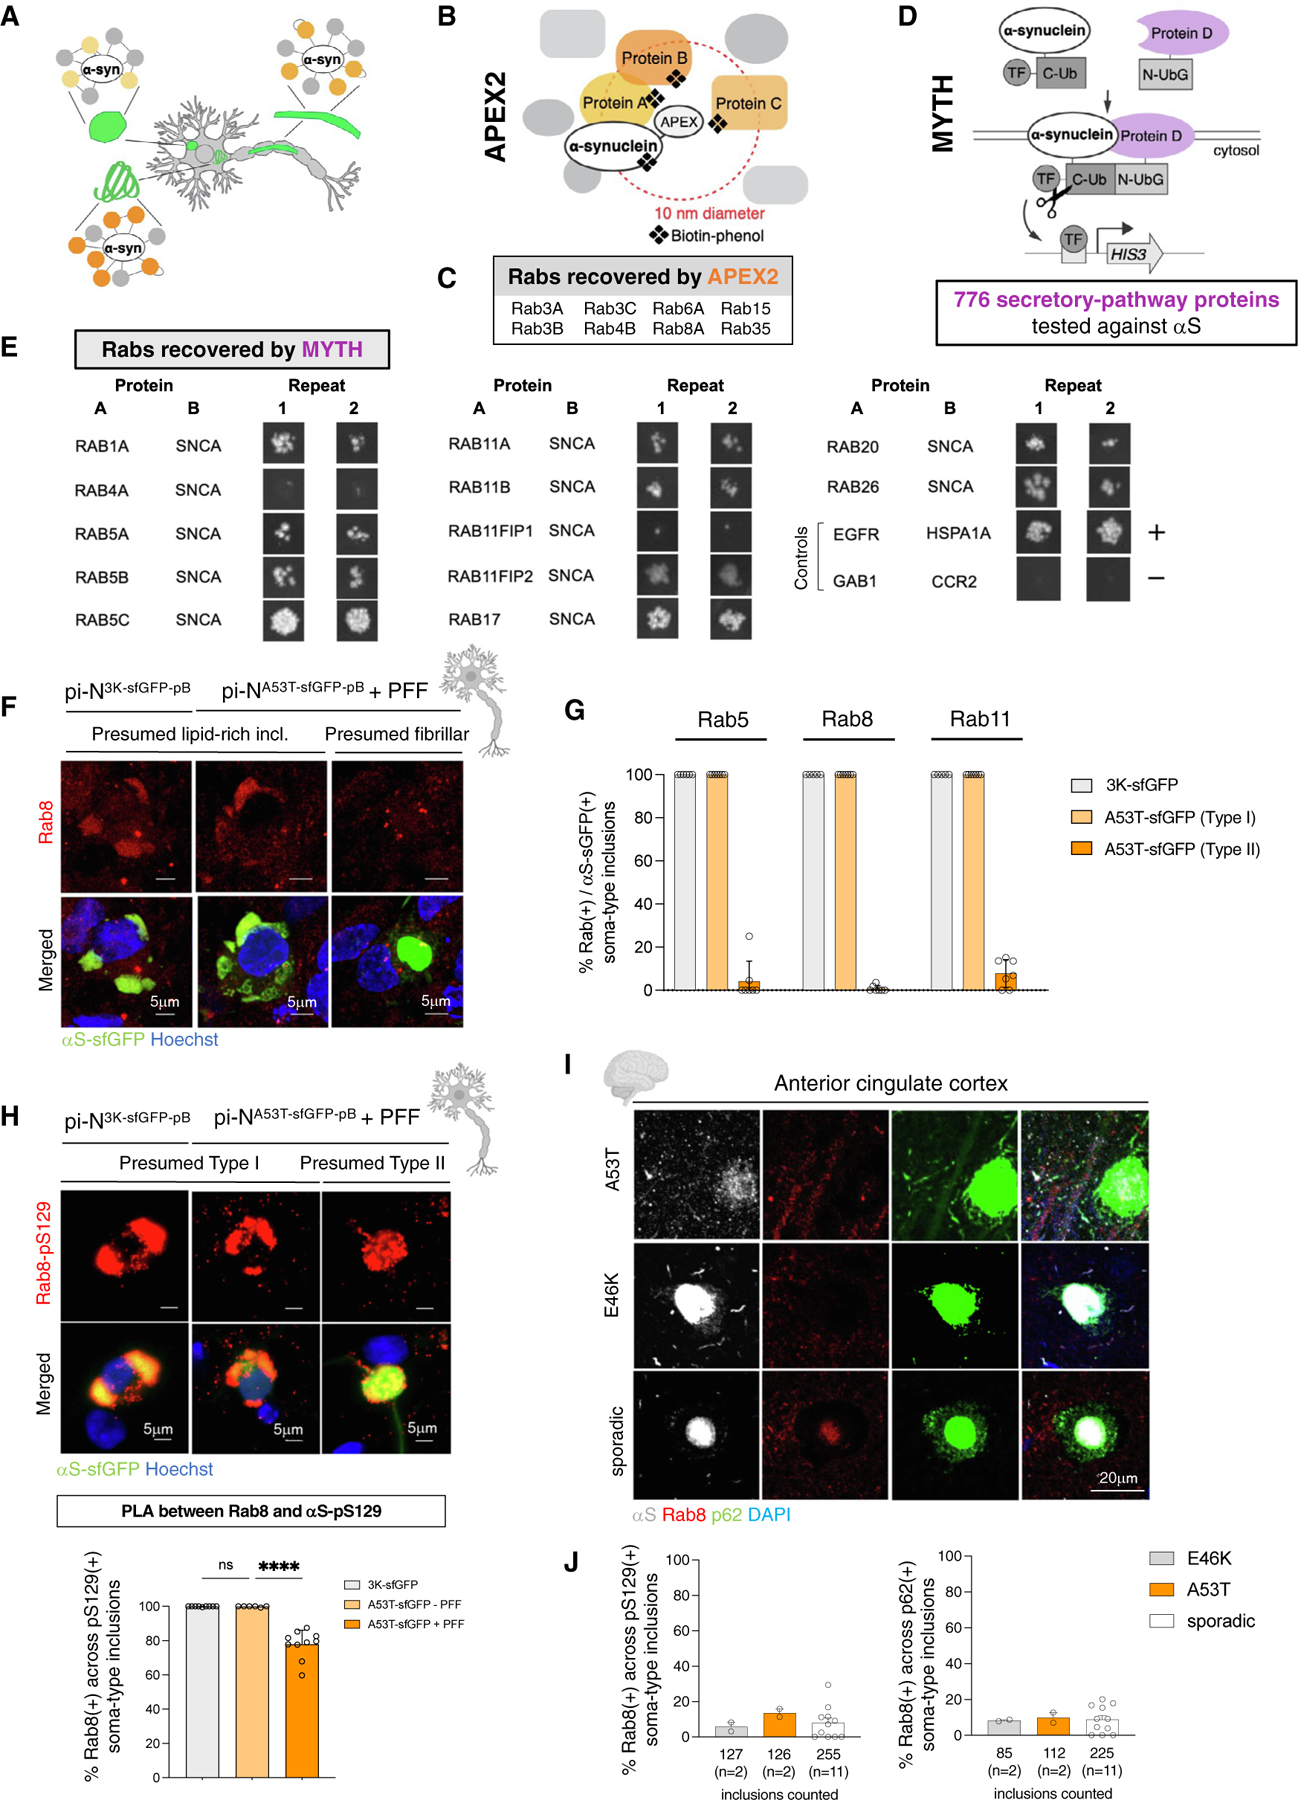
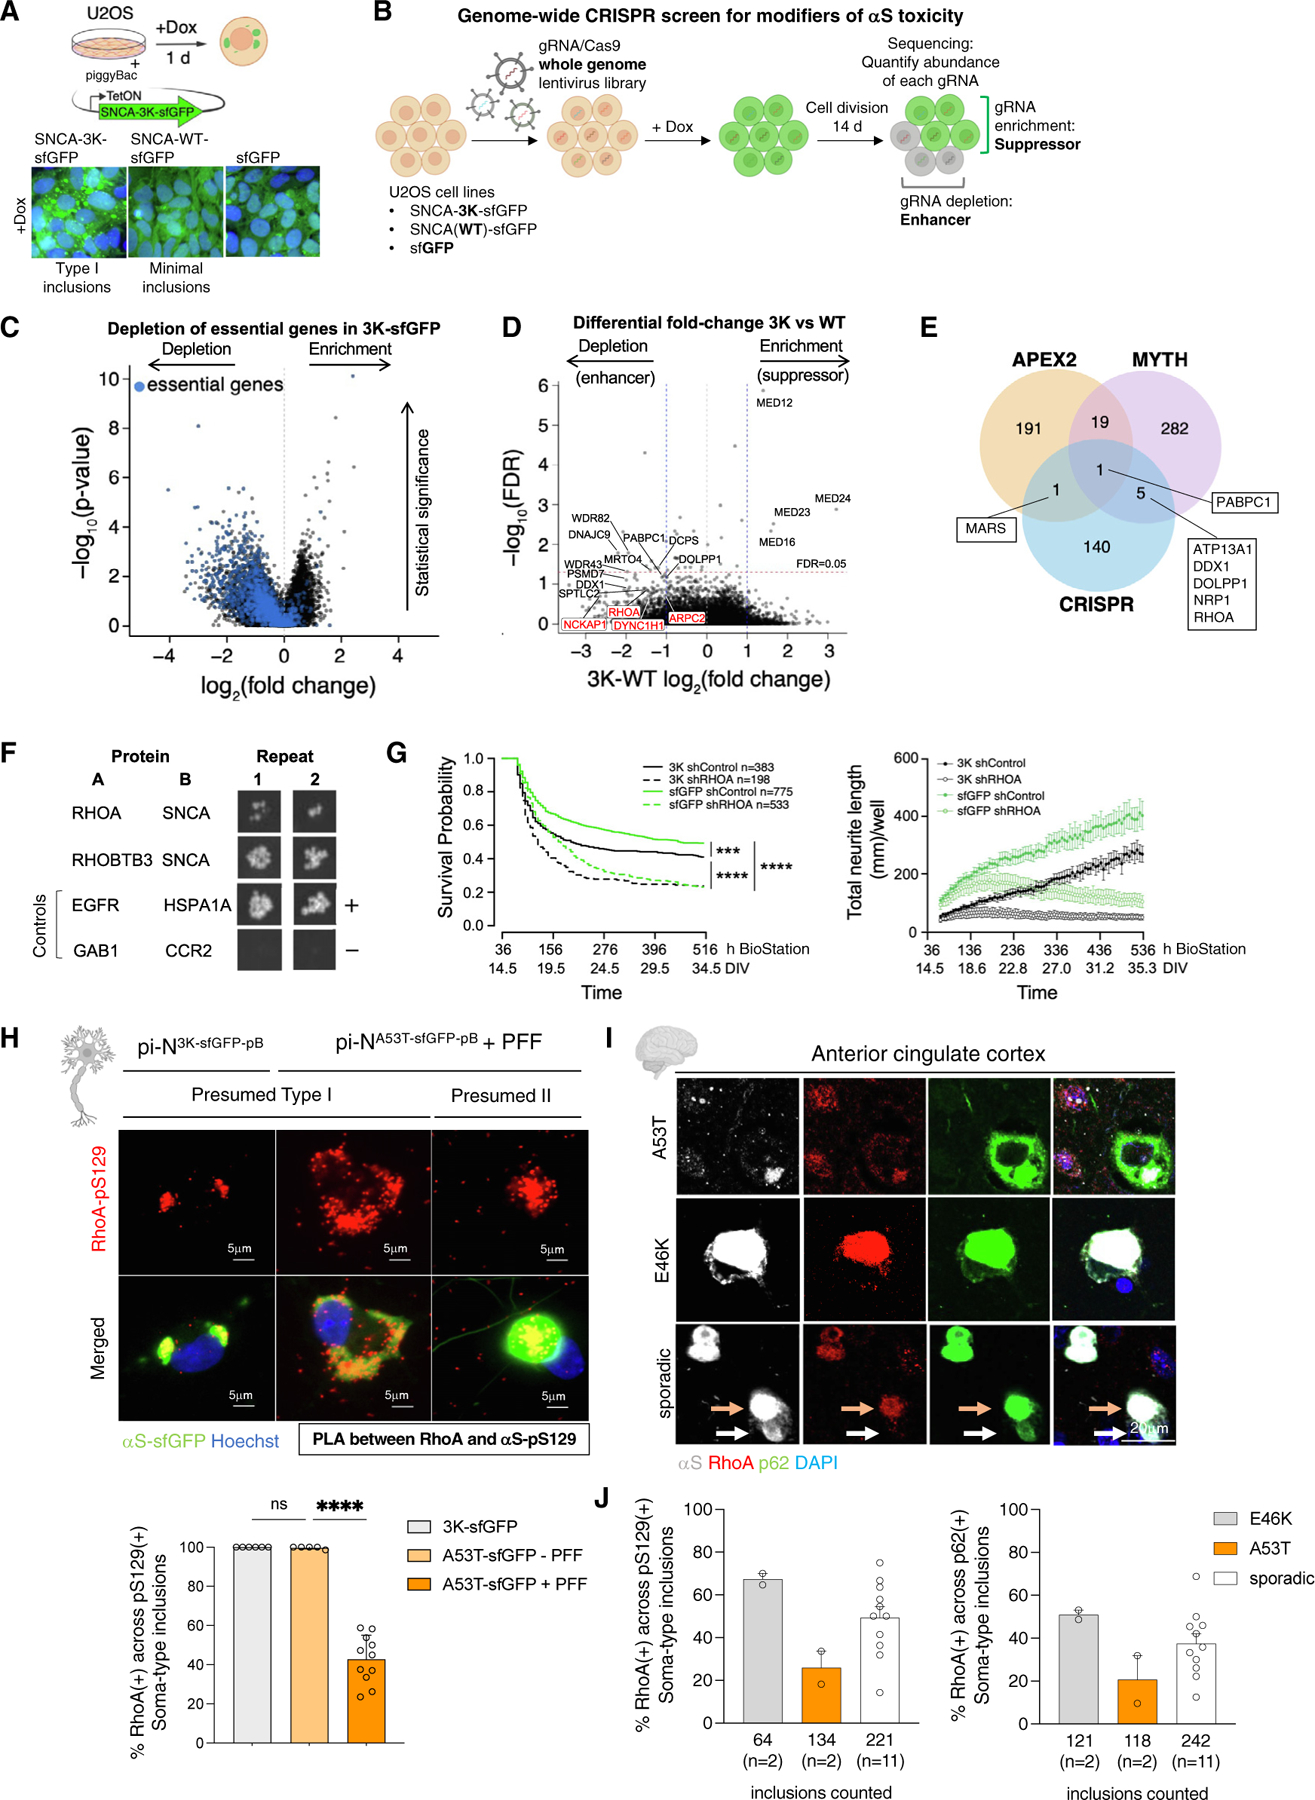
The heterogeneity of protein-rich inclusions and its significance in neurodegeneration is poorly understood. Standard patient-derived iPSC models develop inclusions neither reproducibly nor in a reasonable time frame. Here, we developed screenable iPSC "inclusionopathy" models utilizing piggyBac or targeted transgenes to rapidly induce CNS cells that express aggregation-prone proteins at brain-like levels. Inclusions and their effects on cell survival were trackable at single-inclusion resolution. Exemplar cortical neuron α-synuclein inclusionopathy models were engineered through transgenic expression of α-synuclein mutant forms or exogenous seeding with fibrils. We identified multiple inclusion classes, including neuroprotective p62-positive inclusions versus dynamic and neurotoxic lipid-rich inclusions, both identified in patient brains. Fusion events between these inclusion subtypes altered neuronal survival. Proteome-scale α-synuclein genetic- and physical-interaction screens pinpointed candidate RNA-processing and actin-cytoskeleton-modulator proteins like RhoA whose sequestration into inclusions could enhance toxicity. These tractable CNS models should prove useful in functional genomic analysis and drug development for proteinopathies.

Keywords: CRISPR screen; Lewy body; Parkinson’s disease; Rab protein; RhoA; actin cytoskeleton; aggregation; dementia with Lewy bodies; glia; iPSC; inclusion; lipid; neurodegeneration; neuron; p62; piggyBac; proximity labeling; synucleinopathy; ubiquitin; α-synuclein.


Conflict of interest statement

Declaration of interests V.K. is a cofounder of and senior advisor to DaCapo Brainscience and Yumanity Therapeutics, companies focused on CNS diseases. C.Y.C. and X.J. contributed to this work as employees of Yumanity Therapeutics. T.I. and Y.K. contributed to this work as employees of Nikon Corporation. I.L., A.N., J. Sandoe, and V.K. are inventors on a patent application filed by Brigham and Women’s Hospital related to the induced inclusion iPSC models.

Figures

Figure 1.
Figure 1.. Overview of piggyBac-induced iPSC proteinopathy models
(A) Classification of piggyBac-induced (pi) iPSC proteinopathy model system. (B) A modified piggyBac (pB) vector for transdifferentiation of iPSCs into cortical neurons. (C) Immunofluorescence (IF) staining and quantification of neurons (pi-Ns) transdifferentiated from H9 hESC confirm cortical glutamatergic neuron identity (layer II/III). (D) Modified pB vector with NFIB-SOX9 allows iPSC transdifferentiation into astrocytes. (E) Left, IF of H9 hESC-derived pB-induced astrocytes (pi-A) stained for canonical astrocyte markers. Right, IF quantification. (F) Summary of iPSC lines introduced with pB-NGN2, pB-NFIB, or pB-NFIB-SOX9. CAG exp. dis., CAG expansion disease. (G) Overview of proteinopathy platform, including pathologic (but endogenous) versus transgenic overexpression through targeting to a safe harbor locus (AAVS1), a lineage-specific locus (STMN2), or pB random integration. Quantification of (C) and (E): 4 (C) and 3 (E) independent replicates each across 3 separate neuronal differentiations. Error bars = SD.
Figure 2.
Figure 2.. αS inclusion formation through amyloid seeds is enhanced by pB-based αS overexpression
(A) Schematic diagrams of pathologic overexpression (SNCA 4-copy) (left) and pB transgenic (right) proteinopathy models. Left, generation of isogenic lines with different SNCA copy numbers (pi-NSNCA−4/2/0-copy) by CRISPR-Cas9 gene knockout. pB-NGN2 integration allows neuronal transdifferentiation. Right, generation of a mutation-corrected line (CORR) from an A53T familial PD patient (inset). All-in-one pB-SNCA-IRES-NGN2 integration into CORR iPSC line facilitates doxycycline-inducible overexpression of αS (pi-NSNCA-pB). (B) αS western blot in pi-N models and iPSCs. (C) Quantification of αS levels from (B); paired t test: *p < 0.05, **p < 0.01. (D) Quantification of western blot in pB neurons versus postmortem brain lysate (frontal cortex) from 3 control, 4 LBD, and 3 MSA brains. Related to Figure S2C. (E) αS-pS129 IF in PFF-seeded cortical neurons. Arrows in pi-NSNCA−4/2-copy indicate pS129(+) inclusions. (F) Quantification of (E). (G) Schematic of seed amplification assay (SAA) from LBD and MSA postmortem brain. (H) αS-pS129 IF in pi-NSNCA−4-copy model (left and center) seeded with MSA or LBD αS-PFFs versus postmortem PD and MSA brain inclusions (right). (I) αS-pS129 IF in transgenic pi-NSNCA-pB model seeded with MSA or LBD αS-PFFs. (J) Quantification of (I) (MSA PFFs [n = 3], LBD PFFs [n = 3]). (K) SAA reamplification of CORR/pi-NSNCA-pB neuronal lysates previously seeded with recombinant, MSA, and LBD PFFs (n = 3 each) for 14 days. One-way ANOVA plus Tukey’s multiple comparison test for (D), (F), and (J): *p < 0.05, ****p < 0.0001. Experimental replicates: 3 (C), 3–4 (F), and 2–4 (J) independent replicates each across 3 separate neuronal differentiations. Error bars = SD.
Figure 3.
Figure 3.. Characterization of PFF-seeded inclusionopathy model
(A) αS protein structure (PDB: 1xq8) juxtaposed with linear maps of αS-A53T and αS-A53T-ΔNAC indicating relevant amino acid positions. (B) Schematic outline of seeded inclusionopathy model. (C) pS129 IF in PFF-seeded inclusionopathy model overexpressing sfGFP-tagged or untagged αS. (D) Quantification of (C). (E) SAA reamplification of insoluble αS in PFF-seeded transgenic neurons. (F) Western blot for total αS and pS129 after sequential Triton X-100/SDS extraction of soluble and insoluble protein fractions. (G) Schematic outline of STMN2-driven transgenic αS overexpression. (H) pS129 IF in PFF-seeded versus unseeded STMN2 transgenic models. (I) αS western blot in pB versus STMN2 transgenic lines. (J) Quantification of (I). (K) Quantification of pS129(+) soma-type inclusions in PFF-seeded pB or STMN2 transgenic neurons. One-way ANOVA plus Tukey’s multiple comparison test for (D), (J), and (K): *p < 0.05, **p < 0.01, ***p < 0.001, ****p < 0.0001; ns, not significant. Experimental replicates: 3–5 (D), 3 (J), and 3 (K) independent replicates each across 3 separate neuronal differentiations. Error bars = SD.
Figure 4.
Figure 4.. Inclusion classification is conserved from pi-N model to postmortem brain
(A) Inclusion classification by subcellular location. (B) Ubiquitin and p62 IF of soma-type inclusions in seeded inclusionopathy model. (C) Quantification of pS129, p62, and ubiquitin inclusion immunopositivity in seeded pi-Ns. One-way ANOVA plus Tukey’s multiple comparison test: ***p < 0.001, ****p < 0.0001; n.s., not significant. (D) Left, p62 and αS IF in familial PD brain. Orange arrows, cells with p62(−) inclusions; white arrow, p62(+) inclusion. Right, frequency of p62(+) inclusions in soma and neurites in cingulate cortex of familial PD and sporadic postmortem brains. (E) Immunoreactivity profiles of soma-type inclusions in pi-N model and postmortem PD brain. *Ratios of ubiquitin(+)/pS129(+) inclusions were inferred from pS129/p62 and p62/ubiquitin double stains. Numbers in parentheses indicate total number of inclusions counted. (F) Cross-sectional analysis of seeded inclusionopathy model (DIV25) to evaluate association of inclusion p62 and ubiquitin immunopositivity with intact nuclei (presumed live cell) versus fragmented nuclei (presumed dead cell). Paired t test: *p < 0.05. (G) CLEM for pS129 and p62 in frontal cortex of sporadic PD brain. (H) IF for p62 and LipidSpot in pi-N model. (I) CLEM for pS129 in seeded inclusionopathy model. (J) Left, IF for LipidSpot in pi-NA53T-sfGFP-pB model. Right, quantification of IF. One-way ANOVA plus Tukey’s multiple comparison test: ****p < 0.0001. (K) Inclusion subtype classification in seeded inclusionopathy model. Type II inclusions data are from (F). Experimental replicates: 3 (B), 3 (F), 2–3 (H), 3–4 (J), and 2–3 (K, quantification of Type I LipidSpot(+) inclusions) independent replicates each across 3 separate neuronal differentiations. Error bars = SD.
Figure 5.
Figure 5.. Fusion events between lipid-rich and presumed fibril-rich inclusions
(A) Top, time-lapse imaging of LipidSpot(+) inclusions pre- (T = 0 min) and post-treatment (T = 60 min) with DMSO or trifluoperazine. Bottom, quantification of LipidSpot(+), LipidSpot(−) neurite-type, or soma-type inclusions at T = 60 min post-treatment (3 independent replicates per condition, reproduced across 3 neuronal differentiations using the highest treatment concentrations). (B) Time-lapse imaging in seeded PFF model capturing interaction between LipidSpot(+) inclusions and elongating neurite-type inclusion in the same cell. White arrow, neurite-type inclusion (GFP(+)/LipidSpot(−)). Inset, cell soma with two GFP(+)/LipidSpot(+) inclusions (DIV20), which become one GFP(+)/LipidSpot(−) inclusion (DIV29). (C) Confocal image of adjacent LipidSpot(+) and LipidSpot(−) inclusions. (D) Dynamic lattice light-sheet microscopy (3D rendering) of a LipidSpot(+)/GFP(+) soma-type inclusion. White arrows, small αS-sfGFP aggregates; pink arrowheads, sequestered lipid accumulations; pink arrow, lipid aggregate partially internalized into the inclusion. (E) pS129 and neurofilament IF in sporadic PD brain (frontal cortex) shows soma-type inclusion reminiscent of fusion examples in (B)–(D). (F) CLEM example of αS(+) inclusions with mixed amyloid and lipid pathology in substantia nigra of sporadic PD brain (top) and seeded inclusionopathy model (bottom). (G) Manual longitudinal single-inclusion and single-cell survival tracking. Log rank test: ****p < 0.0001. Error bars = SD.
Figure 6.
Figure 6.. A spontaneous aggregation model recapitulates features of lipid-rich inclusions in seeded inclusionopathy model
(A) Schematic of spontaneous inclusionopathy model. (B) Left, pS129 IF in pi-Ns overexpressing sfGFP-tagged or untagged αS-3K, untagged αS-WT, or sfGFP control. Right, quantification of IF. One-way ANOVA plus Tukey’s multiple comparison test: ****p < 0.0001; ns, not significant. (C) Western blot after sequential TX-100/SDS extraction of soluble and insoluble protein fractions. (D) CLEM for αS-pS129 (leftmost 3 panels) and LipidSpot labeling (right 2 panels) in spontaneous inclusionopathy model. (E) Immunoreactivity profiles of soma-type inclusions in pi-N3K-sfGFP-pB model. Total number of inclusions counted shown in parentheses. (F) Inclusion subtype classification in spontaneous inclusionopathy model. (G) Inclusion survival tracking in spontaneous inclusionopathy model. Examples of GFP(+)/RFP(+) neurons detected in the BioStation CT. (H) Experimental time line for BioStation CT imaging. (I) Example of automated mask for soma-type inclusions. Neuron was identified as dead at the 90 h time point. (J) Kaplan-Meier curve comparing survival probabilities of pi-N3K-sfGFP-pB model with and without inclusions and pi-NsfGFP-pB control neurons. Log rank test: *p < 0.05, ***p < 0.001, ****p < 0.0001. Data are representative of 3 separate neuronal differentiations. Error bars in (B) = SD.
Figure 7.
Figure 7.. Proximity labeling and membrane two-hybrid assay as tools for identifying proteins sequestered in membrane-rich inclusions
(A) Diagram of αS protein-protein interactions within different inclusion subtypes. (B) Cartoon of αS-APEX2 proximity labeling. (C) Rab proteins found in the vicinity of αS by APEX2. (D) Schematic of membrane yeast two-hybrid (MYTH) assay. (E) Rab-αS protein interaction by MYTH (2 replicate experiments). (F) Rab8 IF in seeded and spontaneous inclusionopathy models. (G) Quantification of Rab(+)/pS129(+) inclusions in seeded and spontaneous inclusionopathy models. (H) In situ detection of Rab8 and pS129 interaction by proximity ligation assay (PLA). Bottom, quantification of pS129(+)/Rab8(+) soma-type inclusions. One-way ANOVA plus Tukey’s multiple comparison test: ****p < 0.0001; n.s., not significant. (I) IF for Rab8, p62, and αS in familial A53T and E46K (n = 2 each) and sporadic PD (n = 11) brain. (J) Left, quantification of pS129(+)/Rab8(+) inclusions in PD brain. Right, quantification of (I). Experimental replicates: 3 (G) and 3–4 (H) independent replicates each across 3 separate neuronal differentiations. Error bars = SD.
Figure 8.
Figure 8.. Convergence of CRISPR screen and MYTH on cytoskeleton regulators leads to identification of RhoA(+) inclusions in postmortem brain
(A) Cartoon of U2OS model harboring pB-SNCA-3K-sfGFP transgene. Micrographs show transgene GFP signal in doxycycline-treated cells. (B) Genome-wide CRISPR-Cas9 knockout screen for modifiers of αS toxicity. (C) Volcano plot showing depletion of essential genes (blue). (D) Volcano plot comparing fold-change differential between SNCA-3K-sfGFP and SNCA-WT-sfGFP genotypes. (E) Overlap between spatial (APEX2 and MYTH) and genetic (CRISPR) screen hits. (F) Interaction of actin cytoskeleton-related proteins RhoA and RhoBTB3 with αS by MYTH. (G) Left, Kaplan-Meier curve of single-cell survival tracking in pi-N3K-sfGFP-pB and pi-NsfGFP-pB models transduced with shRNA lentivirus. Log rank test: ***p < 0.001, ****p < 0.0001. Data are representative of 2 neuronal differentiations with shRNA lentivirus at MOI20. Right, neurite measurement based on RFP signal. (H) PLA of RhoA-pS129 in inclusionopathy models. Bottom, quantification of pS129(+) soma-type inclusions from 3 to 4 independent replicates across 3 separate neuronal differentiations. One-way ANOVA plus Tukey’s multiple comparison test: ****p < 0.0001; n.s., not significant. (I) IF for RhoA, p62, and αS in A53T (n = 2), E46K (n = 2), and sporadic (n = 11) PD brain. Orange arrow, αS(+)/p62(+)/RhoA(+) inclusion; white arrow, αS(+)/p62(+)/RhoA(−) inclusion. (J) Left, quantification of pS129(+)/RhoA(+) inclusions in PD brain. Right, quantification of (I). Error bars = SD.

References

    1. Lam I, Hallacli E, and Khurana V (2020). Proteome-Scale Mapping of Perturbed Proteostasis in Living Cells. Csh. Perspect. Biol 12, a034124. 10.1101/cshperspect.a034124. - DOI - PMC - PubMed
    1. Kaufman SK, Sanders DW, Thomas TL, Ruchinskas AJ, Vaquer-Alicea J, Sharma AM, Miller TM, and Diamond MI (2016). Tau Prion Strains Dictate Patterns of Cell Pathology, Progression Rate, and Regional Vulnerability In Vivo. Neuron 92, 796–812. 10.1016/j.neuron.2016.09.055. - DOI - PMC - PubMed
    1. Peng C, Gathagan RJ, Covell DJ, Medellin C, Stieber A, Robinson JL, Zhang B, Pitkin RM, Olufemi MF, Luk KC, et al. (2018). Cellular milieu imparts distinct pathological α-synuclein strains in α-synucleinopathies. Nature 557, 558–563. 10.1038/s41586-018-0104-4. - DOI - PMC - PubMed
    1. Van der Perren A, Gelders G, Fenyi A, Bousset L, Brito F, Peelaerts W, Van den Haute C, Gentleman S, Melki R, and Baekelandt V (2020). The structural differences between patient-derived α-synuclein strains dictate characteristics of Parkinson’s disease, multiple system atrophy and dementia with Lewy bodies. Acta Neuropathol 139, 977–1000. 10.1007/s00401-020-02157-3. - DOI - PMC - PubMed
    1. Yang Y, Shi Y, Schweighauser M, Zhang X, Kotecha A, Murzin AG, Garringer HJ, Cullinane PW, Saito Y, Foroud T, et al. (2022). Structures of α-synuclein filaments from human brains with Lewy pathology. Nature 610, 791–795. 10.1038/s41586-022-05319-3. - DOI - PMC - PubMed

Substances