. 2024 Aug 13;57(8):1908-1922.e6.
doi: 10.1016/j.immuni.2024.07.004. Epub 2024 Jul 29.

Cancer stem cells release interleukin-33 within large oncosomes to promote immunosuppressive differentiation of macrophage precursors

Affiliations

Cancer stem cells release interleukin-33 within large oncosomes to promote immunosuppressive differentiation of macrophage precursors

Hannah L Erickson et al. Immunity. .

Abstract

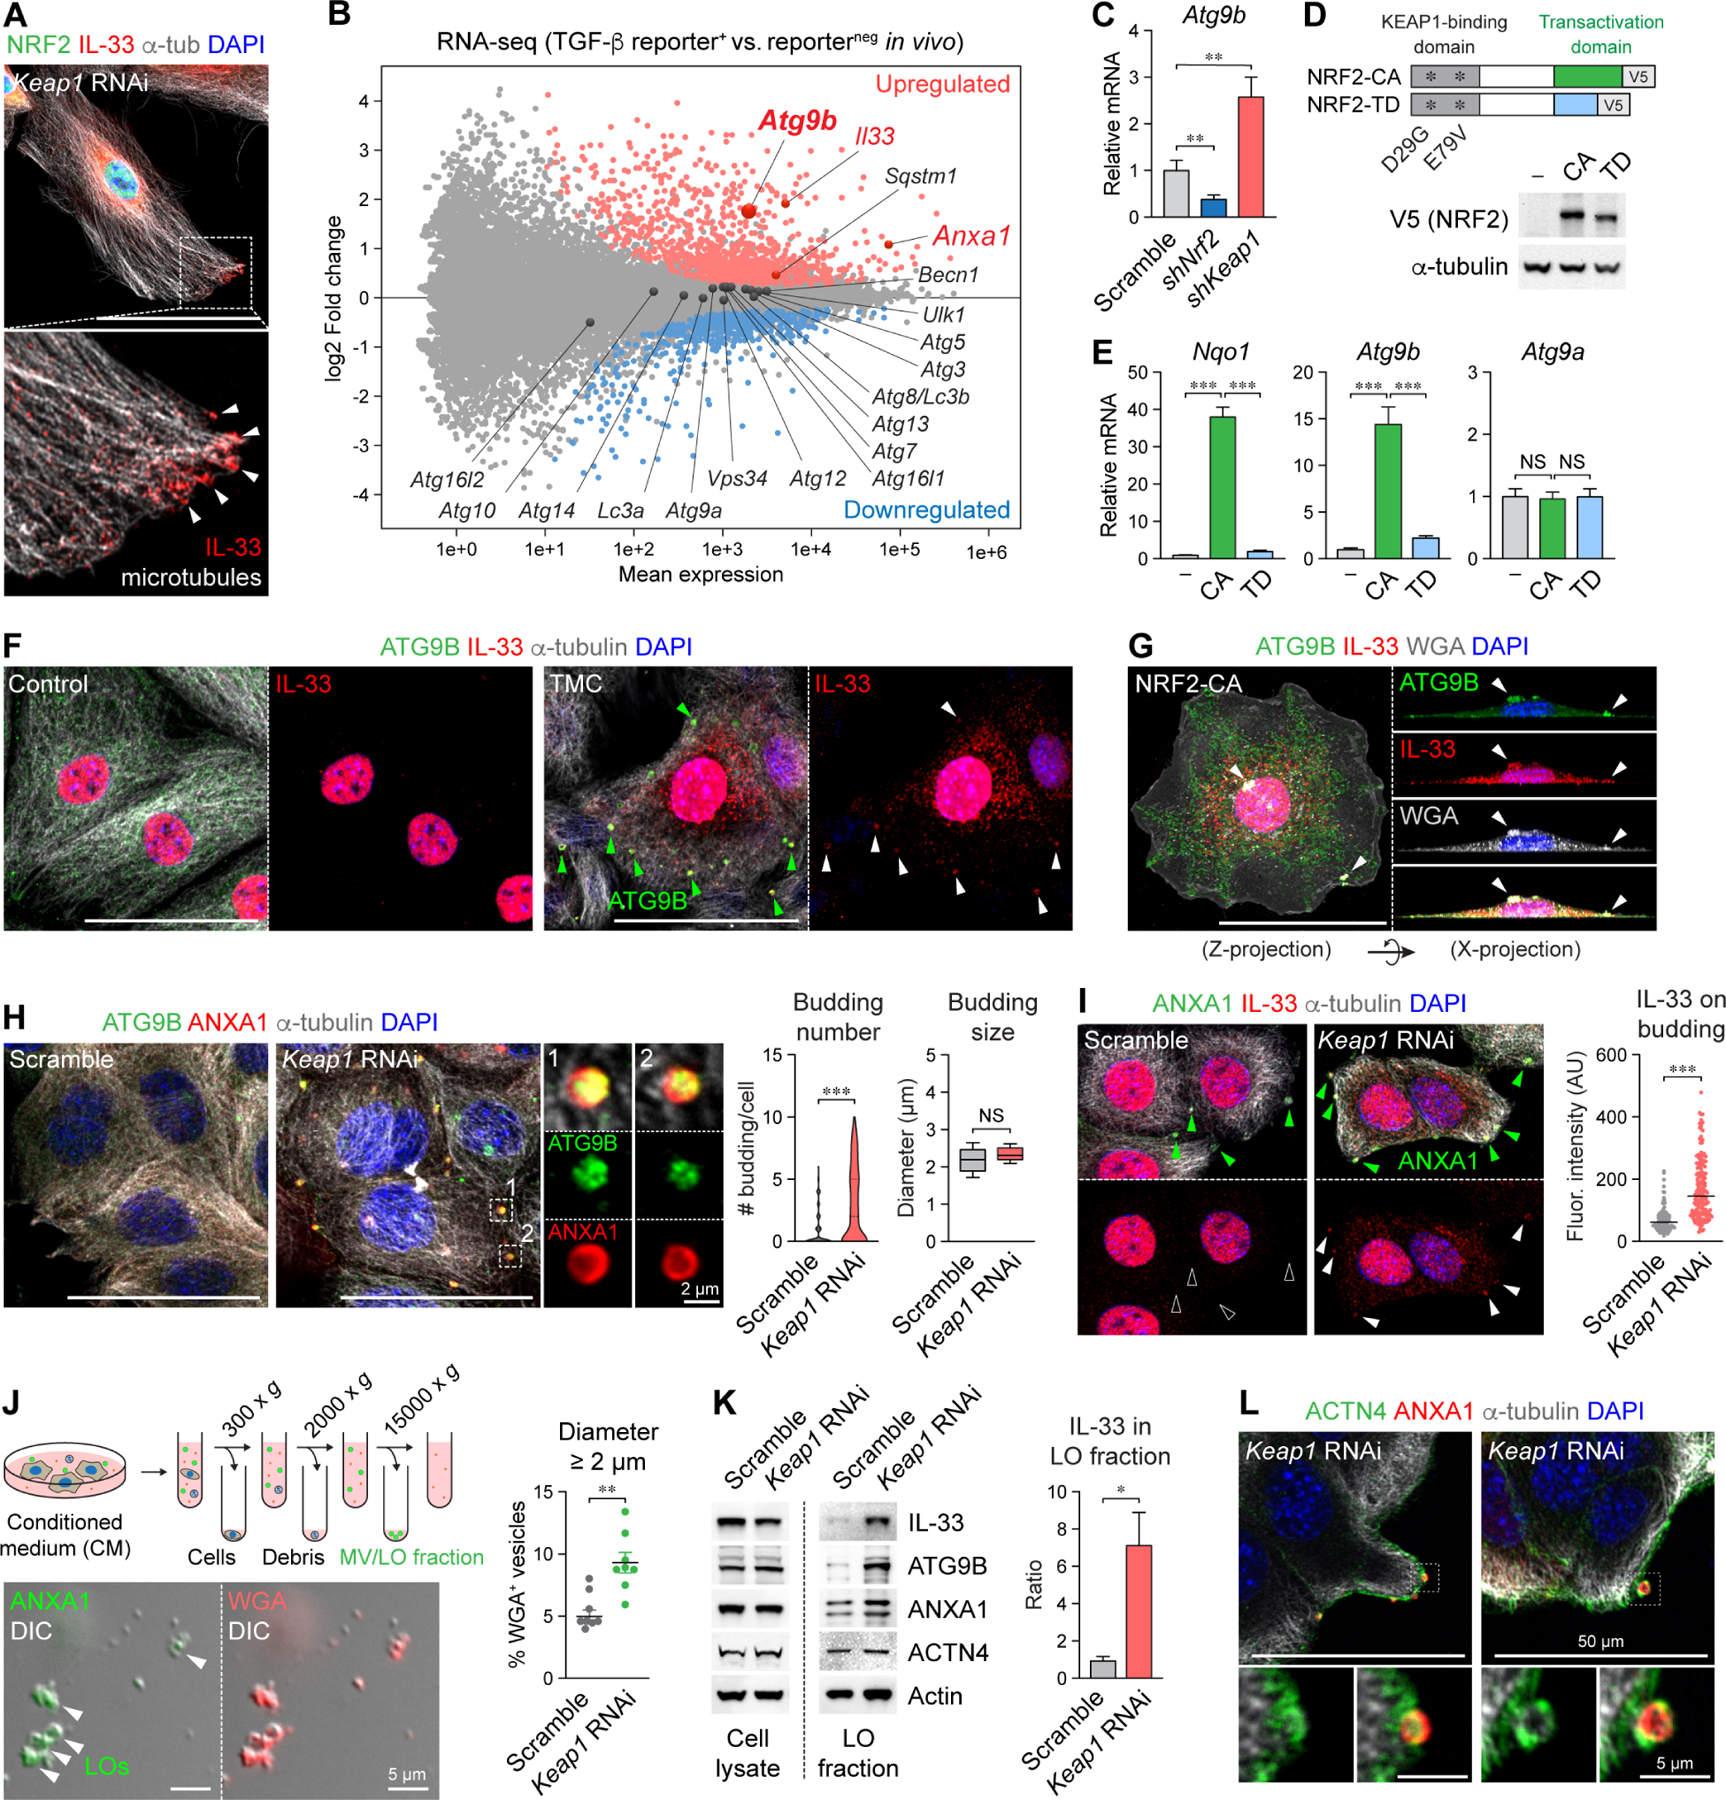
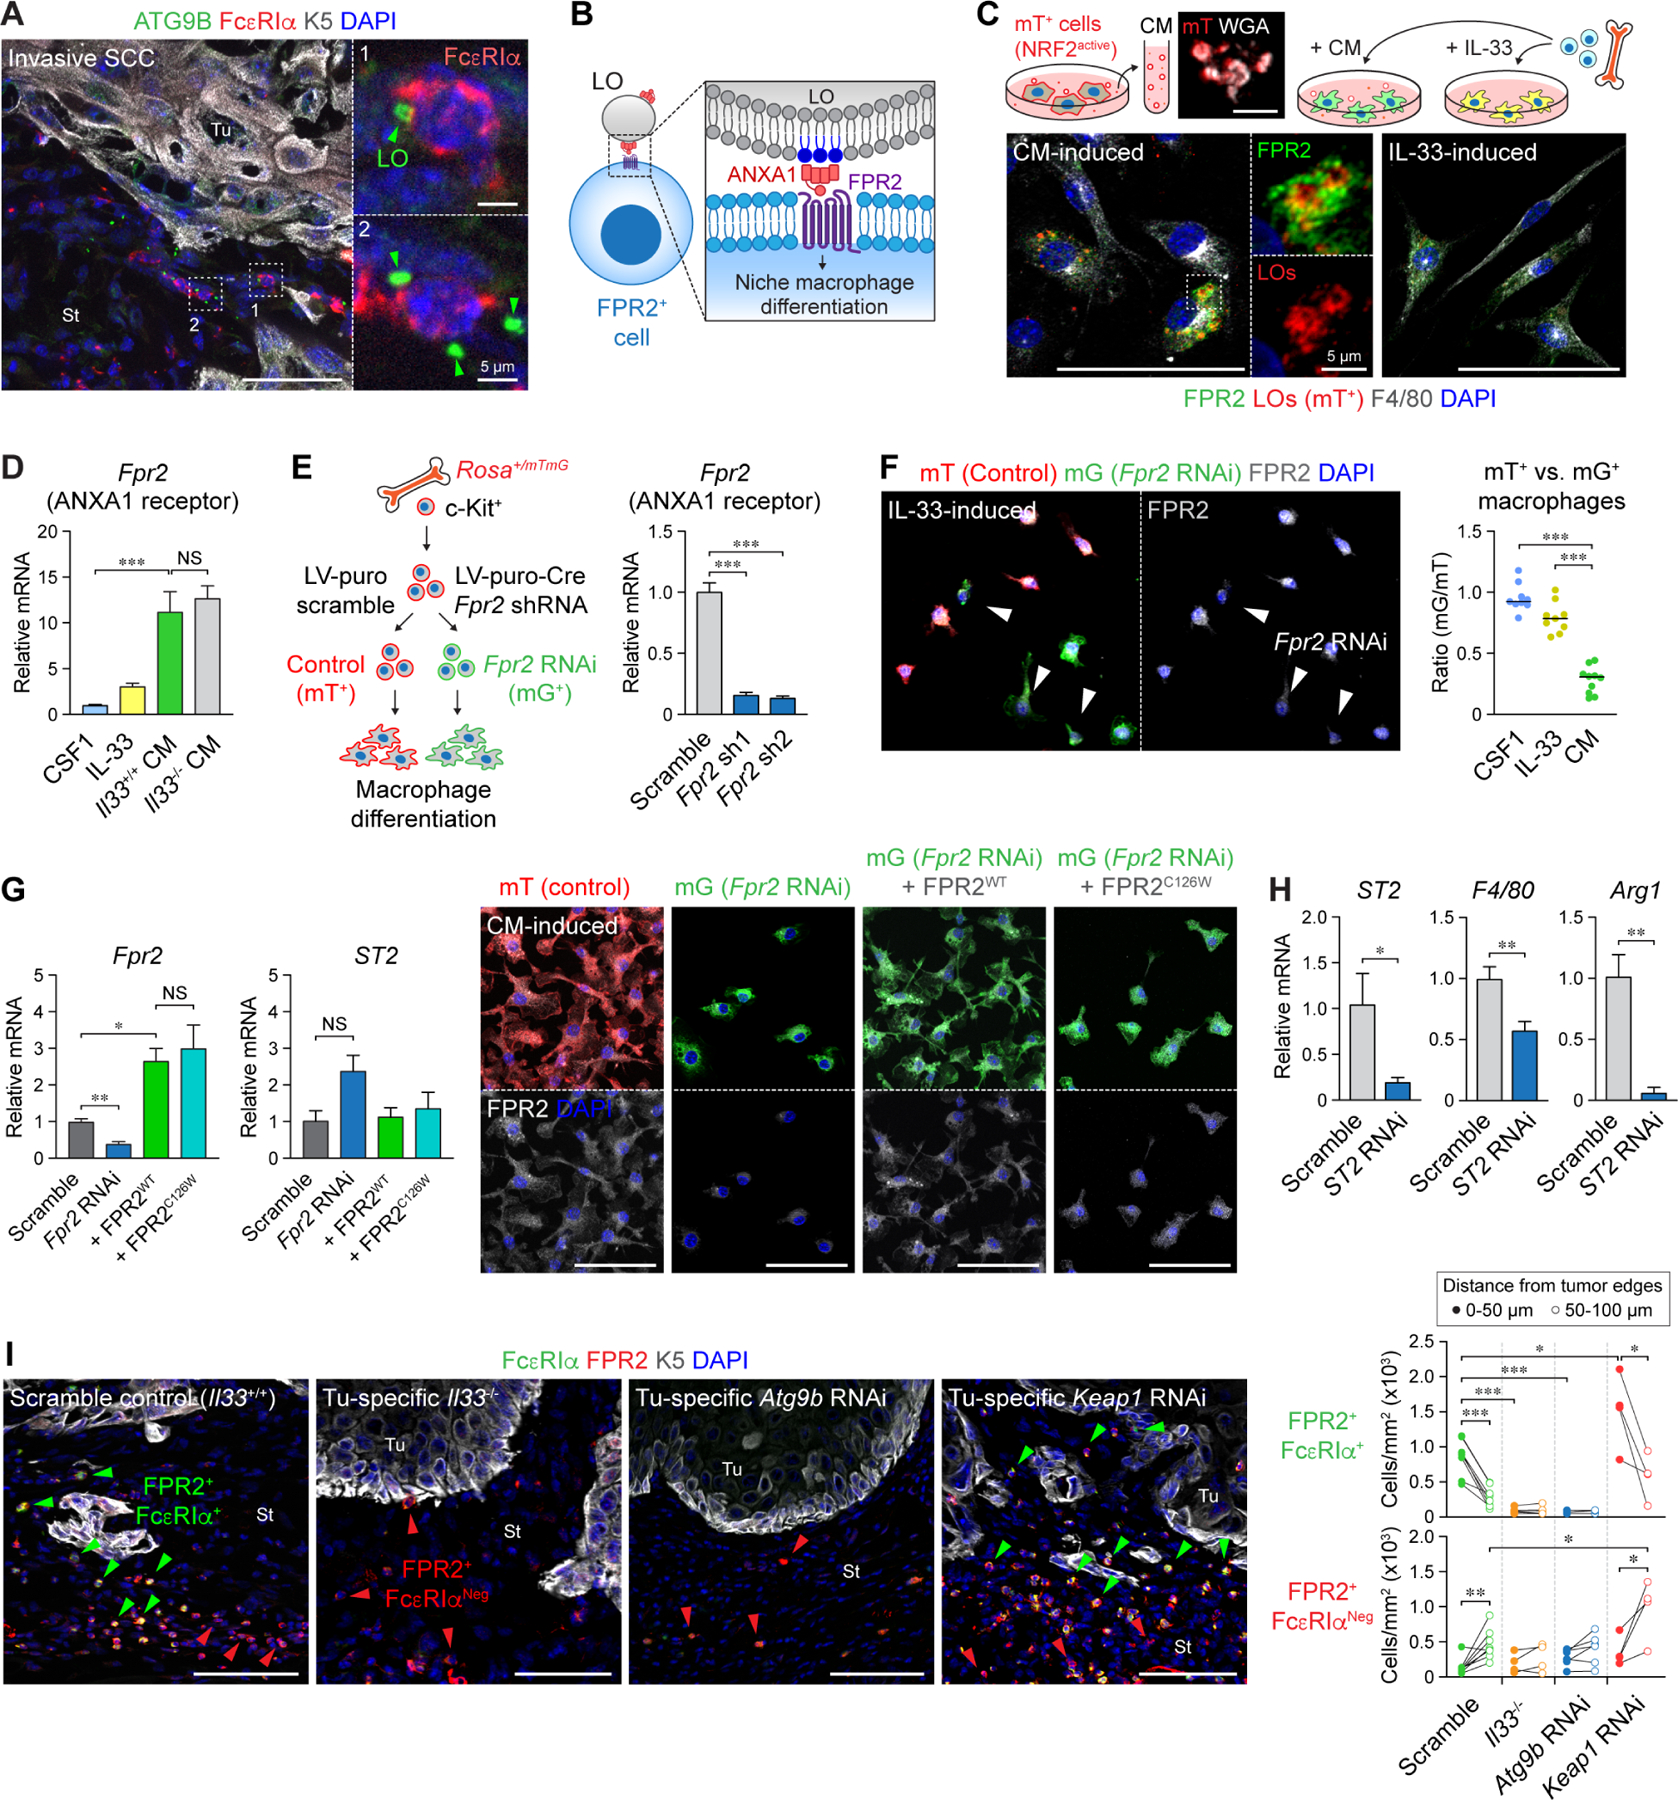
In squamous cell carcinoma (SCC), macrophages responding to interleukin (IL)-33 create a TGF-β-rich stromal niche that maintains cancer stem cells (CSCs), which evade chemotherapy-induced apoptosis in part via activation of the NRF2 antioxidant program. Here, we examined how IL-33 derived from CSCs facilitates the development of an immunosuppressive microenvironment. CSCs with high NRF2 activity redistributed nuclear IL-33 to the cytoplasm and released IL-33 as cargo of large oncosomes (LOs). Mechanistically, NRF2 increased the expression of the lipid scramblase ATG9B, which exposed an "eat me" signal on the LO surface, leading to annexin A1 (ANXA1) loading. These LOs promoted the differentiation of AXNA1 receptor+ myeloid precursors into immunosuppressive macrophages. Blocking ATG9B's scramblase activity or depleting ANXA1 decreased niche macrophages and hindered tumor progression. Thus, IL-33 is released from live CSCs via LOs to promote the differentiation of alternatively activated macrophage, with potential relevance to other settings of inflammation and tissue repair.

Keywords: ATG9b; FPR2; IL-33; annexin A1; cancer stem cell niche; cancer stem cells; large oncosomes; macrophages; squamous cell carcinoma; tumor microenvironment.


Conflict of interest statement

Declaration of interests The authors declare no competing interests.

Figures

Figure 1.
Figure 1.. NRF2 activation induced the nuclear-to-cytoplasmic translocation of IL-33.
(A) Il33flox-IRES-GFP mouse with loxP sites flanking exons 5–7 of the Il33 gene and a GFP reporter inserted into the 3’ UTR. Immunostaining of normal mouse skin (8 weeks old) showing co-expression of GFP reporter and nuclear IL-33 protein. (B) Epidermis-specific lentiviral (LV)-rtTA transduction in utero and doxycycline (Dox)-inducible HRASG12V expression for SCC formation. Immunostaining of SCC in situ displaying nuclear IL-33 and invasive SCC showing nuclear and cytoplasmic IL-33. (C) Quantification of GFP+ cells in epithelial cells (left) and cells with cytoplasmic IL-33 staining among GFP+ cells (right) (n = 4–7). Data shown as scatter plot with median. (D) Immunoblots show NRF2 stabilization when cells were treated with TMC, a chemical NRF2 activator. (E) qPCR analysis of Gsta1, confirming TMC-induced NRF2 activation (n = 3). Data shown as a relative mean expression with SEM. (F) Immunostaining of control and Nrf2-depleted cells treated with or without TMC. Cells with scramble shRNA (control) show nuclear NRF2 and cytoplasmic IL-33 after TMC treatment, but Nrf2-depleted cells maintain nuclear IL-33. Leptomycin B pre-treatment suppressed nuclear export of IL-33 in TMC-treated, NRF2-activating cells. (Graph) The ratio between cytoplasmic and total IL-33 signal intensity (n = 37–50 IL-33-expressing cells). Data shown as scatter plot with median. (G) Nuclear protein HMGB1 does not show the same nuclear export as IL-33 when treated with TMC. Data were analyzed with unpaired t-test, ***P < 0.001. Scale bars, 50 μm.
Figure. 2.
Figure. 2.. ATG9B mediated the NRF2-induced IL-33 release via ANXA1+ large oncosomes.
(A) Immunostaining of Keap1-depleted cells. (B) MA plot of RNA-seq data comparing TGF-β-responding tumor cells vs. nonresponding counterparts in vivo. Red and blue dots indicate significantly up- and down-regulated genes, respectively (adj. P < 0.01). (C) qPCR analysis of Atg9b showing its increased and decreased expression by NRF2 activation and depletion, respectively. Data shown as relative mean expression with SEM. (D) Depiction of NRF2 mutants: NRF2-CA has mutations in the KEAP1-binding domain, thus escaping degradation. NRF2-TD lacks 16 amino acids at the C-terminal of NRF2-CA. Immunoblotting of NRF2 mutants detected by the V5-tag. (E) qPCR analysis of Nqo1, Atg9b, and Atg9a. Data shown as relative mean expression with SEM. (F and G) Immunostained control and TMC-treated (F) and NRF2-CA (G) cells exhibit prominent ATG9B+ signals on the cell surface (arrowheads), in addition to cytoplasmic vesicular signals. (Right) X-projection of the same cell highlights outward membrane budding labeled with WGA (arrowheads). (H) ATG9B signal on Keap1-depleted cells was surrounded by ANXA1 (insets). Quantification of the number and size of ANXA1+ buddings (n = 5, 84–94 cells, 103–512 buddings). Data shown as violin and box-and-whisker plots. (I) Keap1-depleted cells exhibit higher IL-33 intensity in ANXA1+ budding. Data shown in scatter plot with median. (J) Depiction of serial centrifugation of the conditioned medium (CM) from NRF2-activating cells. 15,000 × g pellets were analyzed by light microscopy and immunoblotting (see Figure 2K). The proportion of large vesicles (≥ 2 μm in diameter) in the total WGA+ microvesicle fraction (n = 3, eight images with 1,505–2,228 vesicles). Data shown as scatter plot with mean ± SEM. (K) Immunoblot analysis of whole cell lysates and the microvesicle/LO fraction. Actin was used as a loading control. Data shown as ratio mean with SEM. (L) ACTN4 signal on Keap1-depleted cells was observed on ANXA1+ budding structures (insets). Data were analyzed with unpaired t-test. *P < 0.05, **P < 0.01, ***P < 0.001. Scale bars, 50 μm, unless otherwise indicated.
Figure 3.
Figure 3.. IL-33-containing LOs induced alternatively activated macrophages in vitro.
(A) qPCR analysis of macrophages induced by CM from control, Nrf2-depleted, or Keap1-depleted cells. Data shown as mean with SEM. (B) Experimental set up for bone marrow cell-derived macrophage culture (left). The frequency of F4/80+ macrophages among live CD45+ CD11b+ cells, analyzed by flow cytometry (right) (n = 6–8). Data shown as mean with SEM. (C) qPCR analysis of macrophages induced by CSF1, IL-33, and CM. Data are shown as mean with SEM. (Right) Histogram presentation of CD206 and FcεRIα surface expression in F4/80+ macrophages from these conditions. Mean fluorescence intensity (MFI) of CD206 or FcεRIα signal was measured from F4/80+ macrophages induced by CSF1, IL33, or CM (n = 7–8). Data are shown as scatter plot with mean ± SEM. (D) qPCR analysis of macrophages induced by unfiltered or 0.45 μm pore-filtered CM from Keap1-depleted (i.e., NRF2-activating) cells. Data shown as mean with SEM. (E) The frequency of F4/80+ macrophages among live CD45+ CD11b+ cells induced by unconditioned medium (−), CM from Keap1-depleted cells, and purified LOs analyzed by flow cytometry (n = 4). (Right) Histogram presentation of CD206 and FcεRIα surface expression in F4/80+ macrophages from these conditions. MFI of CD206 and FcεRIα signal was measured from F4/80+ macrophages induced by unconditioned medium (−), CM, or LOs (n = 3–10). Data are shown as scatter plot with mean ± SEM. (F) qPCR analysis of macrophages induced by the LO-enriched fraction and its flow-through. Data shown as mean with SEM. (Right) Histogram presentation of CD206 and FcεRIα surface expression in F4/80+ macrophages from these conditions. MFI of CD206 signal was measured from F4/80+ macrophages in these conditions (n = 4). Data shown as scatter plot with mean ± SEM. (G) Immunofluorescence of Il33+/+ (Il33flox-IRES-GFP) and Il33−/− (Il33flox-IRES-GFP; K14-Cre) keratinocytes. (H) Immunoblot analysis of LOs from Il33+/+ and Il33−/− conditions. (I) Experimental setup for CSF1, IL-33, Il33+/+ CM, and Il33−/− CM-induced macrophage differentiation. Immunoblot analysis of cell lysates from experimental setup. (J and K) qPCR analysis of ST2 in macrophages induced by CSF1, IL33, or the CM from Il33+/+ or Il33−/− keratinocytes (n = 3) (J) and LOs or the flow-through from a 100 kD MWCO membranes (K). Data shown as mean with SEM. (L) Immunostaining of NRF2-activating cells transduced with scramble control or Atg9b shRNA. ATG9B and IL-33 colocalize at the cell surface in control cells (arrowheads), whereas Atg9b-depleted cells exhibited diffused IL-33 at the cell periphery (dashed lines). (Right) Quantification of the number of ANXA1+ budding (n = 5–6, 78–134 cells, 30–385 buddings). Data shown as violin plot. (M) Immunostaining analyses of NRF2-activating cells with scramble control or Anxa1 shRNA. ANXA1 and IL-33 were colocalized in control cells (arrowheads), while in Anxa1-depleted cells, IL-33 signals were still localized to the cell edge but without ANXA1 colocalization (arrowheads). Immunoblot analysis of LOs from control and Anxa1-depleted cells. (N) MFI of CD206 and FcεRIα signal was measured from F4/80+ macrophages induced by the CM from control or Anxa1-depleted cells (n = 3–4). Data shown as scatter plot with mean ± SEM. Data were analyzed with unpaired t-test or unpaired ANOVA. *P < 0.05, **P < 0.01, ***P < 0.001. Scale bars, 50 μm.
Figure 4.
Figure 4.. TGF-β-responding tumor cells generate LOs in an ATG9B-dependent manner in vivo.
(A) LV-rtTA containing a TGF-β/SMAD signaling reporter and an shRNA expression cassette used for in utero injection. (Graph) Quantification of ATG9B+ LOs in stromal area non-adjacent and adjacent to TGF-β-responding tumor cells (n = 3, eight TGF-β-reporterneg and 14 TGF-β-reporter+ areas). Data shown as scatter plot with mean ± SEM. (B) Immunodetection of ACTN4 in TGF-β-responding tumor cells (insets). (C) Immunodetection of ATG9B+ LOs in human invasive SCC. (Graph) Quantification data of LOs in well-differentiated SCC (WDSCC) (n = 9) and invasive SCC (n = 13). (D) Immunostaining of ATG9B+ LOs in the stroma of control tumors and tumors with epithelia-specific Atg9b RNAi. (Graphs) HRASG12V-driven control and Atg9b-depleted tumors were sized at 6 weeks after Dox administration (Scramble control, n = 17; shAtg9b-1, n = 8; shAtg9b-2, n = 13). Quantification of ATG9B+ LOs in control and Atg9b-depleted tumors. Data shown as scatter plot with mean with SEM. (E) Immunostaining shows the loss of ANXA1 expression in the tumor epithelia, but not cells in the stroma, by tumor-specific Anxa1 RNAi. (Graph) Control and Anxa1-depleted tumors were sized at 5 weeks after Dox administration (Scramble control, n = 8; shAnxa1, n = 5). Data shown as scatter plot with mean ± SEM. Data were analyzed with unpaired and paired t-test. **P < 0.01, ***P < 0.001. Scale bars, 50 μm, unless otherwise indicated.
Figure 5.
Figure 5.. The ATG9B lipid scramblase activity is required for LO formation and SCC progression.
(A) Immunostaining of non-permeabilized NRF2-activating cells. Cellular membrane and nuclei were visualized by WGA and a cell-permeable DNA dye, Hoechst33342. (B) Schematic of the potential phospholipid scrambling by ATG9B followed by ANXA1 binding. (C) The microvesicle/LO fraction was enriched and immunostained by FITC-conjugated anti-ANXA1 antibody. The fluorescence intensity of ANXA1 on WGA+ vesicles was measured (Scramble control, n = 5, 372 vesicles; Atg9b RNAi, n = 5, 195 vesicles). Data shown as scatter plot with median. (D) Immunoblotting of shRNA-refractory, V5-tagged ATG9BWT and ATG9BSD in Atg9b-depleted cells. (E) Immunostaining of exogenous V5-tagged ATG9BWT and ATG9BSD in Atg9b-depleted cells. Cells expressing ATG9BWT, but not the ATG9BSD, rescued ANXA1+ budding formation (n = 3, 65–137 cells). Data shown as violin plot. (F) qPCR analysis of macrophages induced by the CM of NRF2-activating cells with Atg9b RNAi ± shRNA-refractory ATG9BWT or ATG9BSD (n = 3). Data shown as mean ± SEM. (G) LV-rtTA-tetO-ATG9BWT or SD harboring an Atg9b shRNA was used for in utero injection. Immunostaining of exogenous V5-tagged ATG9BWT and ATG9BSD in tumor-epithelial cells. Formation of LOs was rescued by ATG9BWT, but not ATG9BSD. HRASG12V-driven tumors with scramble control (n = 17), Atg9b RNAi (n = 13), Atg9b RNAi with ATG9BWT (n = 6), and Atg9b RNAi with ATG9BSD (n = 11) were sized at 6 weeks after Dox administration. Data shown as scatter plot with mean ± SEM. Data were analyzed by unpaired t-test. *P < 0.05, ***P < 0.001. Scale bars, 50 μm, unless otherwise indicated.
Figure 6.
Figure 6.. IL-33-containing LOs target the ANXA1 receptor FPR2+ immature myeloid cells to induce niche macrophages.
(A) Immunostaining of ATG9B+ LOs and FcεRIα+ niche macrophages in invasive SCC. (B) Depiction of the potential mechanism of ANXA1+ LO–FPR2+ myeloid cell engagement. (C) The presence of mT+ WGA+ LOs was confirmed in the CM of NRF2-activating mT+ keratinocytes. The CM or recombinant IL-33 was used for macrophage differentiation of bone marrow cells. Immunostaining of FPR2 around mT+ LOs. (D) qPCR analysis of bone marrow cell-derived macrophages induced by the indicated conditions (n = 3). Data shown as mean with SEM. (E) Ex vivo expanded ROSA+/mTmG hematopoietic progenitor cells were transduced with LV-puro-2A-Cre-Fpr2 shRNA, and transduced mG+ cells were selected by puromycin. Fpr2 RNAi was confirmed by qPCR (graph). Data shown as mean with SEM. (F) Immunostaining confirms FPR2 depletion in mG+ cells. (Graph) The equal numbers of mT+ (scramble control) and mG+ (Fpr2-depleted) cells were used for macrophage differentiation with recombinant CSF1, recombinant IL-33, or the CM from NRF2-activating cells, and the ratio between mG+ and mT+ cells at day 6 were compared (n = 3). Data shown as scatter plot with median. (G) qPCR analysis of Fpr2 and ST2 in control, Fpr2 RNAi, and Fpr2 RNAi with shRNA-refractory FPR2WT or FPR2C126W hematopoietic progenitor cells. Data shown as mean with SEM. Immunostaining of CM-induced macrophages showed effective differentiation in control and FPR2WT conditions. In contrast, Fpr2 RNAi ± FPR2C126W conditions did not develop macrophages as effectively. (H) qPCR analysis of shRNA-mediated ST2-depleted macrophages. Data shown as mean with SEM. (I) Immunostaining of SCC with tumor epithelial cell-specific gene depletion as indicated. FPR2+ FcεRIα+ double-positive cells (green arrowheads) often existed in 0–50 μm radius of invasive tumor edges, whereas FPR2+ FcεRIαneg cells (red arrowheads) were found in more distant area (50–100 μm) (n = 3–4). (Graph) Quantification of the density of cells 0–50 or 50–100 μm away from tumor edges are shown as scatter plot and were analyzed by paired (in the same condition) and unpaired (between conditions) t-test. Data were analyzed with unpaired t-test. *P < 0.05, **P < 0.01, ***P < 0.001. Scale bars, 50 μm, unless otherwise indicated.

References

    1. Meacham CE, and Morrison SJ (2013). Tumour heterogeneity and cancer cell plasticity. Nature 501, 328–337. 10.1038/nature12624. - DOI - PMC - PubMed
    1. Kreso A, and Dick JE (2014). Evolution of the cancer stem cell model. Cell Stem Cell 14, 275–291. 10.1016/j.stem.2014.02.006. - DOI - PubMed
    1. Nassar D, and Blanpain C (2016). Cancer Stem Cells: Basic Concepts and Therapeutic Implications. Annual Review of Pathology: Mechanisms of Disease 11, 47–76. 10.1146/annurev-pathol-012615-044438. - DOI - PubMed
    1. Clarke MF (2019). Clinical and Therapeutic Implications of Cancer Stem Cells. New England Journal of Medicine 380, 2237–2245. 10.1056/nejmra1804280. - DOI - PubMed
    1. Plaks V, Kong N, and Werb Z (2015). The Cancer Stem Cell Niche: How Essential Is the Niche in Regulating Stemness of Tumor Cells? Cell Stem Cell 16, 225–238. 10.1016/j.stem.2015.02.015. - DOI - PMC - PubMed

Publication types

LinkOut - more resources