. 2025 Jun;43(6):948-959.
doi: 10.1038/s41587-024-02339-4. Epub 2024 Jul 30.

A CAR enhancer increases the activity and persistence of CAR T cells

Affiliations

A CAR enhancer increases the activity and persistence of CAR T cells

Taha Rakhshandehroo et al. Nat Biotechnol. 2025 Jun.

Abstract

Although chimeric antigen receptor (CAR) T cell therapies have demonstrated promising clinical outcomes, durable remissions remain limited. To extend the efficacy of CAR T cells, we develop a CAR enhancer (CAR-E), comprising a CAR T cell antigen fused to an immunomodulatory molecule. Here we demonstrate this strategy using B cell maturation antigen (BCMA) CAR T cells for the treatment of multiple myeloma, with a CAR-E consisting of the BCMA fused to a low-affinity interleukin 2 (IL-2). This selectively induces IL-2 signaling in CAR T cells upon antigen-CAR binding, enhancing T cell activation and antitumor activity while reducing IL-2-associated toxicities. We show that the BCMA CAR-E selectively binds CAR T cells and increases CAR T cell proliferation, clearance of tumor cells and development of memory CAR T cells. The memory cells retain the ability to re-expand upon restimulation, effectively controlling tumor growth upon rechallenge. Mechanistic studies reveal the involvement of both CAR and IL-2 receptor endodomains in the CAR-E mechanism of action. The CAR-E approach avoids the need for specific engineering and enables CAR T cell therapy with lower cell doses.


Conflict of interest statement

Competing interests: T.R. and M.R. are inventors on a related patent application. M.R. is the scientific founder of Koi Biotherapeutics. C.A.J. serves as a consultant for Kite/Gilead, Novartis, BMS, Sana, Synthekine, Janssen, Miltenyi, Caribou, Galapagos, ADC Therapeutics, AstraZeneca and Abbvie, and receives research funding from Kite/Gilead. O.N. receives research support from Takeda and Janssen, participates on advisory boards for Bristol Myers Squibb, Janssen, Sanofi, Takeda and GPCR Therapeutics, and receives honoraria from Pfizer. The other authors declare no competing interests.

Figures

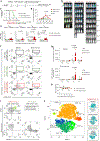
Fig. 1 |
Fig. 1 |. Design and characterization of the BCMA CAR-E.
a, Schematic of the CAR-E therapeutic platform. Left: the general design of the CAR-E. Right: the structure of the developed BCMA–mutIL-2 CAR-E. b, The BCMA–mutIL-2 CAR-E binds to BCMA CAR T cells with high specificity and affinity. Nontransduced T cells and VHH–mutIL-2 were used as controls. A secondary AlexaFluor647-labeled anti-FLAG antibody was used for staining. Error bars represent the mean ± 95% CI. c,d, Incubation of rested BCMA CAR T cells for 24 h with the BCMA CAR-E treatment results in dose-dependent activation of CAR T cells (c) but not nontransduced T cells (d). In c, the results of the unpaired t-test indicated a statistically significant (P ≤ 0.0001) increase in activation in the BCMA–mutIL-2 treatment group compared to the VHH–mutIL-2, BCMA–CH3 or their combination control groups at a concentration of 0.1 nM or higher. Error bars represent the mean ± 95% CI. In d, no treatment and CD3–CD28 activation were used as negative and positive controls, respectively. Error bars represent the mean ± 95% CI. An unpaired two-sided t-test was used. NS, not significant. e, The BCMA–mutIL-2 CAR-E does not block the killing efficacy of the CAR T cells. OPM2 cells were coincubated with BCMA CAR T cells or nontransduced T cells (E:T ratio of 1:1; 30,000 cells of each) in the presence of varying concentrations of the CAR-E or the control VHH–mutIL-2. Treatments were allowed to remain in the mixture either for the entire duration of the experiment or for 3 h, as indicated in the legend. Live (PI) OPM2 cells were counted 40 h later. Error bars represent the mean ± s.d. f, The BCMA–mutIL-2 CAR-E results in the phosphorylation of STAT5 in CAR T cells. The percentage of CAR T cells stained positive for pSTAT5 is shown, as assessed by flow cytometry. BCMA CAR T cells were treated with the indicated treatments followed by the assessment of STAT5 phosphorylation. For the preblocking experiments, the BCMA CAR T cells were treated with BCMA–CH3 (100 nM) for 20 min at 4 °C before exposure to the CAR-E treatment at 37 °C. Error bars represent the mean ± s.d. For bf, n = 3 technical replicates for each point.
Fig. 2 |
Fig. 2 |. CAR-E treatment results in enhanced persistence of CAR T cells in vivo.
a, Assessment of the circulating half-life of the BCMA CAR-E. NSG mice were administered 8 mg kg−1 of the BCMA–mutIL-2 CAR-E (i.p., n = 3). Blood samples were collected by tail-vein puncture at five different time points (30 min, 2 h, 8 h, 24 h and 48 h) after administration. An ELISA was performed to determine the concentration of the treatments in the sera. The circulating half-life was estimated to be ~1.5 h. Error bars represent the mean ± s.d. b, NSG mice were injected with OPM2 (human MM) cells followed by BCMA CAR (human) T cell administration according to the schedule. The BCMA–mutIL-2 CAR-E treatment (200 μg or less per dose, as indicated in Supplementary Fig. 5) was administered twice per week for 2 weeks, followed by once per week until the endpoint. c, Flow cytometric analyses performed 1 month or longer after injection of CAR T cells showed persistence of BCMA CAR T cells in the spleen (left) and bone marrow (right) of treated mice compared to control mice. BCMA CAR T cells were detected by costaining with an anti-human CD45 antibody and AlexaFluor647-labeled BCMA. Similar results were obtained in repeated experiments. Additional control cohorts received VHH–mutIL-2 treatment with the same dose and schedule (200 μg or less per dose, as indicated in Supplementary Fig. 5). d, Pooled data from the experiments in c are shown. PBMCs from four different donors were used for the experiments. A one-way analysis of variance (ANOVA) with a post hoc Tukey’s test was used for normal data (spleen) and a Kruskal–Wallis test with a post hoc Dunn’s test was used for non-normal data (bone marrow). Individual flow graphs for the pooled data are presented in Supplementary Fig. 5 and summarized in Supplementary Table 1. Error bars represent the mean ± s.d. e, Further analyses revealed that BCMA–mutIL-2 treatment had a stronger effect on CD8+ CAR T cells, increasing their proportion from ~30% to ~70% of total CD4+ and CD8+ CAR T cells. ‘CAR + VHH–mutIL-2’ or ‘CAR + PBS’ cohorts did not yield sufficient persisting CAR T cells for similar analyses. Data were analyzed by group mean comparisons using a one-way ANOVA and subsequent Tukey post hoc analysis. Error bars represent the mean ± s.d.
Fig. 3 |
Fig. 3 |. The BCMA CAR-E enables treatment with a low dose of CAR T cells.
a, Experimental setup. b,c, BLI analyses monitoring tumor burden in different groups (b), along with a survival analysis (c). The same quantification scale was used for all images (photons per second). d, Analyses of blood samples revealed that the CAR-E expands CAR T cells in the circulation. Data were analyzed with a one-way ANOVA on days 7, 14 and 21. Once all mice in the PBS cohort were euthanized, BCMA–mutIL-2 and VHH–mutIL-2 comparisons were performed with multiple Mann–Whitney U tests on days 28 and 35. Error bars represent the mean ± s.e.m. e, Analysis of blood samples showed the generation of memory CAR T cells in the BCMA–mutIL-2 group. Data were analyzed using uncorrected multiple Mann–Whitney U tests. Error bars represent the mean ± s.e.m. f,g, For the BCMA–mutIL-2 cohort, 2 months after CAR T cell injection, a substantial number of CAR T cells were detected in the spleen. In the ‘CAR T cell + PBS’ group, CAR T cells were detected in the spleen; however, these mice succumbed to tumor growth at around 20 days after CAR T cell injection. Data were analyzed by a two-way ANOVA with Tukey’s multiple-comparisons test. Individual flow data are shown in Supplementary Fig. 6. Error bars represent the mean ± s.e.m. h, The treated mice maintained consistent body weight throughout the experiment. Error bars represent the mean ± s.e.m. i, Persisting CAR T cells in the BCMA–mutIL-2-treated mice’s spleen exhibited a CCR7+CD45RA+CD62L+ stem-cell memory phenotype, which was absent in the ‘CAR T cell + VHH–mutIL-2’ or ‘CAR T cell + PBS’ cohorts. j, tSNE plot displaying FlowSOM-defined clusters among persisting BCMA CAR T cells from BCMA–mutIL-2-treated mice (spleen and bone marrow) and VHH–mutIL-2-treated mice (only bone marrow). tSNE plot was based on surface marker expression of CD8α, CD4, CD45, CD45RA, CD45RO, CD62L, CD69, PD1, HLA-DR, CCR7 and BCMA CAR and revealed the presence of distinct memory T cell populations. CAR T cells were detected in the bone marrow of the VHH–mutIL-2-treated group but not the spleen. Further analyses are shown in Supplementary Fig. 7. The experiments in aj used PBMCs from one donor; sample sizes were n = 4, 4 and 5 individual mice for PBS, VHH–mutIL-2 and BCMA–mutIL-2 groups, respectively.
Fig. 4 |
Fig. 4 |. Lower doses of the CAR-E remain effective. The persisting CAR T cells retain the capacity to re-expand and control tumor growth upon rechallenge.
a, Experimental setup (n = 5 for ‘CAR T cell + CAR-E’ cohort and n = 4 for ‘CAR T cell only with no treatment’ cohort). Surviving mice underwent rechallenge with 1 million OPM2 cells on day 60, followed by the CAR-E treatment on days 68, 70, 74, 77 and 80 at 4 mg kg−1. Naive mice served as rechallenge controls. b, BLI monitored tumor burdens on the indicated days. The same BLI quantification scale was used for all images (photons per second). c, Survival analyses. All the CAR-E-treated mice survived for the duration of the experiment. Statistical analyses were conducted using the log-rank test (P value = 0.0047). d, Quantification of BLI analyses from b. e, Blood collected on the indicated days analyzed for CAR T cell presence in the circulation by flow cytometric analyses showed that CAR-E treatment robustly expanded CAR T cells in the circulation. The CAR-E treatment restarted on day 68 robustly re-expanded CAR T cells in the circulation. Individual data points for each mouse are presented. f, IFNγ levels were quantified using a multiplexed bead-based immunoassay on 1:25 diluted serum samples collected on the same days when CAR T cell counts were assessed as shown in e. g, At the endpoint, CAR T cells in the bone marrow and spleen of mice treated with the CAR-E showed a robust phenotypic diversity. Human CD45+BCMA–CAR+ cells from the bone marrow and spleen of mice were gated and concatenated. FlowSOM analysis was conducted on pooled populations to identify eight major phenotypic metaclusters. A heat map representing the mean fluorescence intensity of each marker within each metacluster was used to qualitatively describe each cluster (Supplementary Fig. 16). The proportion of each metacluster within the bone marrow and spleen of each mouse is depicted. The no treatment ‘CAR T cell only’ cohort did not have enough persisting CAR T cells in the bone marrow or spleen to allow for a similar analysis. The experiments in ag used PBMCs from one donor; sample sizes were n = 4 and 5 individual mice for the CAR T only and CAR T + CAR-E groups, respectively.
Fig. 5 |
Fig. 5 |. The CAR-E expands CAR T cells in the absence of tumor cells in a dose-dependent manner.
a, Experimental setup. Mice received varying doses of the BCMA–mutIL-2 CAR-E treatment (n = 5 for each cohort). b,c, Spleen (b) and bone marrow (c) were isolated 30 days after the injection of CAR T cells and CAR+ cells were counted by flow cytometric analyses. Left: column bars indicating the absolute number of detected CAR T cells. Right: statistical analyses demonstrate that the CAR-E leads to dose-dependent expansion of CAR T cells. The significance between the PBS group and the group of mice receiving the lowest treatment dose (2 mg kg−1) was measured using a two-sided unpaired t-test. Additionally, a linear regression was conducted to demonstrate the dose-dependent effect of the treatment, where error bars represent the mean ± 95% CI. d,e, Persisting CAR T cells consisted of different subsets of memory T cells in the spleen (d) and bone marrow (e). TEM cells, CD45RACD45RO+CCR7; TEMRA cells, CD45RA+CD45RO+CCR7; TSCM cells, CD45RA+CD45RO+CCR7+; TCM cells, CD45RACD45RO+CCR7+; TNaive-like cells, CD45RA+CD45ROCCR7+. In d,e, we used the Shapiro–Wilk test to assess normality. Normal datasets were analyzed using an unpaired two-sided t-test, while non-normal datasets were analyzed using a Mann–Whitney U test. The experiments in ae used PBMCs from one donor, with all conditions having n = 5, where n represents individual mice. f, Both the antigen and the low-affinity IL-2 components of the CAR-E are essential for its impact. Mice received CAR T cells and different treatments (4 mg kg−1) following a schedule similar to that shown in a. The BCMA–CH3 antigen, VHH–mutIL-2 or low-dose wild-type IL-2 treatments could not result in the expansion or persistence of CAR T cells. The experiments in f,g used PBMCs from two donors. A Kruskal–Wallis test was used for each subset of CAR T cells and total T cells. Subsequently, a post hoc Dunn’s analysis was conducted to compare each group with the treatment group. The table below the graph displays the adjusted P values. Error bars represent the mean ± s.e.m. for all box plots.
Fig. 6 |
Fig. 6 |. The CAR-E induces substantial transcriptomic changes in CAR T cells and its efficacy requires signaling through both the CAR and the IL-2R endodomains.
a, The CAR-E induces pSTAT5 activity similarly in CAR T cells and CAR-ICD-Δ T cells. Error bars represent the mean ± s.d. bd, The CAR-E activates CAR T cells but almost completely loses its impact on CAR-ICD-Δ T cells, as evidenced by lower CD69 expression levels (b) and reduced induction of IFNγ (c) and TNFα (d) production. Error bars represent the mean ± s.d. The experiment used PBMCs from one donor. In ad, n = 3 technical replicates for each condition. eg, Dasatinib and ruxolitinib decrease the impact of the CAR-E on CAR T cells, as demonstrated by decreased CD69 expression levels (e) and reduced IFNγ (f) and TNFα (g) production. CAR T cells were treated with varying doses of the CAR-E treatment and the individual inhibitor or their combination, with assessments conducted 24 h later (n = 3 technical replicates for each point). Error bars represent the mean ± s.d. h,i, The CAR-E cannot expand CAR-ICD-Δ T cells in vivo. The experimental setup is shown in h (n = 5 mice per group). Organ analyses 1 month after the injection of cells revealed significant persistence of full CAR T cells, while no CAR-ICD-Δ T cells could be detected (i). The experiment used PBMCs from one donor. Data are presented as the mean ± s.d. and were analyzed by a two-sided unpaired t-test. jn, The CAR-E rapidly induces substantial transcriptomic changes in CAR T cells. CAR T cells underwent a 2-h incubation with the BCMA–mutIL-2 CAR-E or control molecules (10 nM), followed by treatment removal. Subsequently, RNAseq was performed 2 and 24 h later. A volcano plot showing the highest upregulated genes at 4 h when CD8+CAR T cells were treated with the CAR-E (j). A volcano plot showing that the BCMA–mutIL-2 CAR-E has a negligible impact on CD8+ CAR-ICD-Δ T cells (k). P values were obtained using a Wald test (j,k). ln, The top 40 upregulated genes are displayed for the CAR-E treatment for CD8+ CAR T cells (l) and CD4+ CAR T cells (m). The treatment conditions in both CD4 and CD8 CAR T cells, at 2 and 24 h (n). Additional RNAseq analyses are included in Supplementary Fig. 19.

References

    1. Turtle CJ et al. CD19 CAR-T cells of defined CD4+:CD8+ composition in adult B cell ALL patients. J. Clin. Invest 126, 2123–2138 (2016). - PMC - PubMed
    1. Roex G. et al. Safety and clinical efficacy of BCMA CAR-T-cell therapy in multiple myeloma. J. Hematol. Oncol 13, 164 (2020). - PMC - PubMed
    1. Raje N. et al. Anti-BCMA CAR T-cell therapy bb2121 in relapsed or refractory multiple myeloma. N. Engl. J. Med 380, 1726–1737 (2019). - PMC - PubMed
    1. Hartmann J, Schüßler-Lenz M, Bondanza A & Buchholz CJ Clinical development of CAR T cells—challenges and opportunities in translating innovative treatment concepts. EMBO Mol. Med 9, 1183–1197 (2017). - PMC - PubMed
    1. Lindner SE, Johnson SM, Brown CE & Wang LD Chimeric antigen receptor signaling: functional consequences and design implications. Sci. Adv 6, eaaz3223 (2020). - PMC - PubMed

MeSH terms