Clinical Trial
. 2024 Sep;30(9):2657-2666.
doi: 10.1038/s41591-024-03115-2. Epub 2024 Jul 30.

Ustekinumab for type 1 diabetes in adolescents: a multicenter, double-blind, randomized phase 2 trial

Collaborators, Affiliations
Clinical Trial

Ustekinumab for type 1 diabetes in adolescents: a multicenter, double-blind, randomized phase 2 trial

Danijela Tatovic et al. Nat Med. 2024 Sep.

Abstract

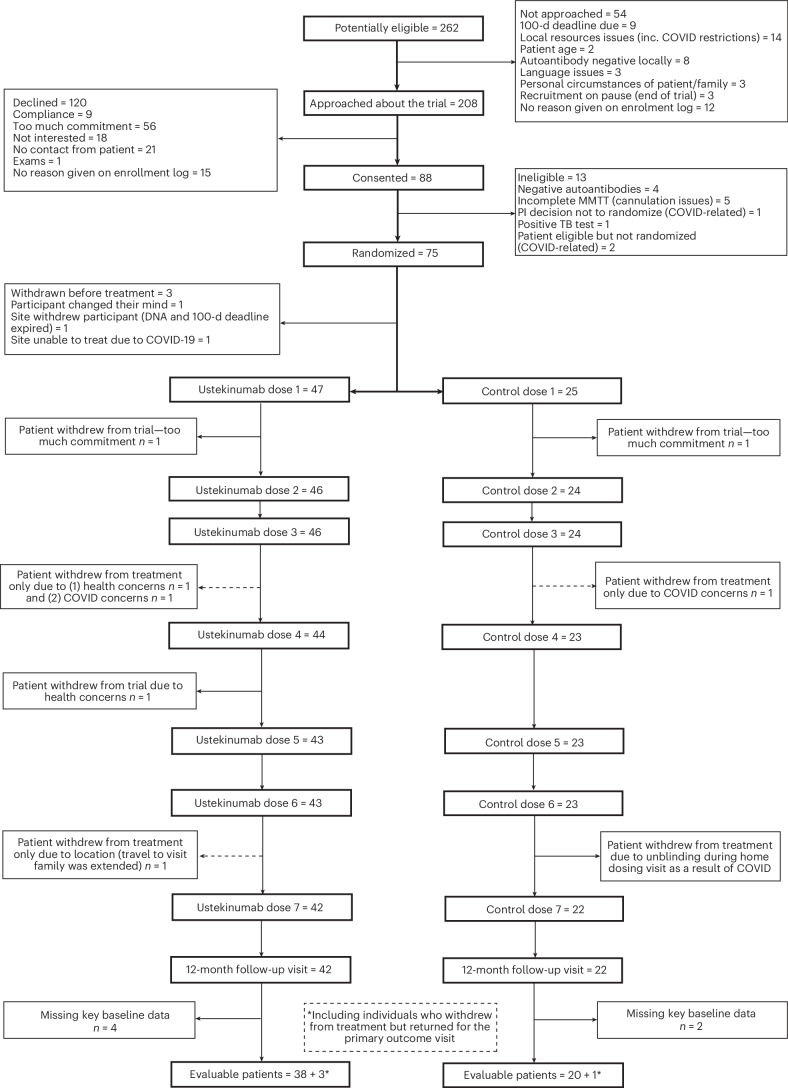
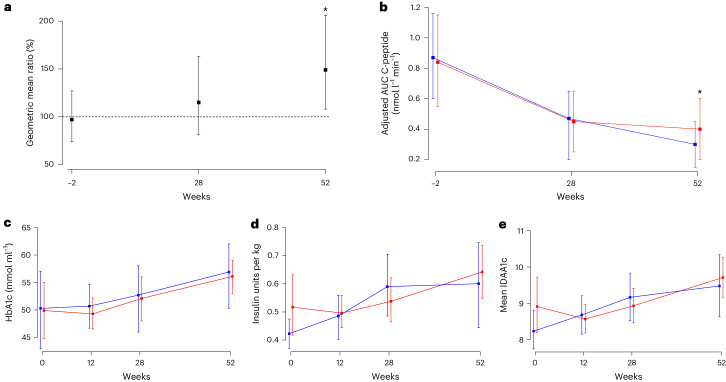
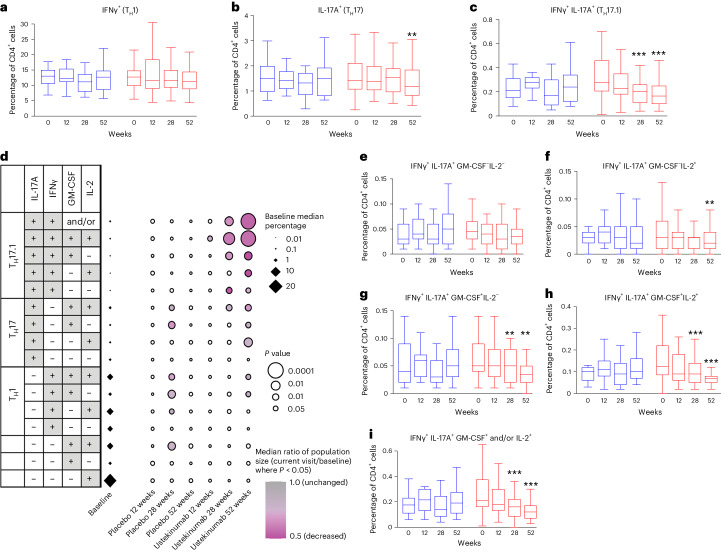
Immunotherapy targeting the autoimmune process in type 1 diabetes (T1D) can delay the loss of β-cells but needs to have minimal adverse effects to be an adjunct to insulin in the management of T1D. Ustekinumab binds to the shared p40 subunit of interleukin (IL)-12 and IL-23, targeting development of T helper 1 cells and T helper 17 cells (TH1 and TH17 cells) implicated in the pathogenesis of T1D. We conducted a double-blind, randomized controlled trial of ustekinumab in 72 adolescents aged 12-18 years with recent-onset T1D. Treatment was well tolerated with no increase in adverse events. At 12 months, β-cell function, measured by stimulated C-peptide, was 49% higher in the intervention group (P = 0.02), meeting the prespecified primary outcome. Preservation of C-peptide correlated with the reduction of T helper cells co-secreting IL-17A and interferon-γ (TH17.1 cells, P = 0.04) and, in particular, with the reduction in a subset of TH17.1 cells co-expressing IL-2 and granulocyte-macrophage colony-stimulating factor (IL-2+ GM-CSF+ TH17.1 cells, P = 0.04). A significant fall in β-cell-targeted (proinsulin-specific) IL-17A-secreting T cells was also seen (P = 0.0003). Although exploratory, our data suggest a role for an activated subset of TH17.1 cells in T1D that can be targeted with minimal adverse effects to reduce C-peptide loss, which requires confirmation in a larger study. (International Standard Randomised Controlled Trial Number Registry: ISRCTN 14274380).


Conflict of interest statement

The authors declare no competing interests.

Figures

Fig. 1
Fig. 1. Consolidated-standards-of-reporting trials diagram showing screening and treatment allocation.
Dashed lines indicate participants who withdrew from dosing but stayed in the trial and were included in the final analysis.
Fig. 2
Fig. 2. Primary and secondary metabolic outcome measures.
a, Geometric ratio (with 95% CI) of intervention (ustekinumab) over control (placebo) over 52 weeks (ustekinumab group, n = 41; placebo group, n = 21). b, Adjusted AUC C-peptide (nmol l−1 min−1) over 52 weeks by treatment group (ustekinumab group, n = 41; placebo group, n = 21). c, HbA1c (mmol mol−1) over 52 weeks by treatment group (ustekinumab group, n = 44; placebo group, n = 20). d, Mean daily exogenous insulin use adjusted by body weight over 52 weeks by treatment group (ustekinumab group, n = 43; placebo group, n = 18). e, IDAA1c over 52 weeks by treatment group (ustekinumab group, n = 43; placebo group, n = 18). Measurements were performed at baseline, week 12 (HbA1c, insulin dose and IDAA1c only), week 28 and week 52. Data for primary outcome are presented as geometric mean ratios with 95% CIs and data for secondary outcomes are presented as arithmetic mean ratios with 95% CIs. One sample per subject was obtained at each study point. Subjects in the ustekinumab group are shown in red and those in the placebo group in blue.
Fig. 3
Fig. 3. Analysis of the frequency of cytokine-producing CD4 T cell subsets in individuals treated with ustekinumab and placebo.
ac, Box plots of frequencies of CD4+ T cells producing IFNγ (a; TH1 cells), IL-17A (b; TH17 cells) and IFNγ and IL-17A (c; TH17.1 cells) (week 28, P = 0.001; week 52, P < 0.0001). d, Dot plot of changes in cytokine-producing CD4 T cell subsets during treatment. The ratio of each population was calculated as current visit/baseline for each participant for every time point for which they had data. Statistical significance was determined using the Kruskal–Wallis rank test and circle size was scaled by the P value, with more significant P values represented by larger circles. Data points with P < 0.05 are colored by the median ratio of population size (gray = 1 (unchanged) to purple = 0.5 (halved)). Data points with P > 0.05 are colored white. The baseline median percentage of each population is represented by scaled black diamonds. ei, Box plots of frequencies of CD4+ T cells in various combinations of cytokines as indicated: IL-17A+IFNγ+GM-CSFIL-2 (e), IL-17+IFNγ+GM-CSFIL-2+ (f) (week 52, P = 0.005), IL-17A+IFNγ+GM-CSF+IL-2 (g) (week 28, P = 0.002; week 52, P = 0.001), IL-17A+IFNγ+GM-CSF+IL-2+ (h) (week 28, P = 0.001; week 52, P < 0.0001) and IL-17A+IFNγ+GM-CSF+ and/or IL-2+ (i) (week 28, P = 0.001; week 52, P < 0.0001). For ac and ei **P < 0.01, ***P < 0.001. The line represents the median, the box the interquartile range (IQR) and the whiskers all data points within 1.5× the IQR of the nearer quartile; outliers are excluded. Forty-four participants in the ustekinumab group and twenty-one in the placebo group are included in the analysis presented in ac. Forty-four participants in the ustekinumab group and nineteen in the placebo group were included in the analysis presented in di. One sample per subject was obtained at each study point. Statistical significance was determined using two-sided Wilcoxon’s matched-pairs, sign-rank test (ac and ei). Ustekinumab was labeled as red and placebo as blue.
Fig. 4
Fig. 4. Box plot of cell producing IL-17A in response to stimulation with proinsulin in individuals treated with ustekinumab and placebo.
a, IFNγ response. b, IL-17A response (week 12, P = 0.0003; week 28, P = 0.006; week 52, P = 0.002). c, IL-17F response (week 52, P = 0.002). SI, mean no. of spots in proinsulin-stimulated well individuals/mean number of spots in unstimulated well individuals. Individuals with a baseline SI < 2 were removed. **P < 0.01, ***P < 0.001. The line represents the median, the box the IQR and the whiskers the 95% range. Nineteen participants in the ustekinumab group and eight in the placebo group were included in the analysis presented in a. Twenty-one participants in the ustekinumab group and eleven in the placebo group were included in the analysis presented in b. FIfteen participants in the ustekinumab group and eight in the placebo group were included in the analysis presented in c. One sample per subject was obtained at each study point. Statistical significance was determined using two-sided Wilcoxon’s matched-pairs, sign-rank test. Ustekinumab was labeled as red and placebo as blue.
Fig. 5
Fig. 5. Relationship between change in immune parameters and primary metabolic outcome.
a, OR (with 95% CI) of having a stable or increasing C-peptide level between weeks 28 and 52. Above the horizontal dashed line is the whole-study group comparing placebo and ustekinumab treated. Below the dashed line it compares those on ustekinumab stratified based on the change in immune subsets (from baseline to week 52) as indicated. The vertical dotted line denotes an OR of 1 (no effect). The square represents the OR points estimate and the lines represent the 95% CI. bd, Box plots of the change in immune population (expressed as the ratio of the frequency at week 52 relative to baseline) stratified by the stability of C-peptide between weeks 28 and 52. The line represents the median, the box the IQR and the whiskers all data points within 1.5× the IQR of the nearer quartile; outliers are excluded. A value of <1 indicates a reduction in the immune population in response to treatment (b) change in TH17.1 cells at week 52 versus baseline (P = 0.03), change in IL-17A+IFNγ+GM-CSF+ and/or IL-2+ at week 52 versus baseline (P = 0.02) (c) and change in IL-17A+IFNγ+GM-CSFIL-2 at week 52 versus baseline (d). *P < 0.05 for odds of having a lower ratio. From the ustekinumab group, 41 participants and, from the placebo group, 21 participants were included in the analysis presented in a. Analysis presented in bd included 34 ustekinumab-treated partcipants. Statistical significance was determined by using logistic regression for the odds of having a stable C-peptide at week 52 adjusted for age. gender, baseline C-peptide and week 28 C-peptide in the analysis presented in bd.
Extended Data Fig. 1
Extended Data Fig. 1. Ustekinumab levels over the study period.
(a) Violin plot of Ustekinumab levels; (b) Connected line plot of Ustekinumab levels. Individual data points shown, shaded area represented interquartile range. Reference line at 0.8 μg/ml.
Extended Data Fig. 2
Extended Data Fig. 2. Dotplot of immune cell populations during treatment, determined by flow cytometry.
Populations were defined as shown in Supplementary Material Fig. 1. Parent population are indicated in parentheses. The ratio of each population was calculated as current visit/baseline for each participant for every timepoint for which they had data. Statistical significance was determined using a two-sided Wilcoxon test and circle size is scaled by p value, with more significant p values represented by larger circles. Data points with p < 0.05 are coloured by the median ratio of population size (grey=1 (unchanged) to purple 0.5 (halved) and green 1.5 (increased by 50%)). Data points with p > 0.05 are coloured white.

References

    1. Tatovic, D. & Dayan, C. M. Replacing insulin with immunotherapy: time for a paradigm change in type 1 diabetes. Diabet. Med.38, e14696 (2021). 10.1111/dme.14696 - DOI - PubMed
    1. Holman, N. et al. National trends in hyperglycemia and diabetic ketoacidosis in children, adolescents, and young adults with type 1 diabetes: a challenge due to age or stage of development, or is new thinking about service provision needed? Diabetes Care46, 1404–1408 (2023). 10.2337/dc23-0180 - DOI - PMC - PubMed
    1. Latres, E. et al. Evidence for C-peptide as a validated surrogate to predict clinical benefits in trials of disease-modifying therapies for type 1 diabetes. Diabetes73, 823–833 (2024). 10.2337/dbi23-0012 - DOI - PubMed
    1. Herold, K. C. et al. An anti-CD3 antibody, teplizumab, in relatives at risk for type 1 diabetes. N. Engl. J. Med.381, 603–613 (2019). 10.1056/NEJMoa1902226 - DOI - PMC - PubMed
    1. Quinn, L. M. et al. What does the licensing of teplizumab mean for diabetes care? Diabetes Obes. Metab.25, 2051–2057 (2023). 10.1111/dom.15071 - DOI - PubMed

Publication types

LinkOut - more resources