. 2024 Jul 30;81(1):323.
doi: 10.1007/s00018-024-05351-8.

The cellular adaptor GULP1 interacts with ATG14 to potentiate autophagy and APP processing

Affiliations

The cellular adaptor GULP1 interacts with ATG14 to potentiate autophagy and APP processing

Dennis Dik-Long Chau et al. Cell Mol Life Sci. .

Abstract

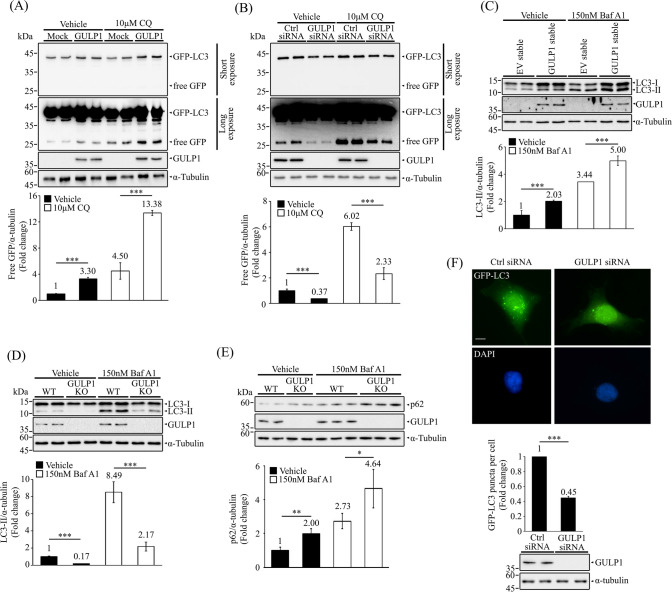
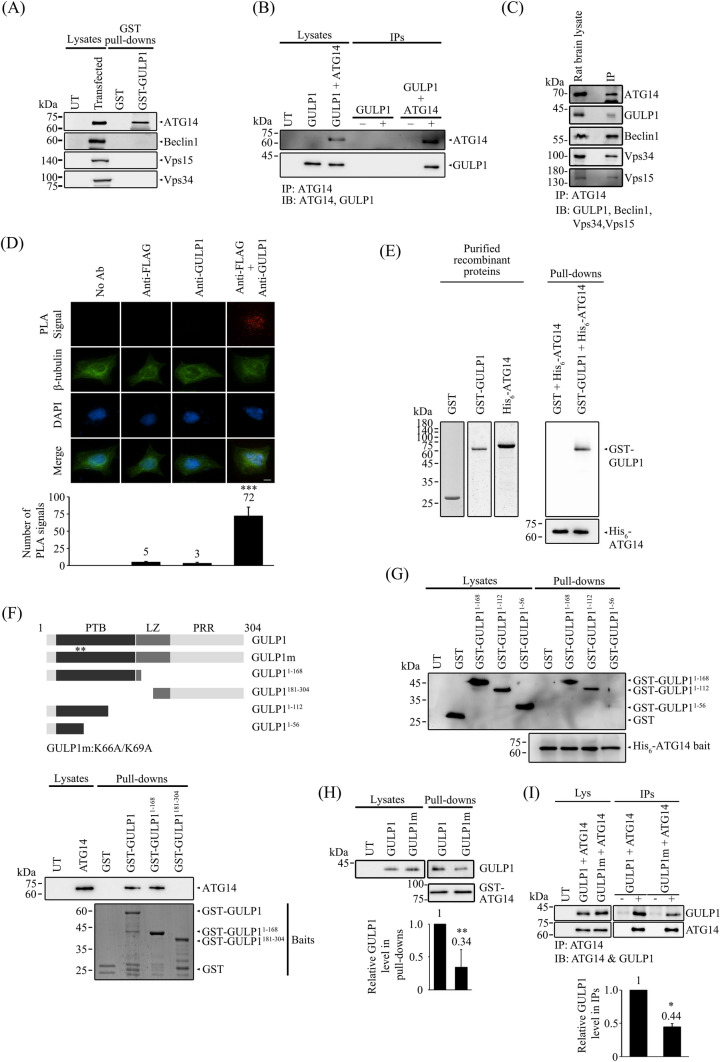
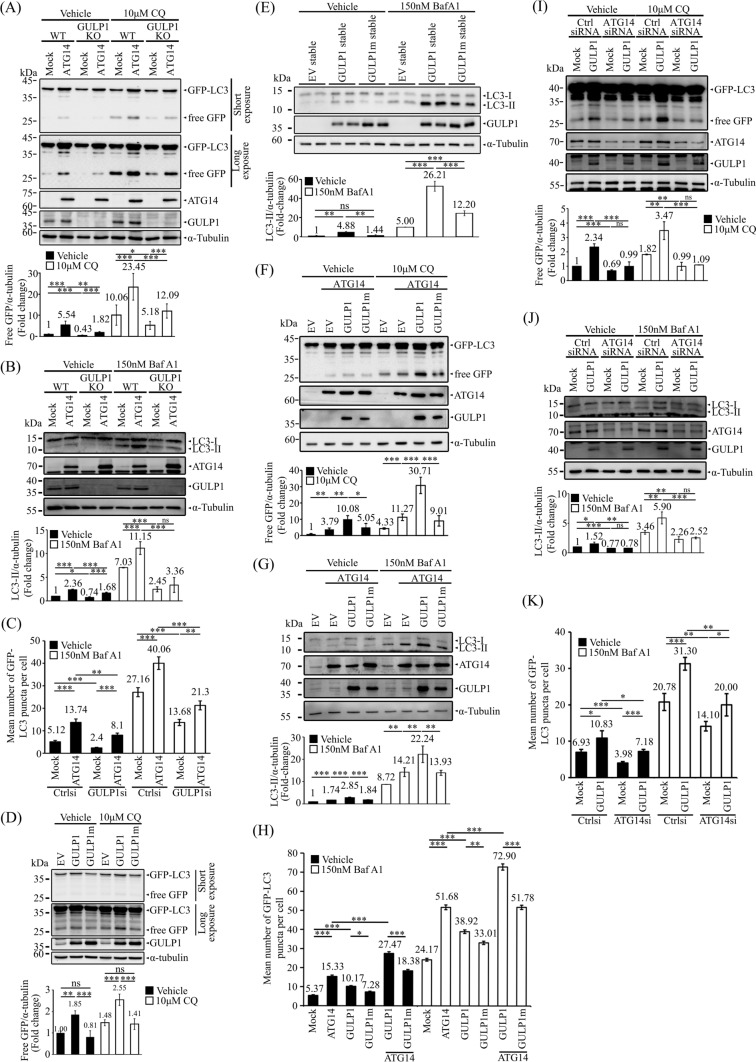
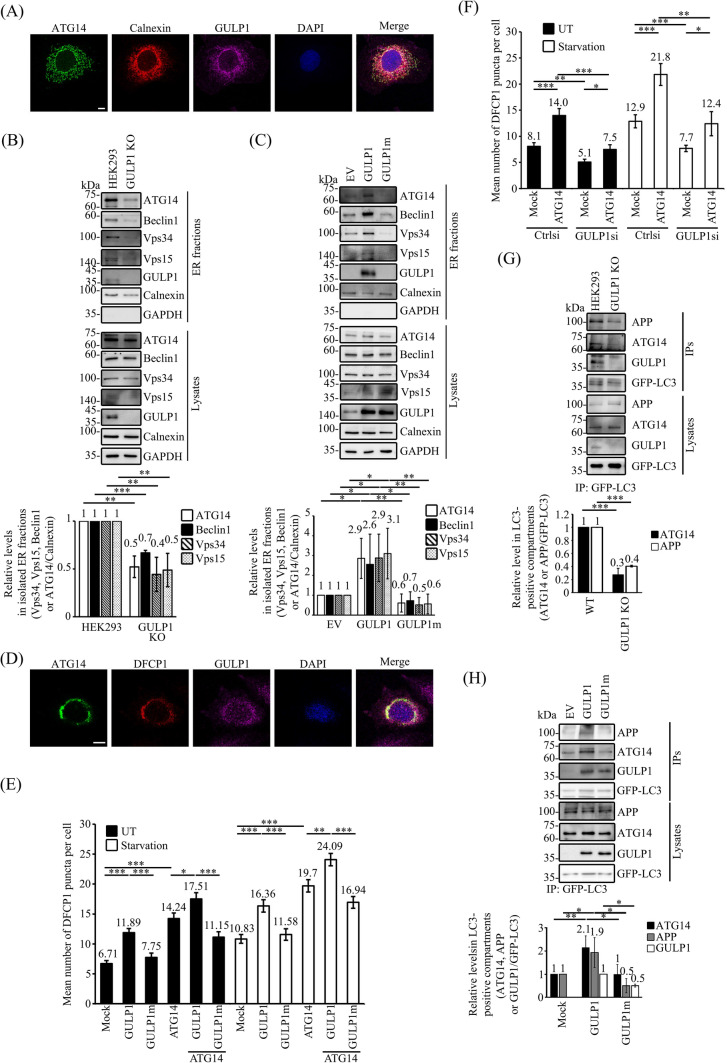
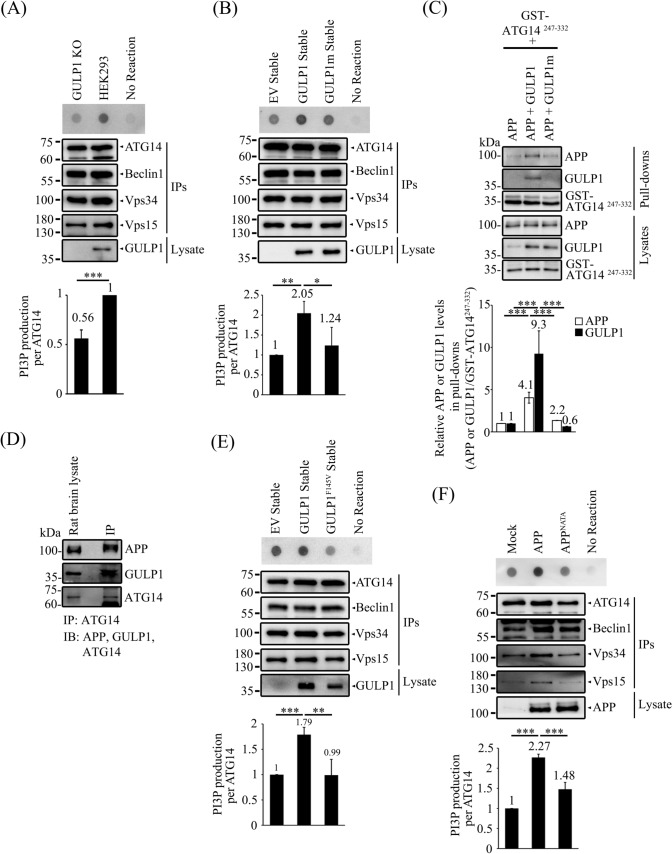
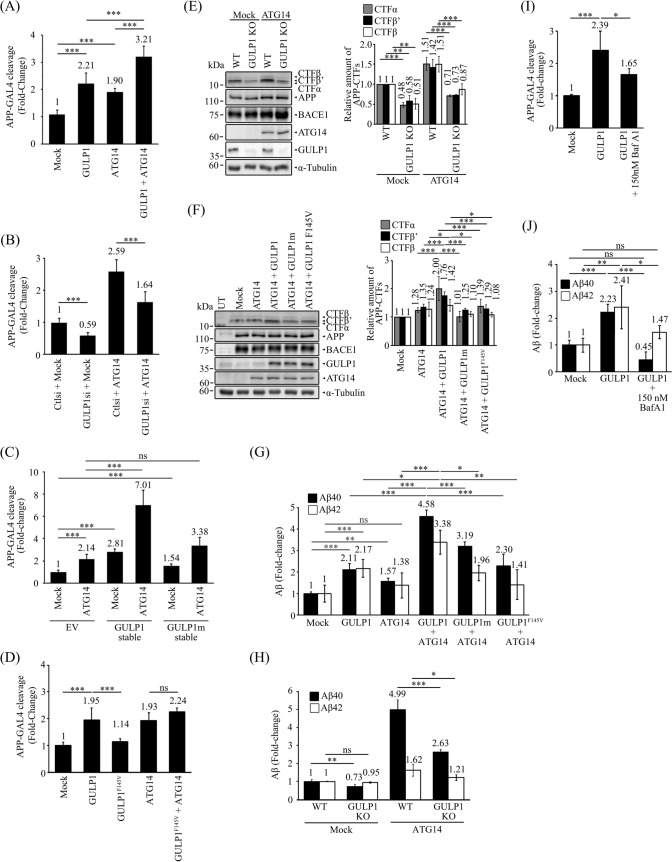
Autophagy is a highly conserved catabolic mechanism by which unnecessary or dysfunctional cellular components are removed. The dysregulation of autophagy has been implicated in various neurodegenerative diseases, including Alzheimer's disease (AD). Understanding the molecular mechanism(s)/molecules that influence autophagy may provide important insights into developing therapeutic strategies against AD and other neurodegenerative disorders. Engulfment adaptor phosphotyrosine-binding domain-containing protein 1 (GULP1) is an adaptor that interacts with amyloid precursor protein (APP) to promote amyloid-β peptide production via an unidentified mechanism. Emerging evidence suggests that GULP1 has a role in autophagy. Here, we show that GULP1 is involved in autophagy through an interaction with autophagy-related 14 (ATG14), which is a regulator of autophagosome formation. GULP1 potentiated the stimulatory effect of ATG14 on autophagy by modulating class III phosphatidylinositol 3-kinase complex 1 (PI3KC3-C1) activity. The effect of GULP1 is attenuated by a GULP1 mutation (GULP1m) that disrupts the GULP1-ATG14 interaction. Conversely, PI3KC3-C1 activity is enhanced in cells expressing APP but not in those expressing an APP mutant that does not bind GULP1, which suggests a role of GULP1-APP in regulating PI3KC3-C1 activity. Notably, GULP1 facilitates the targeting of ATG14 to the endoplasmic reticulum (ER). Moreover, the levels of both ATG14 and APP are elevated in the autophagic vacuoles (AVs) of cells expressing GULP1, but not in those expressing GULP1m. APP processing is markedly enhanced in cells co-expressing GULP1 and ATG14. Hence, GULP1 alters APP processing by promoting the entry of APP into AVs. In summary, we unveil a novel role of GULP1 in enhancing the targeting of ATG14 to the ER to stimulate autophagy and, consequently, APP processing.

Keywords: Amyloid precursor protein; Autophagy-related 14; GULP1; LC3; Macroautophagy.


Conflict of interest statement

The authors declare no competing interests.

Figures

Fig. 1
Fig. 1
GULP1 potentiates autophagic flux. A Representative immunoblots for free GFP in HEK293 cells transfected with GFP-LC3 + mock or GFP-LC3 + GULP1 and treated as indicated. GFP proteins and GULP1 were detected with anti-GFP JL-8 and anti-GULP1 G-R3 respectively. α-tubulin was detected with anti-tubulin DM1A and used as a loading control. Bottom: quantification of relative GFP levels against loading control α-tubulin. Bar chart shows the densitometric quantification of relative GFP levels against α-tubulin. ***p < 0.001. B Immunoblotting of free GFP in GFP-LC3 transfected HEK293 cells with control or GULP1 siRNA KD treated as indicated. GFP proteins and GULP1 were detected with anti-GFP JL-8 and anti-GULP1 G-R3 respectively. α-tubulin was detected with anti-tubulin DM1A and used as a loading control. Bottom: quantification of relative GFP level against loading control α-tubulin. Bar chart shows the densitometric quantification of relative GFP levels against α-tubulin. ***p < 0.001. C Representative immunoblots for LC3 from EV and GULP1 stable transfected HEK293 cell lysates treated as indicated. LC3 and GULP1 were detected with anti-LC3 14600-1-AP and an anti-GULP1 G-R3 respectively. α-tubulin was detected with anti-tubulin DM1A and used as a loading control. Bar chart shows the densitometric quantification of relative LC3-II levels against loading control α-tubulin. ***p < 0.001. D Immunoblotting of LC3 from wild-type and GULP1-KO HEK293 cell lysates treated as indicated. LC3 and GULP1 were detected with anti-LC3 14600-1-AP and anti-GULP1 G-R3 respectively. α-tubulin was detected with anti-tubulin DM1A and used as a loading control. Bar chart shows the densitometric quantification of relative LC3-II levels against loading control α-tubulin. ***p < 0.001. E Immunoblot analysis of p62 in wild-type (WT) and GULP1-KO HEK293 treated as indicated. LC3 and GULP1 were detected with anti-LC3 14600-1-AP and an anti-GULP1 G-R3 respectively. α-tubulin was detected with anti-tubulin DM1A and used as a loading control. Bar chart shows the densitometric of relative p62 levels against α-tubulin. ***p < 0.001. F Top: representative images for GFP-positive puncta in control and GULP1 siRNA transfected HEK293 cells. Nuclei were stained with DAPI. Bar chart shows the quantification of GFP-positive puncta plotted by different siRNA transfection. Right bottom: immunoblot for GULP1 level in total cell lysates after siRNA transfection probed with anti-GULP1 G-R3. Data was obtained from at least 40 cells per transfection, and the experiment was repeated three times. Error bars are SEM. ***p < 0.001. Scale bar, 10 μm
Fig. 2
Fig. 2
GULP1 interacts with ATG14. A Bacterially expressed GST and GST-GULP1 were used as baits for pull-down assay from ATG14, Beclin-1, VPS15 and VPS34 transfected cell lysate respectively. Overexpressed proteins in lysate and pull-downs were analyzed by immunoblotting. B Coimmunoprecipitation was performed from HEK293 cells transfected with ATG14 or ATG14 + GULP1. ATG14 in cell lysate was immunoprecipitated using a mouse anti-FLAG antibody. GULP1 and ATG14 in lysate and immunoprecipitates were analyzed by immunoblotting with anti-GUP1 G-R3 and anti-FLAG 20543-1-AP. C ATG14 in rat brain lysate was immunoprecipitated by an anti-ATG14 antibody. ATG14, GULP1, Beclin1, Vps34 and Vps15 in lysate and immunoprecipitate were immunoblotted with anti-ATG14 PD026, anti-GULP1 G-R3, anti-Beclin1 Bec-R3, anti-Vps34 F-11and anti-Vps15 JK-13. D In a fluorescent PLA assay, PLA signals representing GULP1-ATG14 interaction were detected in GULP1 + ATG14 transfected cells. Representative images are shown. Data were obtained from at least 60 cells per transfection and the experiments were repeated 3 times. Error bars are sem. ***p < 0.001. No-antibody (No Ab), anti-FLAG, and anti-GULP1 control PLAs were performed. E Bacterially expressed His6-ATG14 was used as baits to pull down purified GST or GST-GULP1. GST proteins were probed with a rat anti-GST serum. Left panel shows the purified protein used for pull-down. F Bacterially expressed GST and GST-GULP1 fragments were used as baits for pull-down assay from ATG14 transfected cell lysate. ATG14 in lysate and immunoprecipitates were immunoblotted with anti-ATG14 19,491-1-AP. Bottom panel: Coomassie Blue staining of GST-baits used. G Bacterially expressed His6-ATG14 was used as baits for pull-down assay from GST and GST-GULP1 fragments transfected cell lysate. GST proteins in lysate and immunoprecipitates were analyzed by immunoblotting. Lower panel: Coomassie Blue staining of His6-ATG14 baits. H Cells were co-transfected with GULP1 or GULP1 K66A/K69A (GULP1m). GST-fused ATG14 fragment was used as bait to pull down GULP1 in transfected cell lysates. GST-fusion proteins and GULP1 in lysates and pull-downs were probed with rat anti-GST serum and anti-GULP1 G-R3 respectively. Bar chart shows the densitometric quantification of relative GULP1 levels in pulldowns. **p < 0.01. I Cells were co-transfected with ATG14 + GULP1 or ATG14 + GULP1 K66A/K69A (GULP1m). ATG14 in cell lysate was immunoprecipitated using anti-FLAG M2 antibody. GULP1 and ATG14 in lysate and immunoprecipitates were immunoblotted with rat anti-GULP1 serum and anti-FLAG 20543-1-AP respectively. Bar chart shows the densitometric quantification of relative GULP1 levels in IPs. ***p < 0.001
Fig. 3
Fig. 3
GULP1 potentiates ATG14-mediated autophagy. A Representative immunoblots for free GFP in WT and GULP1-KO HEK293 cells transfected with GFP-LC3 and treated as indicated. GFP fusion proteins, ATG14 and GULP1 were detected with anti-GFP JL-8, a mouse anti-FLAG antibody and anti-GULP1 G-R3 respectively. α-tubulin was detected with anti-tubulin DM1A and used as a loading control. Bottom: quantification of relative GFP levels against loading control α-tubulin. Bottom: densitometric quantification of relative GFP levels against α-tubulin. *p < 0.05, **p < 0.01, ***p < 0.001. B Representative immunoblots for LC3 from WT and GULP1 KO HEK293 cells transfected with ATG14 together with mock or ATG14. GULP1 were detected with anti-LC3 14600-1-AP, a mouse anti-FLAG antibody and an anti-GULP1 G-R3 respectively. α-tubulin was detected with anti-tubulin DM1A and used as a loading control. Bar chart shows the densitometric quantification of relative LC3-II levels against loading control α-tubulin. **p < 0.01, ***p < 0.001. ns not significant. C Quantification of GFP-LC3 puncta plotted by different transfection and treatment as indicated. Data was obtained from at least 40 cells per transfection, and the experiment was repeated three times. Error bars are sem. *p < 0.05, **p < 0.01, ***p < 0.001. D Representative immunoblots for free GFP in HEK293 cells stably transfected with EV, GULP1 and GULP1m and treated as indicated. GFP fusion proteins and GULP1 were detected with anti-GFP JL-8 and anti-GULP1 G-R3 respectively. α-tubulin was detected with anti-tubulin DM1A and used as a loading control. Bottom: quantification of relative GFP levels against loading control α-tubulin. Bottom: densitometric quantification of relative GFP levels against α-tubulin. *p < 0.05, **p < 0.01, ***p < 0.001. E Representative immunoblots for LC3 from EV, GULP1 and GULP1m stably transfected HEK293 cell lysates treated as indicated. LC3 and GULP1 were detected with anti-LC3 14600-1-AP and anti-GULP1 G-R3 respectively. α-tubulin was detected with anti-tubulin DM1A and used as a loading control. Bar chart shows the densitometric quantification of relative LC3-II levels against loading control α-tubulin. **p < 0.01, ***p < 0.001. ns not significant. F Immunoblotting of free GFP in HEK293 cells stably transfected with EV, GULP1 and GULP1m and transiently transfected with ATG14 and treatment as indicated. GFP fusion proteins, ATG14 and GULP1 were detected with anti-GFP JL-8, a mouse anti-FLAG antibody and an anti-GULP1 G-R3 respectively. α-tubulin was detected with anti-tubulin DM1A and used as a loading control. Bottom: quantification of relative GFP levels against loading control α-tubulin. Bottom: densitometric quantification of relative GFP levels against α-tubulin. *p < 0.05, **p < 0.01, ***p < 0.001. G Representative immunoblots for LC3 from HEK293 cells transfected with ATG14 together with EV, GULP1 or GULP1m. LC3, ATG14 and GULP1 were detected with anti-LC3 14600-1-AP, a mouse anti-FLAG antibody and an anti-GULP1 G-R3 respectively. α-tubulin was detected with anti-tubulin DM1A and used as a loading control. Bar chart shows the densitometric quantification of relative LC3-II levels against loading control α-tubulin. **p < 0.01, ***p < 0.001. H Quantification of GFP-LC3 puncta plotted by different transfection and treatment as indicated. Data was obtained from at least 40 cells per transfection, and the experiment was repeated three times. Error bars are sem. *p < 0.05, **p < 0.01, ***p < 0.001. I Representative immunoblots for free GFP in control- and GULP1-KD HEK293 cells transfected with GFP-LC3 together with mock or GULP1, and treated as indicated. GFP fusion proteins, ATG14 and GULP1 were detected with anti-GFP JL-8, a rabbit anti-ATG14 antibody and anti-GULP1 G-R3 respectively. α-tubulin was detected with anti-tubulin DM1A and used as a loading control. Bar chart shows densitometric quantification of relative GFP levels against α-tubulin. **p < 0.01, ***p < 0.001. J Representative immunoblots for LC3 from HEK293 cells transfected with control or ATG14 siRNA together with EV, GULP1 or GULP1m. LC3, ATG14 and GULP1 were detected with anti-LC3 14600-1-AP, a rabbit anti-ATG14 antibody and an anti-GULP1 G-R3 respectively. α-tubulin was detected with anti-tubulin DM1A and used as a loading control. Bar chart shows the densitometric quantification of relative LC3-II levels against loading control α-tubulin. **p < 0.01, ***p < 0.001. K Quantification of GFP-LC3 puncta plotted by different transfection and treatment as indicated. Data was obtained from at least 40 cells per transfection, and the experiment was repeated three times. Error bars are sem. *p < 0.05, **p < 0.01, ***p < 0.001
Fig. 4
Fig. 4
GULP1 facilitates the ER targeting of ATG14 and the recruitment of APP to autophagic vacuoles. A Immunostaining of COS7 cells for ATG14, calnexin and GULP1. ATG14, calnexin and GULP1 were stained by rATG14-2, 10427-2-AP and anti-GULP1 G-R3 respectively. An overlaid image is shown. Nuclei were stained with DAPI. Scale bar, 10 μm. B ER fractions were isolated from WT and GULP1-KO HEK293. Individual PI3KC3-C1 components in the isolated ER fractions were analyzed by immunoblotting by using anti-ATG14 PD026, anti-Beclin1 Bec-R3, anti-Vps34 F-11, anti-Vps15 JK-13 and anti-GULP1 G-R3, respectively. Subcellular compartment markers including calnexin and GAPDH were detected with anti-calnexin 10427-2-AP and anti-GAPDH AM4300 respectively. Data were obtained from three independent experiments. Bar chart shows the relative levels of PI3KC3-C1 components in GULP1-KO HEK293 cells compared to WT HEK293. **p < 0.01, ***p < 0.001. C ER fractions were isolated from EV, GULP1 and GULP1m stably transfected HEK293. Individual PI3KC3-C1 components in the isolated ER fractions were analyzed by immunoblotting by using anti-ATG14 PD026, anti-Beclin1 Bec-R3, anti-Vps34 F-11 and anti-Vps15 JK-13 respectively. Subcellular compartment markers including calnexin and GAPDH were detected with anti-calnexin 10427-2-AP and anti-GAPDH AM4300 respectively. Data were obtained from three independent experiments. Bar chart shows the levels of PI3KC3-C1 components relative to EV. *p < 0.05, **p < 0.01. D Immunostaining of CHO cells transfected with ATG14, mCherry-DFCP1 and GULP1. ATG14 and GULP1 were stained by rATG14-2 and an anti-GULP1 G-R3 respectively. An overlaid image is shown. Nuclei were stained with DAPI. Scale bar, 10 μm. E & F Quantification of mCherry-DFCP1-positive puncta plotted by different transfection and treatment as indicated. Data was obtained from at least 40 cells per transfection, and the experiment was repeated three times. Error bars are sem. *p < 0.05, **p < 0.01, ***p < 0.001. G WT and GULP1-KO HEK293 cells were transfected with GFP-LC3. Autophagic vacuoles were immunoprecipitated with anti-GFP JL-8 antibody. The protein content in total cell lysates and immunoisolated GFP-LC3 positive fractions was analyzed by anti-APP A5137, anti-ATG14 PD026 and anti-GULP1 G-R3. Bar chart shows the densitometric quantification of ATG14 and APP against GFP-LC3 in IPs. The experiment was repeated three times. ***p < 0.001. H Stable EV, GULP1 and GULP1m HEK293 cells were transiently transfected with GFP-LC3. Autophagic vacuoles were immunoprecipitated with anti-GFP JL-8 antibody. The protein content in total cell lysates and immunoisolated GFP-LC3 positive fractions was analyzed by anti-APP A5137, anti-ATG14 PD026 and anti-GULP1 G-R3. Bar chart shows the densitometric quantification of ATG14 and APP against GFP-LC3 in IPs. The experiment was repeated three times. *p < 0.05, **p < 0.01
Fig. 5
Fig. 5
The GULP1-APP interaction enhances PI3KC3-C1 kinase activity. A WT and GULP1-KO HEK293 cells were transfected with ATG14, Beclin1, Vps34 and Vps15 and ATG14 was immunoprecipitated with anti-ATG14 anti-myc antibody 60003-2-IG. The immunoprecipitates were incubated with PI and ATP for 30 min. PI3P production was determined by dot blot and detected with GST-p40-phox. Bar chart shows the quantification of PI3P production normalized with immunoprecipitated ATG14. The experiment was repeated three times. ***p < 0.001. B Stable EV, GULP1 and GULP1m HEK293 cells were transfected with ATG14, Beclin1, Vps34 and Vps15 and ATG14 was immunoprecipitated with an anti-myc antibody 60003-2-IG. The immunoprecipitates were incubated with PI and ATP for 30 min. PI3P production was determined by dot blot and detected with GST-p40-phox. Bar chart shows the quantification of PI3P production normalized with immunoprecipitated ATG14. The experiment was repeated three times. ***p < 0.001. C CHO cells were transfected with GST-ATG14247−332 + APP, GST-ATG14247−332 + APP + GULP1 and GST-ATG14247−332 + APP + GULP1m. GST baits from cell lysates were captured by glutathione resins. Protein levels of APP, GULP1 and GST-ATG14247−332 were analysed with immunoblotting. Bar chart shows the densitometric quantification of co-precipitated APP and GULP1 relative to GST-ATG14247−332 baits. The experiment was repeated three times. ***p < 0.001. D ATG14 was immunoprecipitated with anti-ATG14 PD026 antibody from total rat brain lysate. APP, GULP1 and ATG14 in lysate and immunoprecipitates were analyzed by immunoblotting with anti-APP A5137, anti-GULP1 G-R3 and anti-ATG14 PD026. E Stable EV, GULP1 and GULP1F145V HEK293 cells were transfected with ATG14, Beclin1, Vps34 and Vps15 and ATG14 was immunoprecipitated with anti-myc antibody 60003-2-IG. The immunoprecipitates were incubated with PI and ATP for 30 min. PI3P production was determined by dot blot. Bar chart shows the quantification of PI3P production normalized with immunoprecipitated ATG14. The experiment was repeated three times. ***p < 0.001. F HEK293 cells were transfected with ATG14, Beclin1, Vps34 and Vps15 and ATG14 and mock, APP or APPNATA was immunoprecipitated with anti-myc antibody 60003-2-IG. The immunoprecipitates were incubated with PI and ATP for 30 min. PI3P production was determined by dot blot. Bar chart shows the quantification of PI3P production normalized with immunoprecipitated ATG14. The experiment was repeated three times. ***p < 0.001
Fig. 6
Fig. 6
ATG14 promotes GULP1-mediated APP processing. A, B & D HEK293 cells were transfected with APP-GAL4, GAL4-reponsive firefly luciferase reporter, constitutive Renilla luciferase reporter and indicated expression constructs with either control or GULP1 siRNA. n = 5. Results are means ± SD. ***p < 0.001 compared with mock transfected cells. C HEK293 cell lines with indicated stable expression were transfected with APP-GAL4, GAL4-reponsive firefly luciferase reporter, constitutive Renilla luciferase reporter. n = 5. Results are means ± SD. ***p < 0.001 compared with mock transfected EV cells. ns not significant. Immunoblot analysis of APP CTFs from E wildtype and GULP1 KO HEK293 cells transfected with APP + BACE1 or APP + BACE1 + ATG14 F HEK293 cells transfected with APP + BACE1, APP + BACE1 + ATG14, APP + BACE1 + ATG14 + GULP1, APP + BACE1 + ATG14 + GULP1m or APP + BACE1 + ATG14 + GULP1F145V. The expression of transfected APP, ATG14, BACE1 and GULP1 in (E) and (F) were determined. Full-length APP and APP CTFs were detected by a rabbit anti-APP. HA-GULP1 and BACE1-myc were probed by a mouse anti-HA (12CA5) and a mouse anti-myc (9B11), respectively. The amounts of APP CTF-α, -β and -β’ were quantified. n = 3. **p < 0.01, ***p < 0.001; ns not significant. Results are means ± S.D. G HEK293 cells were cotransfected with APP and indicated expression plasmids. Forty-eight hours post-transfection, cell culture medium was aspirated and changed to fresh medium. The levels of secreted Aβx-40 and Aβx-42 were assayed using an ELISA kit 7 h after the change of medium. n = 5. *p < 0.05, **p < 0.01, ***p < 0.001 compared with mock transfected cells. E Wild-type and GULP1-KO HEK293 cells were cotransfected with APP and indicated expression plasmids. Aβx-40 and Aβx-42 were assayed as described in (H). n = 5. *p < 0.05, **p < 0.01, ***p < 0.001 compared with mock transfected cells. I APP GAL-4 cleavage J Aβ ELISA assays were performed in HEK293 cells transfected with mock, GULP1 and GULP1 treated with 150 nM BafA1 for 24 h. n = 5. *p < 0.05, **p < 0.01, ***p < 0.001. ns not significant

References

    1. Yu WH et al (2005) Macroautophagy–a novel Beta-amyloid peptide-generating pathway activated in Alzheimer’s disease. J Cell Biol 171(1):87–98. 10.1083/jcb.200505082 10.1083/jcb.200505082 - DOI - PMC - PubMed
    1. Zheng L et al (2011) Macroautophagy-generated increase of lysosomal amyloid beta-protein mediates oxidant-induced apoptosis of cultured neuroblastoma cells. Autophagy 7(12):1528–1545 10.4161/auto.7.12.18051 - DOI - PMC - PubMed
    1. Nilsson P et al (2013) Abeta secretion and plaque formation depend on autophagy. Cell Rep 5(1):61–69. 10.1016/j.celrep.2013.08.042 10.1016/j.celrep.2013.08.042 - DOI - PubMed
    1. Caccamo A, Majumder S, Richardson A, Strong R, Oddo S (2010) Molecular interplay between mammalian target of rapamycin (mTOR), amyloid-beta, and Tau: effects on cognitive impairments. J Biol Chem 285(17):13107–13120. 10.1074/jbc.M110.100420 10.1074/jbc.M110.100420 - DOI - PMC - PubMed
    1. Majumder S, Richardson A, Strong R, Oddo S (2011) Inducing autophagy by rapamycin before, but not after, the formation of plaques and tangles ameliorates cognitive deficits. PLoS ONE 6(9):e25416. 10.1371/journal.pone.0025416 10.1371/journal.pone.0025416 - DOI - PMC - PubMed

MeSH terms

Substances

LinkOut - more resources