. 2024 Jul 30;15(7):541.
doi: 10.1038/s41419-024-06933-x.

HMGA1 promotes the progression of esophageal squamous cell carcinoma by elevating TKT-mediated upregulation of pentose phosphate pathway

Affiliations

HMGA1 promotes the progression of esophageal squamous cell carcinoma by elevating TKT-mediated upregulation of pentose phosphate pathway

Meng-Jie Liu et al. Cell Death Dis. .

Abstract

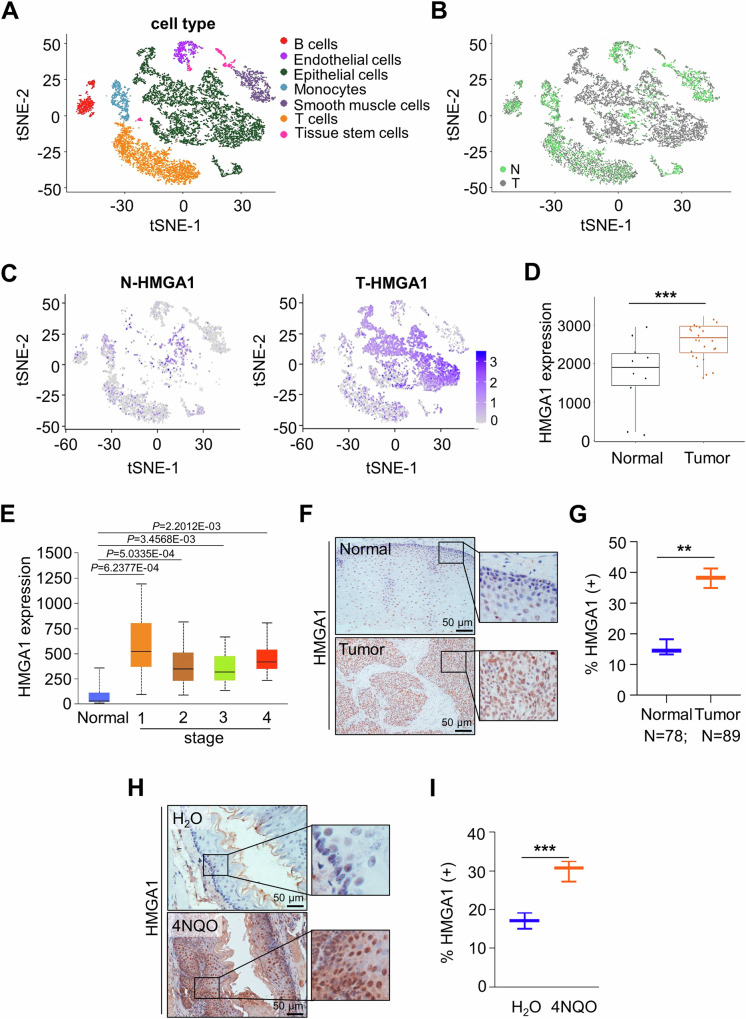
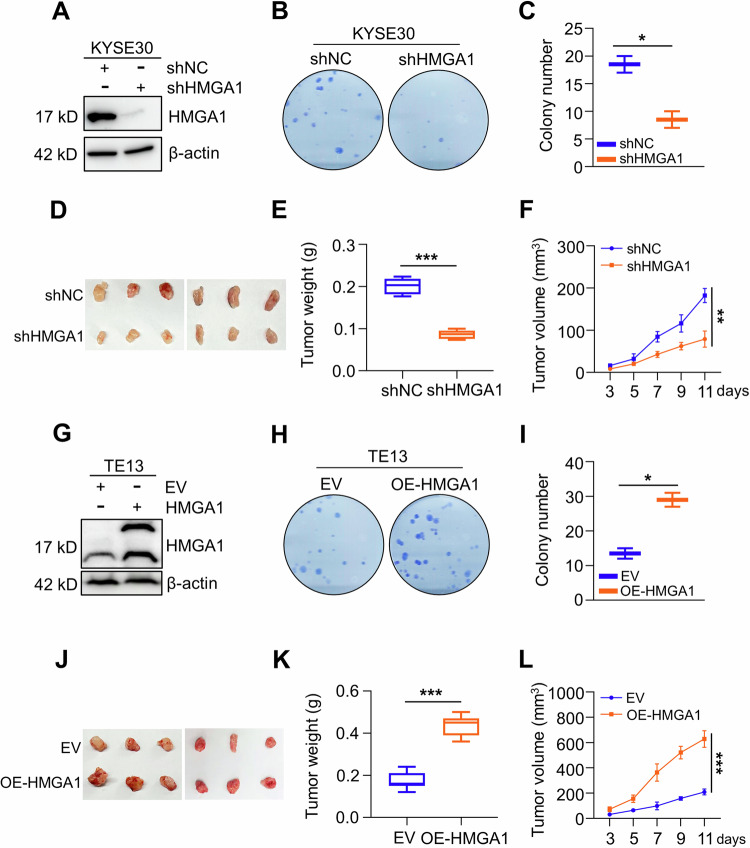
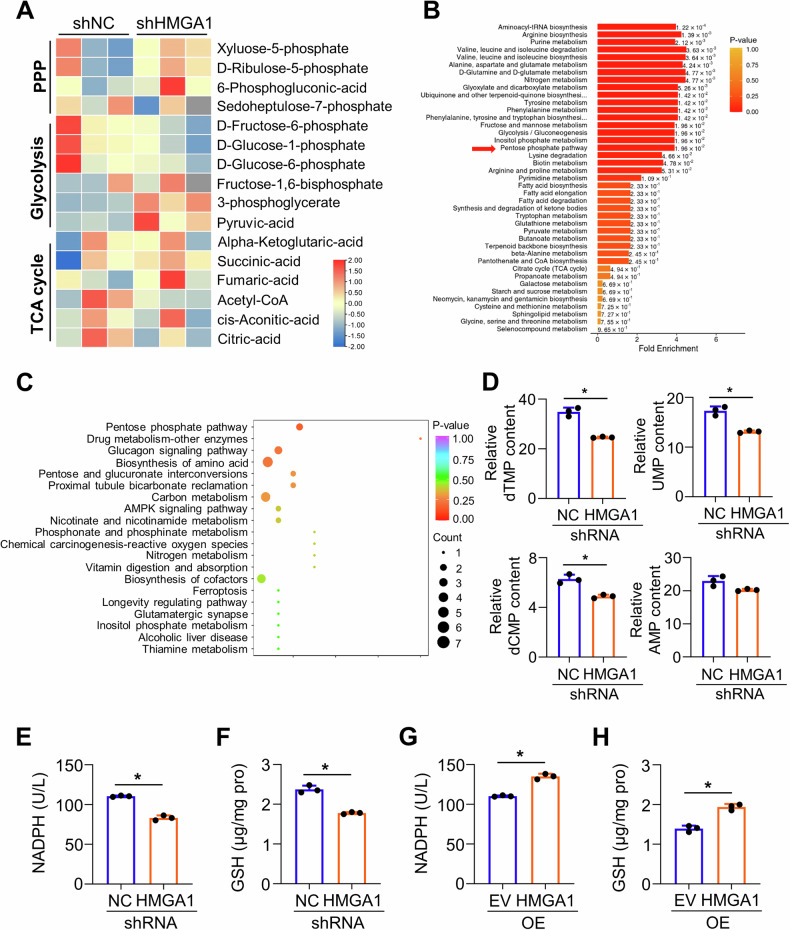
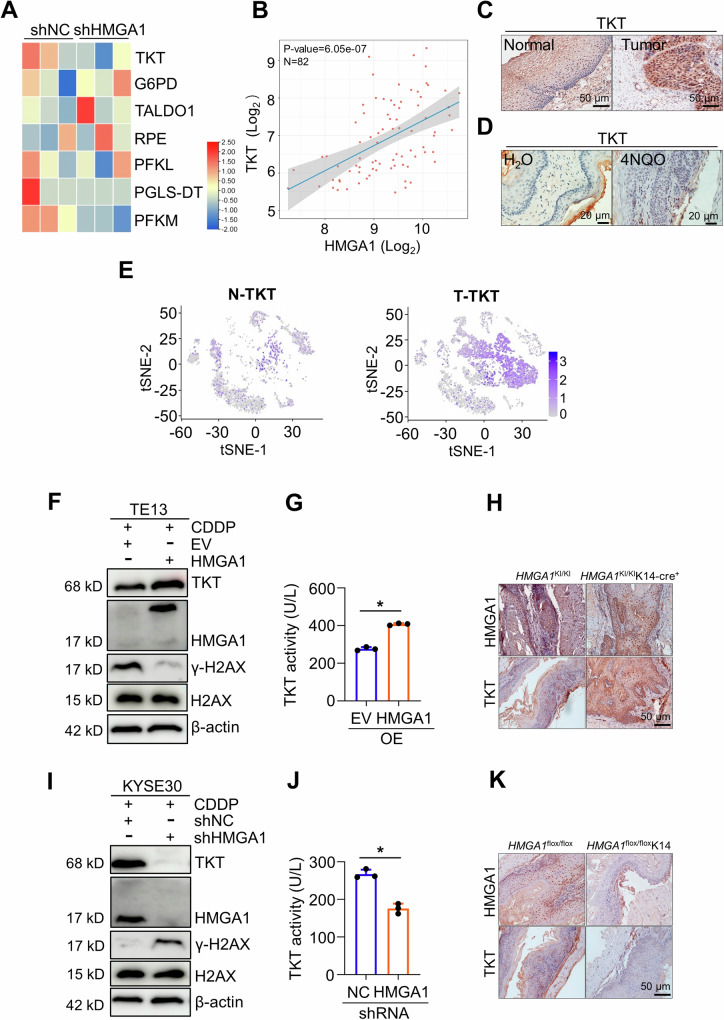
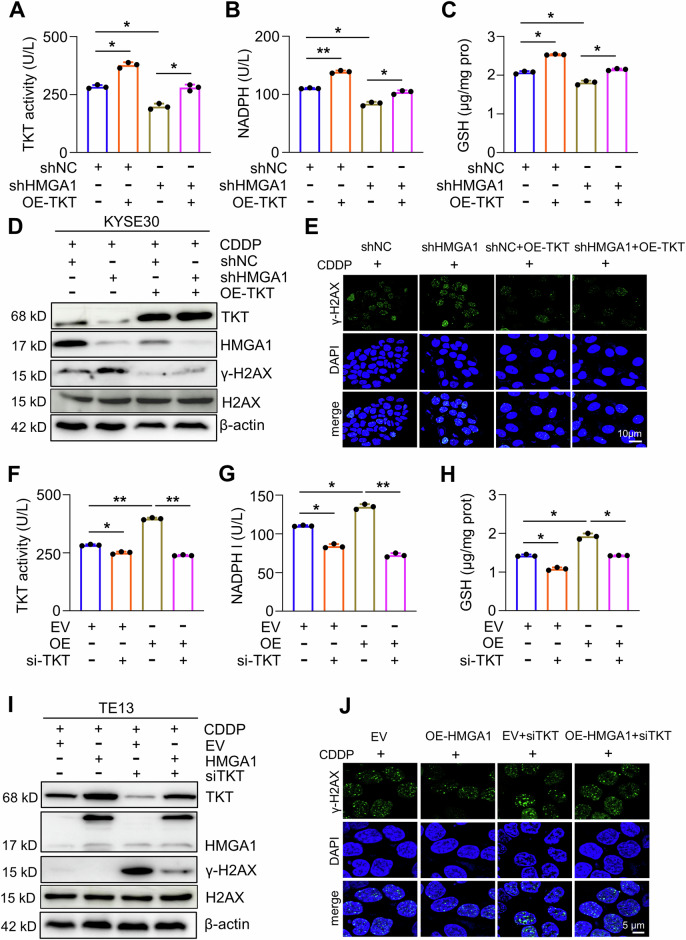
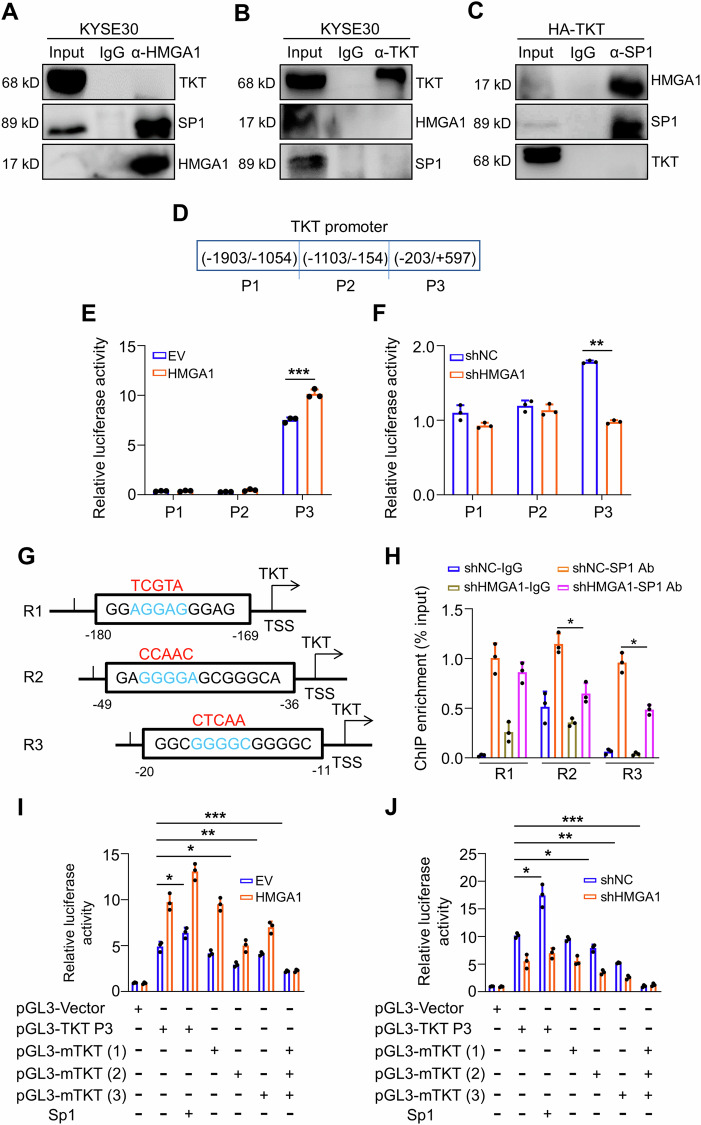
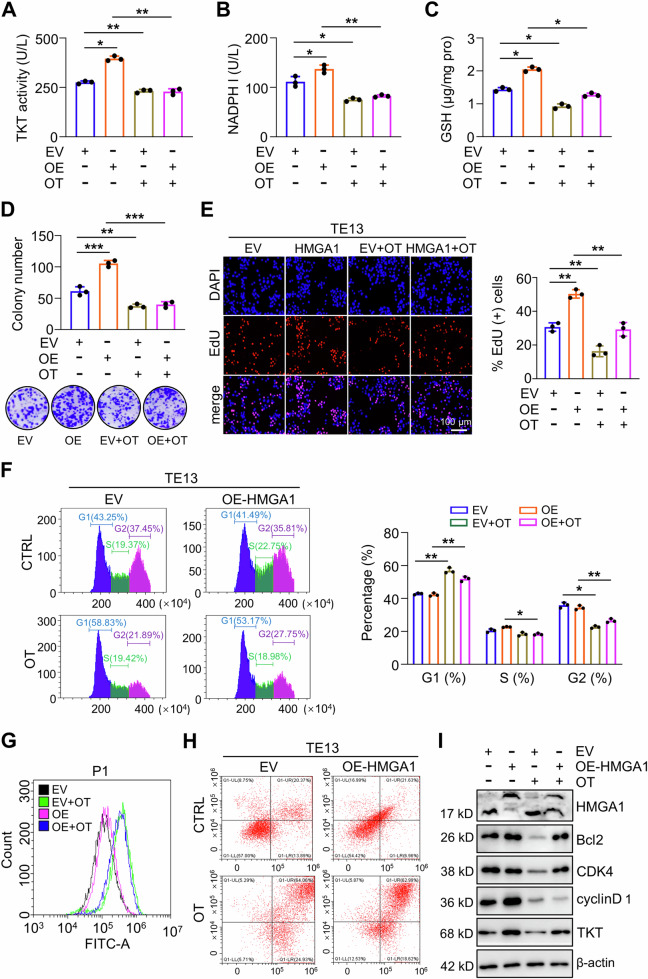
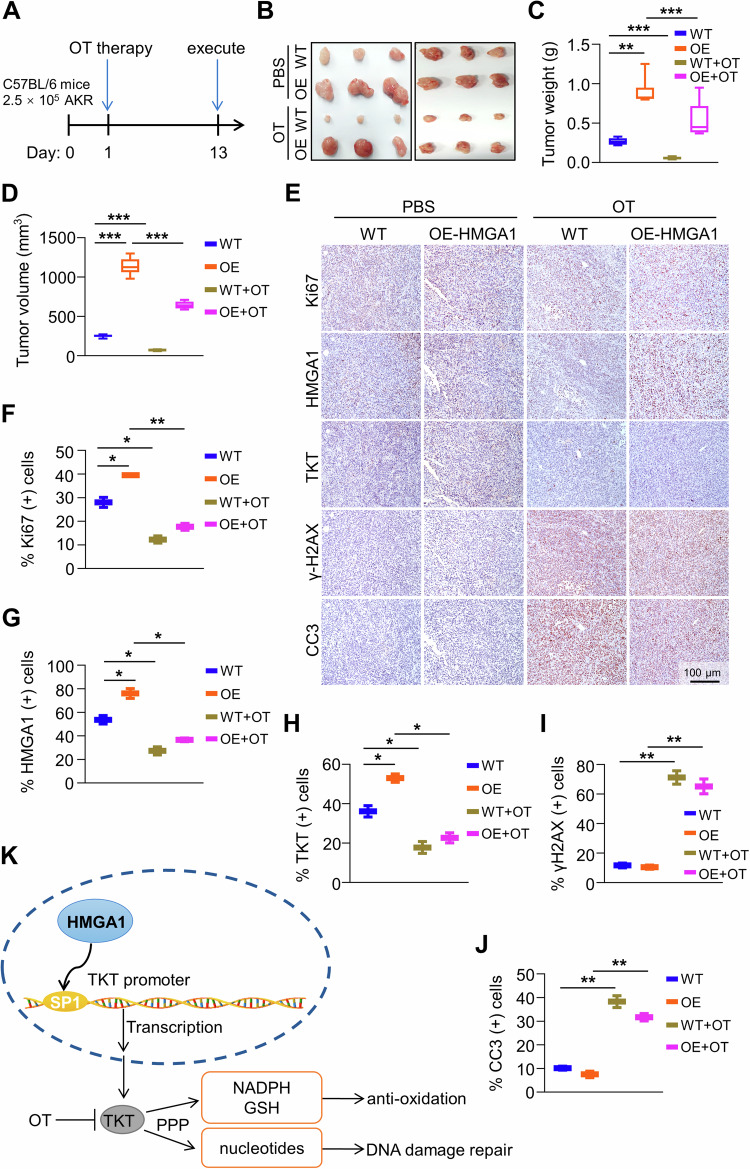
Esophageal squamous cell carcinoma (ESCC) possesses a poor prognosis and treatment outcome. Dysregulated metabolism contributes to unrestricted growth of multiple cancers. However, abnormal metabolism, such as highly activated pentose phosphate pathway (PPP) in the progression of ESCC remains largely unknown. Herein, we report that high-mobility group AT-hook 1 (HMGA1), a structural transcriptional factor involved in chromatin remodeling, promoted the development of ESCC by upregulating the PPP. We found that HMGA1 was highly expressed in ESCC. Elevated HMGA1 promoted the malignant phenotype of ESCC cells. Conditional knockout of HMGA1 markedly reduced 4-nitroquinoline-1-oxide (4NQO)-induced esophageal tumorigenesis in mice. Through the metabolomic analysis and the validation assay, we found that HMGA1 upregulated the non-oxidative PPP. With the transcriptome sequencing, we identified that HMGA1 upregulated the expression of transketolase (TKT), which catalyzes the reversible reaction in non-oxidative PPP to exchange metabolites with glycolytic pathway. HMGA1 knockdown suppressed the PPP by downregulating TKT, resulting in the reduction of nucleotides in ESCC cells. Overexpression of HMGA1 upregulated PPP and promoted the survival of ESCC cells by activating TKT. We further characterized that HMGA1 promoted the transcription of TKT by interacting with and enhancing the binding of transcription factor SP1 to the promoter of TKT. Therapeutics targeting TKT with an inhibitor, oxythiamine, reduced HMGA1-induced ESCC cell proliferation and tumor growth. Together, in this study, we identified a new role of HMGA1 in ESCCs by upregulating TKT-mediated activation of PPP. Our results provided a new insight into the role of HMGA1/TKT/PPP in ESCC tumorigenesis and targeted therapy.


Conflict of interest statement

The authors declare no competing interests.

Figures

Fig. 1
Fig. 1. HMGA1 is highly expressed in esophageal cancer.
AC The tSNE map showed the distribution of epithelial cells from normal (N) and tumor (T) in esophageal tissue in ESCC patients from scRNA-seq data in the GEO database (GSE188900 dataset). HMGA1 was mainly expressed in epithelial cells from tumor (C). D HMGA1 expression in ESCC (n = 28) and paired paracancerous (n = 10) samples in the GEO database (GSE45670 dataset). E The TCGA database analyzes the expression of HMGA1 at normal and tumor tissues of different stages of ESCCs. F, G Representative IHC staining of HMGA1 in paired ESCC tissues. Scale bars: 50 μm. H, I Representative IHC staining of HMGA1 in 4NQO-induced esophageal tumor tissue and H2O-treated normal esophageal tissue. Scale bars: 50 μm.
Fig. 2
Fig. 2. Elevated HMGA1 promotes malignant phenotype of ESCC cells.
AC HMGA1 knockdown inhibits the proliferation of ESCC cells. HMGA1 was knocked down in KYSE30 cells. Western blot was performed to detect the efficiency of the knockdown (A). Cell proliferation of the control and shHMGA1 cells was detected by colony formation assay (B). Colonies in (B) were calculated and shown in (C), n = 3. DF Subcutaneous syngeneic tumors generated from HMGA1-knocked down mouse esophageal cancer AKR cells, n = 6. D Tumors, E Tumor weight, F Tumor volume. Tumor length (L) and width (W) were measured using vernier calipers every other day from day 3 after transplantation. The tumor volume was calculated using the formula (L × W2)/2 and presented as mean ± SEM. GI HMGA1 overexpression promotes the proliferation of ESCC cells. A stabe cell line with HMGA1 overexpression was established in TE13 cells. Western blot was performed to detect the efficiency of the enforced expression (G). Cell proliferation of the control and HMGA1 overexpression cells was detected by colony formation assay (H). Colonies in (H) were calculated and shown in (I), n = 3. JL Tumors and their weight and volume of subcutaneous syngeneic tumors generated from HMGA1-overexpressed mouse esophageal cancer AKR cells. Tumor establishment and measurement were performed as described in (DF), n = 6. *P < 0.05, **P < 0.01, and ***P < 0.001.
Fig. 3
Fig. 3. HMGA1 upregulates pentose phosphate pathway.
AD Targeted metabolomics was performed using Shimadzu LC Nexera X2 UHPLC coupled with a QTRAP 5500 LC MS/MS (AB Sciex). Chromatographic separation was performed with ACQUITY UPLC UPLC BEH Amide analytic column (Metware, Wuhan, China). A Heatmap of metabolites in glycolysis, PPP, TCA cycle from KYSE30-ctrl and KYSE30-shHMGA1 cells in the targeted metabolomics analysis. B Enrichment analysis of metabolites in KYSE30-ctrl and KYSE30-shHMGA1 cells. C The bubble plot of metabolite enrichment pathway. D Relative levels of nucleotide in KYSE30-ctrl and KYSE30-shHMGA1 cells in the targeted metabolomics analysis (n = 3). E, F Relative levels of NADPH (E) and GSH (F) in KYSE30 cells with HMGA1 knockdown. G, H Relative levels of NADPH (G) and GSH (H) in TE13 cells with HMGA1 overexpression. *P < 0.05, n = 3.
Fig. 4
Fig. 4. HMGA1 upregulates TKT expression.
A RNA-seq was performed in control and HMGA1-silenced KYSE30 cells. Heatmap of partially differentially expressed genes in cell metabolism in HMGA1-silenced cells versus control cells. B Correlation analysis between the HMGA1 and TKT expression in ESCCs using online TCGA database. C Representative IHC staining of TKT in paired ESCC tissues (Scale bars: 50 μm). D Representative IHC staining of TKT in 4NQO-induced esophageal tumor tissue (Scale bars: 20 μm). E The tSNE map showed expression of TKT in ESCC tumor tissues from scRNA-seq database (GSE188900 dataset). F, G A stable cell line with HMGA1 overexpression was established in TE13 cells. Western blot (F) was performed to detect the expression of TKT and γ-H2AX in HMGA1-overexpressed TE13 cells exposing to CDDP (10 μM) for 16 h. The enzymatic activity (G) of TKT was measured in HMGA1-overexpressed TE13 cells. H TKT in esophageal cancers induced by 4NQO in HMGA1KI/KI (control) and HMGA1KI/KIK14-cre+ mice. HMGA1 gene knock-in (HMGA1KI/KIK14-cre+) and its control (HMGA1KI/KI) mice were treated with 80 mg/L 4NQO in drinking water for 5 months for the induction of esophageal cancer (n = 6). Representative images of esophageal sections stained with HMGA1 and TKT antibody are shown. Scale bars, 50 μm. I, J A stable cell line with HMGA1-knocked down was established in KYSE30 cells. Western blot (I) was performed to detect the expression of TKT and γ-H2AX in HMGA1-knocked down KYSE30 cells exposed to CDDP (10 μM) for 16 h. The enzymatic activity (J) of TKT was measured in HMGA1-knocked down KYSE30 cells. K TKT in esophageal cancers induced by 4NQO in HMGA1flox/flox and HMGA1flox/floxK14 mice. Conditional HMGA1 gene knock-out in esophagus (HMGA1flox/floxK14) and its control (HMGA1flox/flox) mice were treated with 80 mg/L 4NQO in drinking water for 5 months for the induction of esophageal cancer (n = 6). Representative images of esophageal sections stained with HMGA1 and TKT antibody are shown. Scale bars, 50 μm. Student’s t test was used for the statistical analysis. *P < 0.05, n = 3.
Fig. 5
Fig. 5. TKT mediates HMGA1-upregulated PPP.
AC Control and HMGA1-knocked down KYSE30 cells were transfected with Flag-tagged TKT. TKT enzyme activity (A), NADPH (B), and GSH (C) were determined in cells. D, E Enforced expression of TKT ameliorates HMGA1 depletion-induced DNA damage. Control and HMGA1-knocked down KYSE30 cells were transfected with pcDNA3.1/TKT for 24 h. Cells were then treated with 10 μm CDDP for another 16 h. After the treatment, cells were collected for determining the expression of γ-H2AX (Ser139), HMGA1, and TKT by western blotting (D) or subjected to the immunofluorescence staining for detecting the expression of γ-H2AX (Ser139) (E). Scale bar, 10 μm. FH Control and HMGA1-overexpressed TE13 cells were transfected with TKT siRNA and detected for TKT enzyme activity (F), NADPH (G), and GSH (H). I, J Depletion of TKT reverses HMGA1-alleviated DNA damage. Control and HMGA1-overexpressed TE13 cells were transfected with TKT siRNA for 24 h. Cells were then treated with 10 μm CDDP for another 16 h. After the treatment, cells were used for determining the expression of γ-H2AX (Ser139), HMGA1, and TKT by western blotting (I) or fixed for the immunofluorescence detection of γ-H2AX (Ser139) (J). Scale bar, 5 μm.
Fig. 6
Fig. 6. HMGA1 promotes the transcription of TKT by interacting with SP1.
A Co-immunoprecipitation (co-IP) assay was used for the detection of interactions among endogenous HMGA1, TKT, and SP1 in KYSE30 cells. Antibody against HMGA1 was used for the pulldown. B No direct interaction exerts between TKT and HMGA1 or Sp1. A specific antibody against TKT was used for immunoprecipitating TKT and its complex from TKT-overexpressed KYSE30 cells. TKT, HMGA1, and SP1 were detected in the pulled-down complex. C Sp1 coimmunoprecipitates with HMGA1, but not TKT. A specific antibody against Sp1 was used for immunoprecipitating Sp1 and its complex from TKT-overexpressed KYSE30 cells. SP1, HMGA1, and TKT were detected in the pulled-down complex. D Schematic of the truncated TKT promoter sequences. E Transcriptional activity of truncated TKT promoter fragments was measured by luciferase reporter assays in 293T cells stably transfected with HMGA1 overexpression plasmid. F Transcriptional activity of truncated TKT promoter fragments was measured by luciferase reporter assays in KYSE30 cells stably transfected with HMGA1 shRNA plasmids. G The potential AT-hook sequences for HMGA1 and/or Sp1 binding were mutated as indicated. H ChIP assays were performed to study the binding of Sp1 to the TKT promoter region (−187/−54, −173/−25, −27/100) in KYSE30 cells with or without HMGA1 knockdown. I, J Transcriptional activity of the wild-type or mutated TKT promoter sequences was measured by luciferase reporter assays in 293T cells (I) and KYSE30 cells (J) with HMGA1 manipulations. Student’s t test was used for the statistical analysis. *P < 0.05, **P < 0.01, and ***P < 0.001, n = 3.
Fig. 7
Fig. 7. Inhibition of TKT suppresses the oncogenic activity of HMGA1.
AE Control and HMGA1-overexpressed TE13 cells were treated with OT (5 mM) for 24 h. A TKT enzyme activity; B NADPH; C GSH; D Colony formation of the cells was determined. E Cell proliferation was evaluated by EdU incorporation assay in the cells. Scale bar: 100 μm. F Flow cytometry was performed to analyze cell cycle distribution of TE13 cells with or without HMGA1 overexpression cultured in the presence or absence of 5 mM OT for 24 h (n = 3). G ROS level was measured in TE13 cells with or without HMGA1 overexpression treated with 5 mM OT for 8 h. ROS were determined by DCF staining and analyzed with an ROS Assay Kit from Beyotime Biotechnology. H Flow cytometry was performed to analyze cell apoptosis of TE13 cells treated with or without 10 mM OT for 72 h (n = 3). I Western blot analyses were performed for the detection of cell cycle and apoptotic proteins in OT-treated TE13 cells with or without HMGA1 overexpression.
Fig. 8
Fig. 8. Suppression of TKT abrogates HMGA1-induced ESCC tumor growth.
AKR-WT and AKR-HMGA1 overexpression cells (2.5 × 10⁵/mouse) were injected into flanks of C57BL/6 mice by s.c. The second day after seeding the cells, TKT inhibitor OT (300 mg/kg/day) was applied to the mice by gavage. Tumor volumes were monitored for 13 d. A Timeline for the establishment of the syngeneic mouse model and the treatment of OT. B Representative images of tumors formed in C57BL/6 mice (n = 6). C Tumor weights, and D tumor volume in mice treated with or without OT. EJ Immunohistochemical staining and quantitation of paraffin-embedded tissue sections for HMGA1, TKT, cleaved-caspase 3, γ-H2AX, and Ki-67 in tumors from mice treated with or without OT (n = 6). Scale bar, 100 μm. Data are presented as the means ± S.D., and significant differences are indicated as *P < 0.05, **P < 0.01, and ***P < 0.001. K Schematic diagram depicting that HMGA1 promotes ESCC progression by elevating TKT-mediated upregulation of PPP.

Similar articles

Cited by

References

    1. Watanabe M, Otake R, Kozuki R, Toihata T, Takahashi K, Okamura A, et al. Recent progress in multidisciplinary treatment for patients with esophageal cancer. Surg Today. 2020;50:12–20. 10.1007/s00595-019-01878-7 - DOI - PMC - PubMed
    1. Yang T, Hui R, Nouws J, Sauler M, Zeng T, Wu Q. Untargeted metabolomics analysis of esophageal squamous cell cancer progression. J Transl Med. 2022;20:127. 10.1186/s12967-022-03311-z - DOI - PMC - PubMed
    1. Li B, Hong P, Zheng CC, Dai W, Chen WY, Yang QS, et al. Identification of miR-29c and its target FBXO31 as a key regulatory mechanism in esophageal cancer chemoresistance: functional validation and clinical significance. Theranostics. 2019;9:1599–613. 10.7150/thno.30372 - DOI - PMC - PubMed
    1. Song Y, Li L, Ou Y, Gao Z, Li E, Li X, et al. Identification of genomic alterations in oesophageal squamous cell cancer. Nature. 2014;509:91–5. 10.1038/nature13176 - DOI - PubMed
    1. Martínez-Reyes I, Chandel NS. Cancer metabolism: looking forward. Nat Rev Cancer. 2021;21:669–80. 10.1038/s41568-021-00378-6 - DOI - PubMed

MeSH terms