. 2024 Jul 30;15(1):6400.
doi: 10.1038/s41467-024-50763-6.

A gate tunable transmon qubit in planar Ge

Affiliations

A gate tunable transmon qubit in planar Ge

Oliver Sagi et al. Nat Commun. .

Erratum in

  • Author Correction: A gate tunable transmon qubit in planar Ge.
    Sagi O, Crippa A, Valentini M, Janik M, Baghumyan L, Fabris G, Kapoor L, Hassani F, Fink J, Calcaterra S, Chrastina D, Isella G, Katsaros G. Sagi O, et al. Nat Commun. 2024 Oct 31;15(1):9426. doi: 10.1038/s41467-024-53910-1. Nat Commun. 2024. PMID: 39482315 Free PMC article. No abstract available.

Abstract

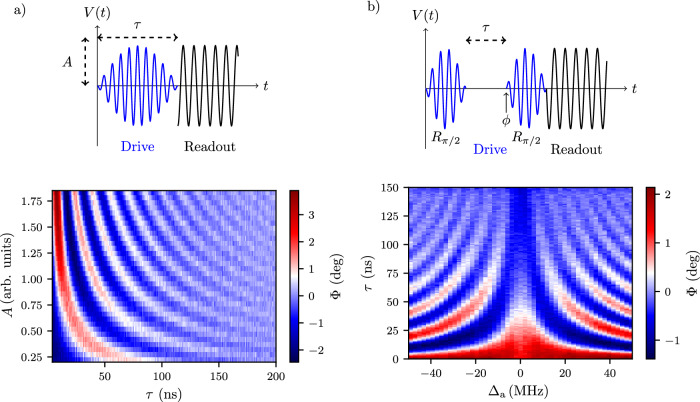
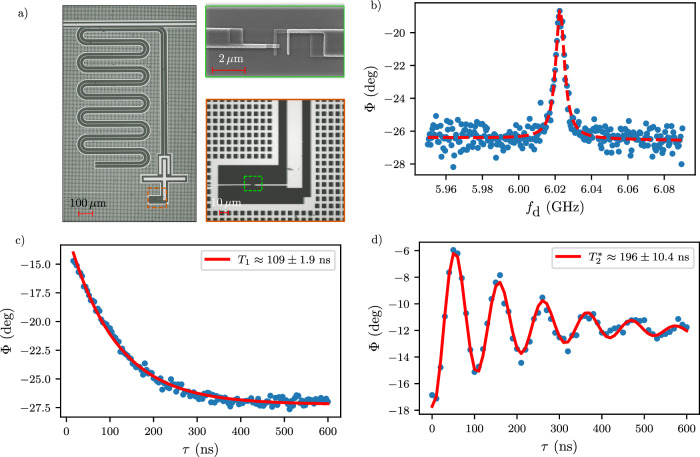
Gate-tunable transmons (gatemons) employing semiconductor Josephson junctions have recently emerged as building blocks for hybrid quantum circuits. In this study, we present a gatemon fabricated in planar Germanium. We induce superconductivity in a two-dimensional hole gas by evaporating aluminum atop a thin spacer, which separates the superconductor from the Ge quantum well. The Josephson junction is then integrated into an Xmon circuit and capacitively coupled to a transmission line resonator. We showcase the qubit tunability in a broad frequency range with resonator and two-tone spectroscopy. Time-domain characterizations reveal energy relaxation and coherence times up to 75 ns. Our results, combined with the recent advances in the spin qubit field, pave the way towards novel hybrid and protected qubits in a group IV, CMOS-compatible material.


Conflict of interest statement

The authors declare no competing interests.

Figures

Fig. 1
Fig. 1. Overview of the complete Ge gatemon device and resonator spectroscopy measured with a Vector Network Analyzer.
a Optical microscope image showcasing the entire device. A λ/4 notch-type coplanar waveguide resonator (yellow) is capacitively coupled to the cross-shaped qubit island (red) alongside a transmission line (purple) utilized for readout. The island is shunted to the ground through a gate-tunable semiconductor Josephson junction. b Close-up view of the U-shaped mesa (highlighted in light green). c False-colored SEM image of the junction, depicting the junction where the evaporated aluminum (blue) extends over the mesa (light green) to proximitize the whole mesa. The gate line (orange) is intentionally extended on the right side to increase capacitance to the ground. d Cross-section of the wafer stack along the red-dashed line in Fig. 1c. e Gate-dependence of the normalized transmission through the feedline after background correction. The process of background correction is outlined in Supplementary Fig. 8 in the Supplementary Information. f Close-up view of the avoided crossing after background correction and boxcar averaging with a window size of 8 points. The dashed green line represents the bare resonator frequency, while the red dashed line indicates the qubit frequency extracted from the two peaks according to Eq. (2).
Fig. 2
Fig. 2. Pulsed qubit spectroscopy.
a, b Two-tone spectroscopy data after subtracting the average of each column and normalizing the trace. In (a, b), the qubit frequency is set above (below) the resonator frequency. We measure the transmitted signal phase after a 2 μs excitation. In (b), we observe the 12 due to a residual excited state population. The insets show a linecut at Vgate = 171 mV and Vgate = 533 mV, respectively, along the blue dashed lines. The x and y axes correspond to fdrive and phase (Φ), respectively. c Extracted qubit frequency from (a, b). We fit each trace with a Lorentzian (a pair of Lorentzian in the case of (b), and the center yields the qubit frequency. d Extracted anharmonicity from three-tone spectroscopy as explained in the main text. The anharmonicity is reduced compared to  − Ec, indicating a non-sinusoidal current-phase relation.
Fig. 3
Fig. 3. Coherent control of the gatemon.
a Rabi oscillations at fqubit ≈ 3.66 GHz. We apply a cosine-shaped drive pulse directly on the gate line, followed by a readout pulse on the resonator line. b Ramsey fringes with virtual Z gates. We rotate the frame of reference to mimic an extra rotation. The detuning defines the angle of rotation: ϕ = Δa ⋅ τ. In both (a, b), the measured response averaged over 50000 traces, and the average of each column was subtracted to account for the slow drift of the readout resonator.
Fig. 4
Fig. 4. Relaxation and coherence time measurements.
Measurements depicted in panels (a, b) were performed at different readout frequencies. a T1 measurement at fqubit ≈ 2.8 GHz. A 10 ns π pulse brings the qubit to the excited state, followed by a certain waiting time and the readout pulse. The solid red line is a fit to the exponential curve. b T2* measurement at fqubit ≈ 2.8 GHz. The pulse sequence is identical to the one in Fig. 3b. The solid curve fits a damped sinusoidal curve on a linear background. c Relaxation time measurements as a function of qubit frequency. The error bars represent the standard deviations of the fit depicted above. The dashed line indicates a fit to the function shown in the legend. We extract an effective quality factor lower than the Qis of bare resonators on a similar substrate. d Coherence time as a function of qubit frequency. The measured coherence times do not reach the 2T1 limit. The error bars represent the standard deviations of the fit.
Fig. 5
Fig. 5. Al transmon characterization on etched SiGe substrate.
a Overview of the device. We replaced the semiconductor junction with a shadow-evaporated Al-AlOx-Al junction. Otherwise, we kept the device geometry the same. b Qubit characterization with pulsed two-tone spectroscopy. The red dashed line represents a fit to a Lorentzian function. We choose the measurement frequency such that all information is contained in the phase of the measured signal. c Relaxation time measurement using the same pulse sequence shown in Fig. 4. The solid red line is a fit to an exponential decay. d Coherence time measurement using the same pulse sequence as shown in Fig. 4. The solid red line is a fit to a decaying sinusoidal oscillation.

References

    1. Xiang, Z.-L., Ashhab, S., You, J. Q. & Nori, F. Hybrid quantum circuits: superconducting circuits interacting with other quantum systems. Rev. Mod. Phys.85, 623–653 (2013).
    1. Aguado, R. A perspective on semiconductor-based superconducting qubits. Appl. Phys. Lett.117, 240501 (2020).
    1. De Lange, G. et al. Realization of microwave quantum circuits using hybrid superconducting-semiconducting nanowire josephson elements. Phys. Rev. Lett.115, 127002 (2015). - PubMed
    1. Larsen, T. W. et al. Semiconductor-nanowire-based superconducting qubit. Phys. Rev. Lett.115, 127001 (2015). - PubMed
    1. Casparis, L. et al. Superconducting gatemon qubit based on a proximitized two-dimensional electron gas. Nat. Nanotechnol.13, 915–919 (2018). - PubMed

LinkOut - more resources