. 2024 Jul 30;15(1):6417.
doi: 10.1038/s41467-024-50882-0.

Harnessing DNA replication stress to target RBM10 deficiency in lung adenocarcinoma

Affiliations

Harnessing DNA replication stress to target RBM10 deficiency in lung adenocarcinoma

Feras E Machour et al. Nat Commun. .

Abstract

The splicing factor RNA-binding motif protein 10 (RBM10) is frequently mutated in lung adenocarcinoma (LUAD) (9-25%). Most RBM10 cancer mutations are loss-of-function, correlating with increased tumorigenesis and limiting the efficacy of current LUAD targeted therapies. Remarkably, therapeutic strategies leveraging RBM10 deficiency remain unexplored. Here, we conduct a CRISPR-Cas9 synthetic lethality (SL) screen and identify ~60 RBM10 SL genes, including WEE1 kinase. WEE1 inhibition sensitizes RBM10-deficient LUAD cells in-vitro and in-vivo. Mechanistically, we identify a splicing-independent role of RBM10 in regulating DNA replication fork progression and replication stress response, which underpins RBM10-WEE1 SL. Additionally, RBM10 interacts with active DNA replication forks, relying on DNA Primase Subunit 1 (PRIM1) that synthesizes Okazaki RNA primers. Functionally, we demonstrate that RBM10 serves as an anchor for recruiting Histone Deacetylase 1 (HDAC1) to facilitate H4K16 deacetylation and R-loop homeostasis to maintain replication fork stability. Collectively, our data reveal a role of RBM10 in fine-tuning DNA replication and provide therapeutic arsenal for targeting RBM10-deficient tumors.


Conflict of interest statement

The authors declare no competing interests.

Figures
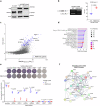
Fig. 1
Fig. 1. Genome-wide CRISPR-Cas9 screen reveals synthetic lethal partners of RBM10 in LUAD cells.
a Immunoblot analysis for RBM10 and flag-Cas9 protein expression in isogenic RBM10-deficient HCC827 cells constitutively expressing flag-Cas9. β-actin is used as a loading control. The samples derive from the same experiment but different gels for β-actin and RBM10 and another for flag were processed in parallel. The positions of molecular weight markers are indicated to the right. Representative of at least 3 independent experiments. b RT-PCR analysis of NUMB exon 9 alternative splicing in parental (WT) and HCC827-Cas9RBM10-KO cells. RNA was isolated from the indicated cell lines and analyzed by RT-PCR using primers flanking NUMB exons 8–10. Left: representative agarose gel image showing amplification of two NUMB variants that differ in exon 9 inclusion. Right: precent-spliced-in (PSI) quantification of NUMB exon 9 inclusion. Data are presented as mean ± s.d. (n = 3 independent experiments). P value was determined by unpaired two-tailed t-test. c Results of CRISPR-Cas9 SL screen in WT and HCC827-Cas9RBM10-KO cells performed in triplicates. CRISPR Counts Analysis (CCA) score is plotted against the difference in gene essentiality score, expressed as Bayes Factor (BF), between RBM10-KO cells and WT cells. RBM10 SL genes are shown in blue. d Gene ontology analysis of RBM10 SL genes identified in the CRISPR-Cas9 SL screen. e Clonogenic survival of WT and HCC827-Cas9RBM10-KO cells transduced with inducible vector expressing either scramble shRNA or shRNA targeting the indicated genes upon the addition of doxycycline (DOX). Top: Representative images of crystal violet staining of the indicated cell lines treated with DOX. Bottom: Quantification of clonogenic survival in DOX-treated cells normalized to untreated cells. Data are presented as mean ± s.d. (n = 3 independent experiments). P values were determined by unpaired two-tailed t-test. f STRING interaction network of RBM10 SL genes involved in replication stress response and cell cycle. The thickness of the connecting line indicates interaction confidence. Source data are provided as a Source Data file.
Fig. 2
Fig. 2. RBM10 promotes DNA replication fork progression and replication stress response.
a, b Replication fork speed measurement using DNA combing assay in WT and RRBM10-KO HCC827 (a) or H1299 (b) cells. Horizontal bars represent mean value of replication fork speed ± SEM (HCC827-Cas9 cells: nwt = 223, nRBM10-KO = 209, nRBM10-KO2 = 214; H1299 cells: nwt = 193, nRBM10-KO = 195 fibers). P value was determined by two-tailed Mann–Whitney test. c Representative immunofluorescence microscopy images of pRPA32-S33 and γH2AX foci in H1299WT and H1299RBM10-KO cells. EdU is used to mark S-phase cells. DAPI is used to stain nuclei. Scale bar, 20 µm. d, e Quantification of γH2AX (d) and pRPA32-S33 (e) foci in S-phase (EdU-positive) H1299WT and H1299RBM10-KO cells. Horizontal bars represent mean foci number per nucleus ± SEM (n = 95 cells for WT cells and n = 110 cells for RBM10-KO cells) and representative of three independent experiments. P value was determined by two-tailed Mann–Whitney test. f H1299WT and H1299RBM10-KO cells were treated with 2 mM hydroxyurea (HU) for 2 h and subjected to immunoblot analysis at the indicated times after release from HU. The samples derive from the same experiment but different gels for RBM10, pRPA32 S4/S8, γH2AX, H3 and another for RPA32 were processed in parallel. UT=untreated. The positions of molecular weight markers are indicated to the right. Representative of three independent experiments. g Short-term cell viability assay in parental (WT) and RBM10-KO HCC827-Cas9 cells treated with increasing concentrations of HU. Data are presented as mean ± s.d. (n = 3 independent experiments). Source data are provided as a Source Data file.
Fig. 3
Fig. 3. PRIM1-dependent RBM10 association with DNA replication forks promotes HDAC1 recruitment to limit replication stress.
a Top: HEK293T cells expressing EGFP-RBM10 or EGFP only were subjected to GFP-trap analysis. Bottom: GFP-trap was performed on HEK293T cells additionally expressing Flag-MCM5. The samples derive from the same experiment but different gels for each indicated antibody were processed in parallel. Positions of molecular weight markers are indicated. Immunoblots are representative of three independent experiments. b, c Representative images of three independent experiments showing RBM10:PCNA (b) and RBM10:EdU-biotin (c) proximity ligation assay (PLA) foci in H1299WT and H1299RBM10-KO cells. Scale bar, 20 µm. d Left: representative images of RBM10:EdU-biotin PLA in H1299WT cells transfected with siRNA against PRIM1 (siPRIM1) or control siRNA (siCtrl). Scale bar, 50 µm. Right: quantification of RBM10-EdU-biotin PLA intensity per nucleus. Horizontal bars represent mean PLA intensity per nucleus ± SEM (n = 206 cells for siCtrl and n = 225 cells for siPRIM1) and representative of three independent experiments. P value was determined by two-tailed Mann–Whitney test. e As in d, except slides were treated with RNaseH prior to PLA (n = 222 cells for untreated slides and n = 207 cells for RNaseH-treated slides). Scale bar, 50 µm. f As in d except of using H1299RBM10-KO cells expressing Flag-RBM10WT, Flag-RBM10ΔZNF1, or vector only (VO) (nWT=191, nVO = 183, nRBM10-WT = 354, nRBM10- ΔZNF1 = 310, nRBM10-ΔRRM2 = 130 cells). Scale bar, 20 µm. g Immunoblot analysis of H1299RBM10-KO cells expressing Flag-RBM10WT, Flag-RBM10ΔRRM2, Flag-RBM10ΔZNF1, or vector only (VO). The samples derive from the same experiment but different gels for each indicated antibody were processed in parallel. Band intensity of γH2AX (relative to H3) and pRPA32-S33 (relative to RPA32) was quantified. Data presented as mean ± s.d. (n = 3 independent experiments). P value was determined by unpaired two-tailed t-test. ns, not significant. h, i Left: Representative immunofluorescence images of HDAC1:EdU-biotin (h) and H4K16ac:EdU-biotin (i) PLA in H1299WT and H1299RBM10-KO cells. Cells were either left untreated (UT) or treated with HU. Scale bar, 20 µm. Right: Quantification of PLA intensity per nucleus. Horizontal bars represent mean PLA intensity per nucleus ± SEM (HDAC1:EdU PLA—nWT-UT = 106, nWT-HU = 144, nKO-UT = 119, nKO-HU = 129; H4K16ac:EdU PLA—nWT-UT = 110, nWT-HU = 134, nKO-UT = 125, nKO-HU = 109 cells) and representative of 3 independent experiments. P value was determined by two-tailed Mann-Whitney test. j Left: Representative images of R-loops detected by S9.6 antibody in H1299WT and H1299RBM10-KO cells. Scale bar, 10 µm. Right: Quantification of S9.6 signal in H1299WT and H1299RBM10-KO cells. Horizontal bars represent mean intensity per nucleus ± SEM (nWT- = 76, nWT+RNaseH = 88, nKO-=68, nKO+RNaseH = 86 cells) and representative of 3 independent experiments. P value was determined by two-tailed Mann–Whitney test. Source data are provided as a Source Data file.
Fig. 4
Fig. 4. WEE1 kinase inhibition selectively sensitizes RBM10-deficient LUAD cells.
a Short-term cell viability assay and EC50 determination in WT and two RBM10-KO clones (KO and KO2) of HCC827-Cas9 cells treated with increasing concentrations of MK1775. Data are presented as mean ± s.d. (n = 3 independent experiments). b Clonogenic survival of WT and two RBM10-KO clones treated with the indicated concentrations of MK1775. Left, representative images of plates stained with crystal violet. Right, quantification of clonogenic survival. Data are presented as mean ± s.d (n = 2 independent experiments). c As in a, except of using HCC827RBM10-KO3 cells expressing flag-RBM10WT, RBM10ΔRRM2, RBM10ΔZNF1, or vector only. d As in a, except of using H1299WT and H1299RBM10-KO cells. e Clonogenic survival of H1299WT and H1299RBM10-KO cells treated with the indicated concentrations of MK1775. Top: representative images of plates stained with crystal violet. Bottom: quantification of clonogenic survival. Data are presented as mean ± s.d. (n = 3 independent experiments). f, g As in a, except of using NCI-H1944 (f) or NCI-H1975 (g) cells expressing either flag-RBM10-WT or vector only. Source data are provided as a Source Data file.
Fig. 5
Fig. 5. DNA damage and premature mitotic entry underpin RBM10-WEE1 synthetic lethality.
a Quantification of γH2AX staining in H1299WT and H1299RBM10-KO cells treated with MK1775. Data are presented as mean nuclear intensity ± SEM (nWT- = 708, nKO-=1038, nWT+300nM = 648, nKO+300nM = 589 cells) and representative of three independent experiments. P values were determined by two-tailed Mann–Whitney test. b Immunoblot analysis of DNA damage and replication stress markers in H1299WT and H1299RBM10-KO cells after MK1775 treatment. Histone H3 is used as a loading control. The samples derive from the same experiment but different gels for pRPA32 S4/S8, pCHK1-S345, γH2AX, another for RBM10, another for CHK1, another for H3, and another for RPA32 were processed in parallel. Positions of molecular weight markers are indicated. Data is representative of at least three independent experiments. c Representative images of alkaline comet assay in H1299WT and H1299RBM10-KO cells treated with MK1775. d Quantification of DNA damage represented by comet tail moment. Horizontal bars represent mean tail moment ± SEM (nWT = 137, nRBM10-KO = 135, nWT+300nM = 151, nRBM10-KO+300nM = 154, nWT+1000nM = 135, nRBM10-KO+1000nM = 106 cells) and representative of three independent experiments. P values were determined by two-tailed Mann–Whitney test. e Representative image for native BrdU staining in H1299WT and H1299RBM10-KO cells treated with MK1775. Scale bar, 50 µm. f Quantification of native BrdU staining. Data are presented as mean nuclear intensity ± SEM (nWT = 215, nRBM10-KO = 114, nWT+MK1775 = 550, nRBM10-KO+MK1775 = 381 cells) and representative of three independent experiments. P value was determined by two-tailed Mann–Whitney test. g DNA combing analysis with S1 nuclease treatment in H1299WT and H1299RBM10-KO cells treated with MK1775. Data are presented as mean CldU track length ± SEM (nWT = 102, nWT+MK1775 = 134, nRBM10-KO = 106, nRBM10-KO+MK1775 = 94 fibers). P values were determined by two-tailed Mann–Whitney test. h Representative images showing premature mitotic entry in H1299WT and H1299RBM10-KO cells treated with MK1775. EdU incorporation and pH3(Ser10) were used to determine DNA synthesis and mitotic entry, respectively. Scale bar, 20 µm. i, j Quantification of premature mitotic entry events in parental (WT) and H1299RBM10-KO (i) and HCC827RBM10-KO (j) cells. Premature mitosis events were calculated as the percentage of EdU-positive cells from the pH3(Ser10)-positive (mitotic) cells and presented as mean ± s.d. (n = 6 independent experiments). P value was determined by unpaired two-tailed t-test. k Representative images of γH2AX and DAPI staining in H1299WT and H1299RBM10-KO cells treated with MK1775. Scale bar, 10 µm. l Quantification of cells with micronuclei in H1299WT and H1299RBM10-KO cells treated with MK1775. Data are presented as mean ± SEM (n = 3 independent experiments). P values were determined by unpaired two-tailed t-test. Source data are provided as a Source Data file.
Fig. 6
Fig. 6. MK1775 inhibits the growth of RBM10-deficient LUAD cells in vivo.
a, b Tumor weight of parental (WT) and HCC827-Cas9RBM10-KO (a) and H1299RBM10-KO (b) xenografts treated with either MK1775 or vehicle. MK1775 was administered once daily at 40 mg/kg for 15 days. Results are shown as mean tumor weight ± SEM (n = 6 mice). P values were determined by unpaired two-tailed t-test. c, d Quantification of γH2AX immunostaining in xenograft tumor sections from parental and HCC827-Cas9RBM10-KO (c) and H1299RBM10-KO (d) tumors treated with either MK1775 or vehicle. Data are presented as the average percentage γH2AX positive cells ± SEM of sections of three different tumors for each group. P values were determined by unpaired two-tailed t-test. e Tumor weight of NCI-H1944 and NCI-H1975 xenografts treated with either MK1775 or vehicle. MK1775 was administered once daily at 40 mg/kg for 15 days. Results are shown as mean tumor weight ± SEM (n = 5 mice for NCI-H1944, n = 6 mice for NCI-H1975). P values were determined by unpaired two-tailed t-test. f Clonogenic survival of H1299WT and H1299RBM10-KO cells treated with the indicated concentrations of alisertib. Left, representative images of plates stained with crystal violet. Right, quantification of clonogenic survival. Data are presented as mean ± s.d. (n = 3 independent experiments). P values were determined by unpaired two-tailed t-test. g Short-term cell viability assay and EC50 determination in H1299WT and H1299RBM10-KO cells treated with increasing concentrations of alisertib with or without treatment with 300 nM MK1775. Data are presented as mean ± s.d. (n = 3 independent experiments). h Tumor growth inhibition in H1299WT and H1299RBM10-KO xenografts treated with MK1775 alone, MK1775 and alisertib combination, or vehicle. MK1775 alone or MK1775 and alisertib combination were administered once daily at 30 mg/kg for 15 days. Results are shown as percentage tumor growth inhibition relative to vehicle ± SEM (n = 6 mice for MK1775 alone and vehicle, n = 5 mice for MK1775 + alisertib combination). P values were determined by unpaired two-tailed t-test. Source data are provided as a Source Data file.
Fig. 7
Fig. 7. Model depicting the novel role of RBM10 in DNA replication and replication stress response.
(Top) RBM10 association with active DNA replication forks is dependent on PRIM1, which synthetizes the RNA primer of Okazaki fragments. RBM10 promotes the recruitment of HDAC1 to ongoing and stressed replication forks and ensures the deacetylation of H4K16, thereby limiting R-loop formation and maintaining fork stability. (Bottom) In RBM10-deficient cells, defective HDAC1 recruitment and H4K16 deacetylation at stressed replication forks contributes to R-loop accumulation, fork destabilization, and ssDNA gap formation leading to replication stress. High levels of replication stress render RBM10-deficient tumor cells sensitive to WEE1 kinase inhibition, leading to the accumulation of DNA damage and mitotic catastrophe resulting in tumor cell death. Figure created with BioRender.com released under a Creative Commons Attribution-NonCommercial-NoDerivs 4.0 International license.

Similar articles

Cited by

References

    1. Sung, H. et al. Global Cancer Statistics 2020: GLOBOCAN estimates of incidence and mortality worldwide for 36 Cancers in 185 Countries. CA Cancer J. Clin.71, 209–249 (2021). 10.3322/caac.21660 - DOI - PubMed
    1. Siegel Mph, R. L. et al. Cancer statistics, 2023. CA Cancer J. Clin.73, 17–48 (2023). 10.3322/caac.21763 - DOI - PubMed
    1. Zappa, C. & Mousa, S. A. Non-small cell lung cancer: current treatment and future advances. Transl. Lung Cancer Res.5, 288 (2016). 10.21037/tlcr.2016.06.07 - DOI - PMC - PubMed
    1. Herbst, R. S., Morgensztern, D. & Boshoff, C. The biology and management of non-small cell lung cancer. Nature553, 446–454 (2018). 10.1038/nature25183 - DOI - PubMed
    1. Collisson, E. A. et al. Comprehensive molecular profiling of lung adenocarcinoma. Nature511, 543–550 (2014). 10.1038/nature13385 - DOI - PMC - PubMed

MeSH terms