. 2024 Jul 30;15(1):6425.
doi: 10.1038/s41467-024-50714-1.

A machine learning model that outperforms conventional global subseasonal forecast models

Affiliations

A machine learning model that outperforms conventional global subseasonal forecast models

Lei Chen et al. Nat Commun. .

Abstract

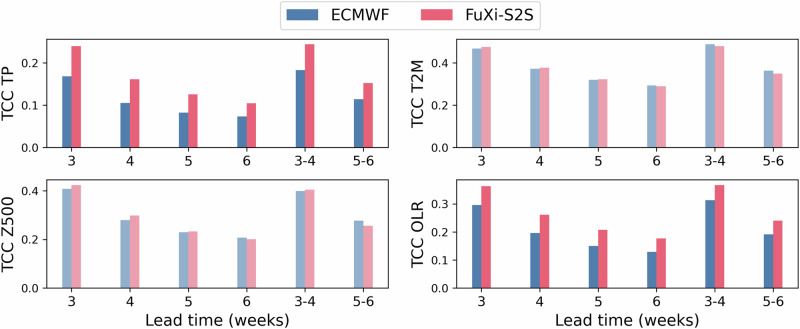
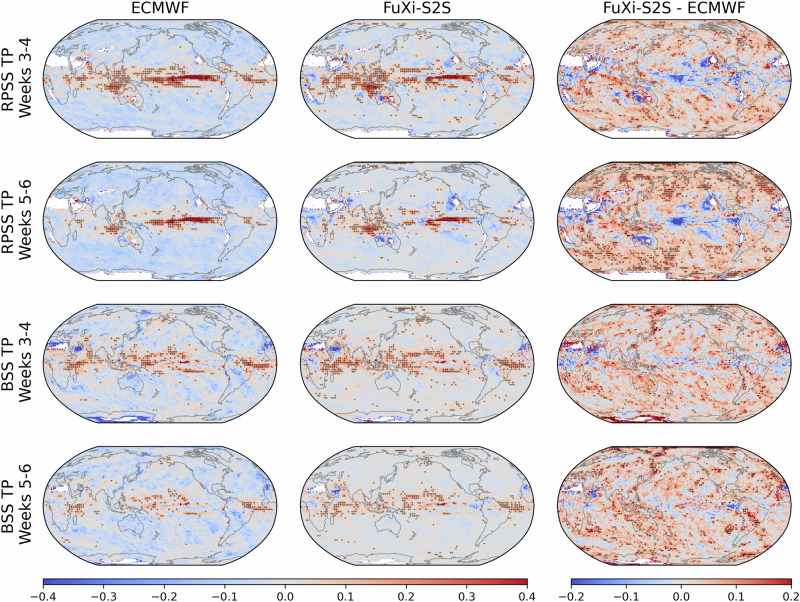
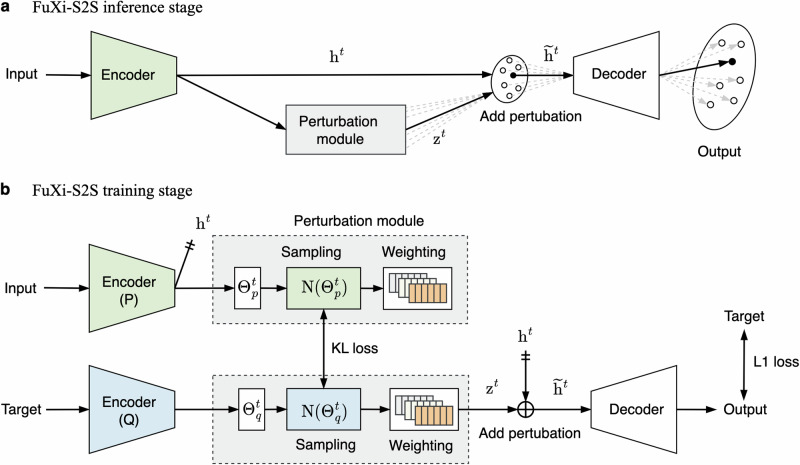
Skillful subseasonal forecasts are crucial for various sectors of society but pose a grand scientific challenge. Recently, machine learning-based weather forecasting models outperform the most successful numerical weather predictions generated by the European Centre for Medium-Range Weather Forecasts (ECMWF), but have not yet surpassed conventional models at subseasonal timescales. This paper introduces FuXi Subseasonal-to-Seasonal (FuXi-S2S), a machine learning model that provides global daily mean forecasts up to 42 days, encompassing five upper-air atmospheric variables at 13 pressure levels and 11 surface variables. FuXi-S2S, trained on 72 years of daily statistics from ECMWF ERA5 reanalysis data, outperforms the ECMWF's state-of-the-art Subseasonal-to-Seasonal model in ensemble mean and ensemble forecasts for total precipitation and outgoing longwave radiation, notably enhancing global precipitation forecast. The improved performance of FuXi-S2S can be primarily attributed to its superior capability to capture forecast uncertainty and accurately predict the Madden-Julian Oscillation (MJO), extending the skillful MJO prediction from 30 days to 36 days. Moreover, FuXi-S2S not only captures realistic teleconnections associated with the MJO but also emerges as a valuable tool for discovering precursor signals, offering researchers insights and potentially establishing a new paradigm in Earth system science research.


Conflict of interest statement

The authors declare no competing interests.

Figures

Fig. 1
Fig. 1. Comparison of globally-averaged and latitude-weighted temporal anomaly correlation coefficient (TCC) of the ensemble mean between ECMWF subseasonal-to-seasonal (S2S) reforecasts (in blue) and FuXi-S2S forecasts (in red) for total precipitation (TP), 2 m temperature (T2M), geopotential at 500 hPa (Z500), and outgoing longwave radiation (OLR).
Rows 1 and 2 represent the performance across these variables, utilizing all testing data from the period spanning from 2017 to 2021. A bootstrapping approach, repeated 1000 times, is used for significance testing. When the FuXi-S2S forecasts fail to show a statistically significant improvement over the ECMWF S2S reforecasts at the 97.5% confidence level, a pale color scheme is used to denote these results.
Fig. 2
Fig. 2. Maps displaying the average Ranked Probability skill Score (RPSS) (first and second rows) and Brier Skill Score (BSS) (third and fourth rows) without latitude weighting, comparing ECMWF subseasonal-to-seasonal (S2S) (first column) and FuXi-S2S (second column) forecasts.
Additionally, the third column depicts the difference in RPSS and BSS between FuXi-S2S and ECMWF S2S for total precipitation (TP) at forecast lead times of weeks 3–4 (first and third rows) and weeks 5–6 (second and fourth rows), utilizing all testing data from 2017 to 2021. Red contour lines in the first and second columns indicate areas with positive values of RPSS and BSS. Stippling on the map denotes areas where the skill score is statistically significant at the 97.5% confidence level. Specifically, in columns 1 and 2, stippling indicates regions where the skill scores of the ECMWF S2S and FuXi-S2S models significantly surpass those of climatology. In column 3, stippling highlights areas where the FuXi-S2S model significantly outperforms the ECMWF S2S.
Fig. 3
Fig. 3. Comparison of real-time multivariate Madden–Julian Oscillation (MJO) (RMM) bivariate Correlation (COR) of the ensemble means between ECMWF subseasonal-to-seasonal (S2S) reforecasts (in blue) and FuXi-S2S forecasts (in red) using all testing data from 2017 to 2021.
a Comparison of RMM bivariate COR as a function of forecast lead times. Dashed black line signifies the prediction skill threshold of COR = 0.5. b The RMM bivariate COR is depicted as a function of the month of initialization (x-axis) and forecast lead time (y-axis), with red and blue lines indicating the skillful MJO prediction days of ECMWF S2S (in blue) and FuXi-S2S (in red), respectively.
Fig. 4
Fig. 4. Comparative analysis for the 2022 Pakistan floods predictions between the ECMWF subseasonal-to-seasonal (S2S) and FuXi-S2S models as well as the precursor signals that contributed to accurate predictions by the FuXi-S2S model.
Comparison of spatially and temporally averaged standardized total precipitation (TP) anomaly (a) over the 2 weeks from August 16th to August 31st, 2022, showcasing GPCP observations (in black) alongside predictions from ECMWF S2S real-time forecasts (in blue) and FuXi-S2S forecasts (in red), with initialization dates: August 11th (08-11, MM-DD), August 8th (08-08), August 4th (08-04), August 1st (08-01), July 28th (07-28), July 25th (07-25), and July 21st (07-21). The black lines on the bar of ECMWF S2S and FuXi-S2S forecasts represent the 25th and 75th percentiles. For the comparison of temporally averaged standardized TP anomaly maps (b), the first column represents GPCP observations, while the second and third columns display predictions from ECMWF S2S and FuXi-S2S, respectively, both initialized on July 28th, and the fourth and fifth columns correspond to predictions from ECMWF S2S and FuXi-S2S, respectively, with an initialization date of July 21st. Green contour indicates the border line of Pakistan. The saliency maps (c) were generated using the gradient of the negative standardized TP anomaly, averaged over the Pakistan region, in relation to the input SST. These maps correspond to forecasts initialized on July 28th (07-28, first column) and July 21st (07-21, second column). Here, the red and blue colors indicate the positive and negative correlations between the negative of standardized TP and variations in SST. The black lines on the bars in this figure represent the 25th and 75th percentiles of the ensemble forecasts for each start date for both ECMWF and FuXi-S2S models.
Fig. 5
Fig. 5. Schematic diagram of the structures of the FuXi Subseasonal-to-Seasonal (FuXi-S2S) model.
a Inference stage of the FuXi-S2S model. ht represents the hidden feature generated by the Encoder from the input data. The perturbation vector zt is generated by the perturbation module, resulting in the perturbed hidden feature h~t. b Training stage of the FuXi-S2S model. N(Θpt) and N(Θqt) are the low-rank multivariate Gaussian distributions generated by encoders P and Q, respectively. The Kullback–Leibler (KL) divergence loss measures the discrepancy between the distributions predicted by both encoders, N(Θpt) and N(Θqt).

Similar articles

Cited by

References

    1. National Academies of Sciences. Next generation earth system prediction: strategies for subseasonal to seasonal forecasts (National Academies Press, Washington, DC, 2016).
    1. White, C. J. et al. Potential applications of subseasonal-to-seasonal (s2s) predictions. Meteorol Appl.24, 315–325 (2017).10.1002/met.1654 - DOI
    1. Pegion, K. et al. The subseasonal experiment (subx): a multimodel subseasonal prediction experiment. Bull. Am. Meteorol Soc.100, 2043–2060 (2019).10.1175/BAMS-D-18-0270.1 - DOI
    1. White, C. J. et al. Advances in the application and utility of subseasonal-to-seasonal predictions. Bull. Am. Meteorol Soc.103, E1448–E1472 (2022).10.1175/BAMS-D-20-0224.1 - DOI
    1. Domeisen, D. I. et al. Advances in the subseasonal prediction of extreme events: relevant case studies across the globe. Bull. Am. Meteorol Soc.103, E1473–E1501 (2022).10.1175/BAMS-D-20-0221.1 - DOI