. 2024 Jul 30;15(1):6394.
doi: 10.1038/s41467-024-50615-3.

Structure of the MlaC-MlaD complex reveals molecular basis of periplasmic phospholipid transport

Affiliations

Structure of the MlaC-MlaD complex reveals molecular basis of periplasmic phospholipid transport

Peter Wotherspoon et al. Nat Commun. .

Abstract

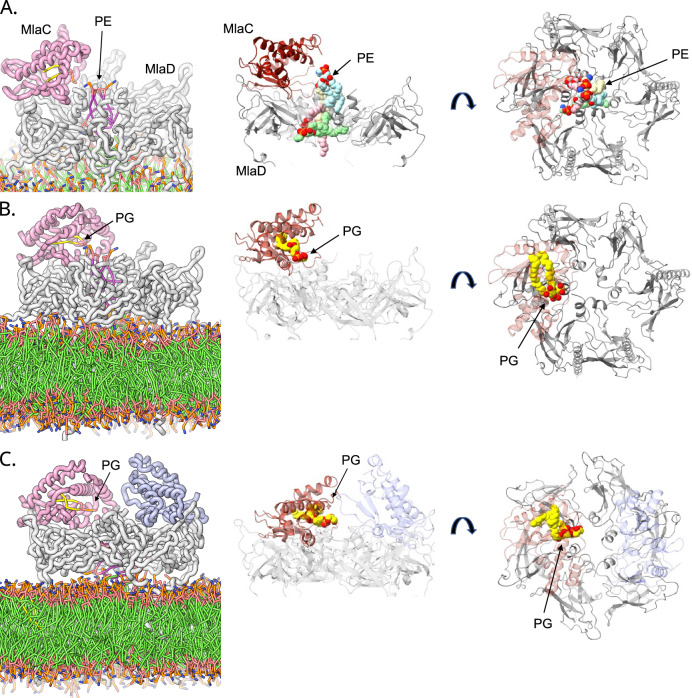
The Maintenance of Lipid Asymmetry (Mla) pathway is a multicomponent system found in all gram-negative bacteria that contributes to virulence, vesicle blebbing and preservation of the outer membrane barrier function. It acts by removing ectopic lipids from the outer leaflet of the outer membrane and returning them to the inner membrane through three proteinaceous assemblies: the MlaA-OmpC complex, situated within the outer membrane; the periplasmic phospholipid shuttle protein, MlaC; and the inner membrane ABC transporter complex, MlaFEDB, proposed to be the founding member of a structurally distinct ABC superfamily. While the function of each component is well established, how phospholipids are exchanged between components remains unknown. This stands as a major roadblock in our understanding of the function of the pathway, and in particular, the role of ATPase activity of MlaFEDB is not clear. Here, we report the structure of E. coli MlaC in complex with the MlaD hexamer in two distinct stoichiometries. Utilising in vivo complementation assays, an in vitro fluorescence-based transport assay, and molecular dynamics simulations, we confirm key residues, identifying the MlaD β6-β7 loop as essential for MlaCD function. We also provide evidence that phospholipids pass between the C-terminal helices of the MlaD hexamer to reach the central pore, providing insight into the trajectory of GPL transfer between MlaC and MlaD.


Conflict of interest statement

The authors declare no competing interests.

Figures

Fig. 1
Fig. 1. Cardiolipin stabilises the MlaCD complex.
A Size exclusion chromatography (Superdex 200) analysis of MlaC and MlaD and their copurification in the absence (CL-) and presence (CL+) of cardiolipin. Peak numbers are indicated above the peaks. Peak 1 refers to MlaC elution, Peak 2 MlaD elution and Peak 3 aggregate. In the presence of cardiolipin, the ratio of Peak 1 to Peak 2 is altered showing increased protein in Peak 2. B SDS-PAGE of peak fractions from (A) showing the presence of MlaC co-purifying with MlaD in Peak 2 in the presence of cardiolipin only. Representative data of n > 3 independent purifications. C Analytical ultracentrifugation sedimentation velocity analysis of the effect of cardiolipin on MlaCD complex formation. D Thin layer chromatography showing the presence of cardiolipin within the MlaC fraction isolated from (A), samples are compared against a polar lipid (PL) control composed of CL, phosphatidylglycerol (PG) and phosphatidylethanolamine (PE). Source data are provided as a Source data file.
Fig. 2
Fig. 2. Structure of the MlaCD complex, with two distinct stoichiometries.
A, C Side view (top panel), top view (middle panel) and front view (bottom panel in A) of the cryo-EM map of MlaCD, with a 1:6 stoichiometry (A) or 2:6 stoichiometry (C). B, D Cartoon representation of the corresponding atomic models. Maps and atomic models are coloured by chain as follows: MlaC1 (dark red), MlaC2 (dark blue), MlaD1 (light green), MlaD2 (purple), MlaD3 (beige), MlaD4 (light red), MlaD5 (grey) and MlaD6 (dark green).
Fig. 3
Fig. 3. The binding interface of MlaCD.
A MlaC (red) is shown bound to the MlaD hexamer from the side. MlaD1 (green) and the α1 helix of MlaD6 (beige) are shown highlighting how MlaC is pinched between the β6-β7 helix and the central helix assembly. Chains are coloured as in Fig. 2. B As in (A) but the MlaC surface is shown highlighting the position of the lipid binding cavity between the α1 helices of MlaD1 and MlaD6. C α1 helix interface residues identified through cross-linking with likely interacting partners identified. Upper panel lacks MlaD6 for clarity. D β6-β7 loop interface residue F118 identified through cross-linking with likely interacting partners identified. β6-β7 loop residues 120–122 cut away for clarity. E Pro124 identified through cross-linking showing the absence of close contacts to MlaD2 (purple) in the MlaCD(1:6) structure presented here.
Fig. 4
Fig. 4. Structural changes to MlaD upon binding to MlaC.
A Overlay of MlaCD(1:6) (coloured from MlaD1 to MlaD6 in green, purple, brown, pink, cyan and beige respectively) with the MlaD hexamer from the apo crystal structure. C2 symmetry axis shown (5UW2, grey). The hexamer is aligned to the MlaD1 chain. In the structure bound to MlaC, the hexamer no longer adopts a strict 6-fold symmetry, with a notable enlargement of the structure. B Overlay of MlaCD(1:6) with MlaD(2:6) coloured according to (A). C Angle changes observed between MlaD monomers between the apo structure (5UW2) (green), MlaD(1:6) (blue) and MlaD(2:6) (pink). Angles were measured between MlaD trimers by measuring the angle between an arbitrarily picked residue (113) in each monomer (red) as shown. Source data are provided as a Source data file.
Fig. 5
Fig. 5. The β6-β7 loop is essential for function.
A Screen for SDS/EDTA sensitivity of cells carrying pET22b encoding the WT or mutated copies of MlaC or MlaD in the parent or ΔmlaC/ΔmlaD strain background. WT – BW25113 parent strain. Cells were normalised to an OD600 of 1 and 10-fold serially diluted before being spotted on LB agar containing the indicated condition. Western blot showing levels of MlaC within the cell. Full blot presented in Supplementary Fig. 8. B The positioning of the β6-β7 loop (green) interacting with MlaC (red) is shown, highlighting the residues mutated in (A). C, D FRET-based GPL transport assays. Fluorescence increase corresponds to a reduction in NBD-PE FRET quenching by Rhodamine-PE as lipids are transferred from the MlaA proteoliposome to the MlaFEDB proteoliposome. Excitation wavelength 460 nm, emission wavelength 535 nm. Representative data from n = 3 independent experiments. Data in (C) and (D) show the mean and range from triplicate experiments. The traces in (C) correspond to the F118E (olive green), E119K (green), D120K (pink) and E122K (purple) MlaD mutants investigated in this study alongside the positive WT control (black) and the ΔMlaFEDB negative (blue). The traces in (D) correspond to the Y72F (orange), L76R (olive green) and Q80E (pink) MlaC mutants, which are proximal to the β6-β7 loop of MlaD during interaction, alongside the positive WT control (black) and the ΔMlaFEDB negative (blue). Source data are provided as a Source data file.
Fig. 6
Fig. 6. Access between the ɑ1 helices is important for activity.
A Focus looking down the central channel of MlaD. Positions of residues mutated highlighted. MlaC coloured red, MlaD coloured according to Fig. 4. B SDS-PAGE of MlaD Q149C:L151C boiled under reducing and non-reducing conditions confirming disulphide bond formation occurs between monomers stabilising the hexameric form. C Screen for SDS/EDTA sensitivity of cells carrying pET22b encoding the WT or mutated copies of MlaD in the parent or ΔmlaD strain background. WT – E. coli K12 BW25113 parent strain. Cells were normalised to an OD600 of 1 and 10-fold serially diluted before being spotted on LB agar containing the indicated condition. D Screen for SDS/EDTA sensitivity of cells carrying pET22b encoding the WT or mutated copies of MlaC in the parent or ΔmlaC strain background. Corresponding western blot showing levels of MlaC within the cell. Full blot presented in Supplementary Fig. 8. E, F FRET-based GPL transport assays. Fluorescence increase corresponds to a reduction in NBD-PE FRET quenching by Rhodamine-PE as lipids are transferred from the MlaA proteoliposome to the MlaFEDB proteoliposome. Excitation wavelength 460 nm, emission wavelength 535 nm. Representative data from n = 3 independent experiments. Data in E and F show the mean and range from triplicate experiments. The traces in E) correspond to the L151C (light blue), Q149C (green) and Q149C:L151C (pink) cysteine mutants of MlaD alongside the WT (black) and ΔMlaFEDB negative (blue) controls. The traces in F) correspond to the E169Q (green) and E180A (pink) mutants of MlaC, which are proximal to the MlaD ɑ1 helix during interaction, alongside the positive WT (black) and ΔMlaFEDB negative (blue) controls. Source data are provided as a Source data file.
Fig. 7
Fig. 7. Binding of lipids to membrane-bound MlaCD complex during 5 μs coarse-grained MD simulations.
The first images in rows (A) to (C) are depictions taken from Supplementary Videos 1, 2 & 3, respectively. These include the membrane and show the lipids in the binding pockets. The subsequent images show ribbon diagrams emphasising the position and orientation of the lipids. Both side and top views are presented. A Example snapshot of MlaCD (1:6) (maroon:grey) at 500 ns of the 5 μs simulation, showing 4x PE (2 of which; green and beige, bound through the bottom of the central MlaD pore and originated from the membrane and 2 of which; blue and pink, bound through the top of the pore and originated as free lipids in solution). B Focus on the 1x PG bound to MlaC in MlaCD (1:6). C Focus on the 1x PG bound to MlaC in MlaCD (2:6). Transmembrane helices modelled using AlphaFold. CG simulations converted to AT representation using CG2AT.
Fig. 8
Fig. 8. Binding of a single PE lipid simultaneously between MlaC and MlaD during 5 μs coarse-grained MD simulations.
A Example snapshot of MlaCD (1:6) (maroon:grey) at 500 ns of the 5 μs simulation, showing PE binding simultaneously to MlaC and MlaD, each via a single tail, between the α1 helices of MlaD. The first image is a depiction from Supplementary Video 1, and the subsequent ribbon diagrams depict a side and top view emphasising the lipid orientation. B Zoomed in view of the PE lipid bound simultaneously between MlaC and MlaD, emphasising how the lipid tail binds into the MlaC pocket. C Ribbon diagram showing a zoomed in view of the lipid, and how it is positioned relative to the central helix bundle of MlaD.
Fig. 9
Fig. 9. Possible mechanism for MlaFEDB function.
(1) In the absence of ATP, MlaE (pink) is in the outward-open state forming a channel with MlaD (purple) and able to accommodate GPLs (grey) in its binding pocket. (2) MlaC-GPL (blue) is able to bind. (3) In the presence of ATP (red), the binding pocket collapses, lipids are forced out of the pocket into the membrane. Concurrently a conformational change in MlaD partially closes the MlaC binding pocket pushing a single acyl chain into the MlaD pore. (4) Following ATP hydrolysis MlaE moves back to its outward-open configuration resulting in the binding pocket opening. This conformational change drives the movement of lipids out of MlaC fully into the binding pocket. (5) MlaC-apo, ADP (green) and Pi leave allowing the cycle to start again.

References

    1. Nikaido, H. Restoring permeability barrier function to outer membrane. Chem. Biol.12, 507–509 (2005). 10.1016/j.chembiol.2005.05.001 - DOI - PubMed
    1. Sperandeo, P., Martorana, A. M. & Polissi, A. Lipopolysaccharide biogenesis and transport at the outer membrane of Gram-negative bacteria. Biochim. Biophys. Acta Mol. Cell Biol. Lipids1862, 1451–1460 (2017). 10.1016/j.bbalip.2016.10.006 - DOI - PubMed
    1. Powers, M. J. & Trent, M. S. Intermembrane transport: glycerophospholipid homeostasis of the Gram-negative cell envelope. Proc. Natl Acad. Sci. USA116, 17147–17155 (2019). 10.1073/pnas.1902026116 - DOI - PMC - PubMed
    1. Low, W. Y., Thong, S. & Chng, S. S. ATP disrupts lipid-binding equilibrium to drive retrograde transport critical for bacterial outer membrane asymmetry. Proc. Natl Acad. Sci. USA118, e2110055118 (2021). 10.1073/pnas.2110055118 - DOI - PMC - PubMed
    1. Giacometti, S. I., MacRae, M. R., Dancel-Manning, K., Bhabha, G. & Ekiert, D. C. Lipid Transport Across Bacterial Membranes. Annu. Rev. Cell Dev. Biol.38, 125–153 (2022). 10.1146/annurev-cellbio-120420-022914 - DOI - PubMed

MeSH terms

LinkOut - more resources