. 2024 Jul 30;14(1):17596.
doi: 10.1038/s41598-024-68017-2.

Comprehensive proteomic analysis of the differential expression of 62 proteins following intracortical microelectrode implantation

Affiliations

Comprehensive proteomic analysis of the differential expression of 62 proteins following intracortical microelectrode implantation

Sydney S Song et al. Sci Rep. .

Abstract

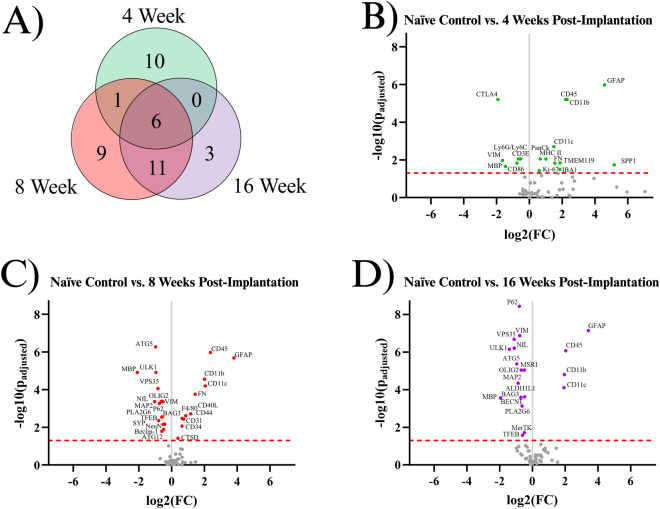
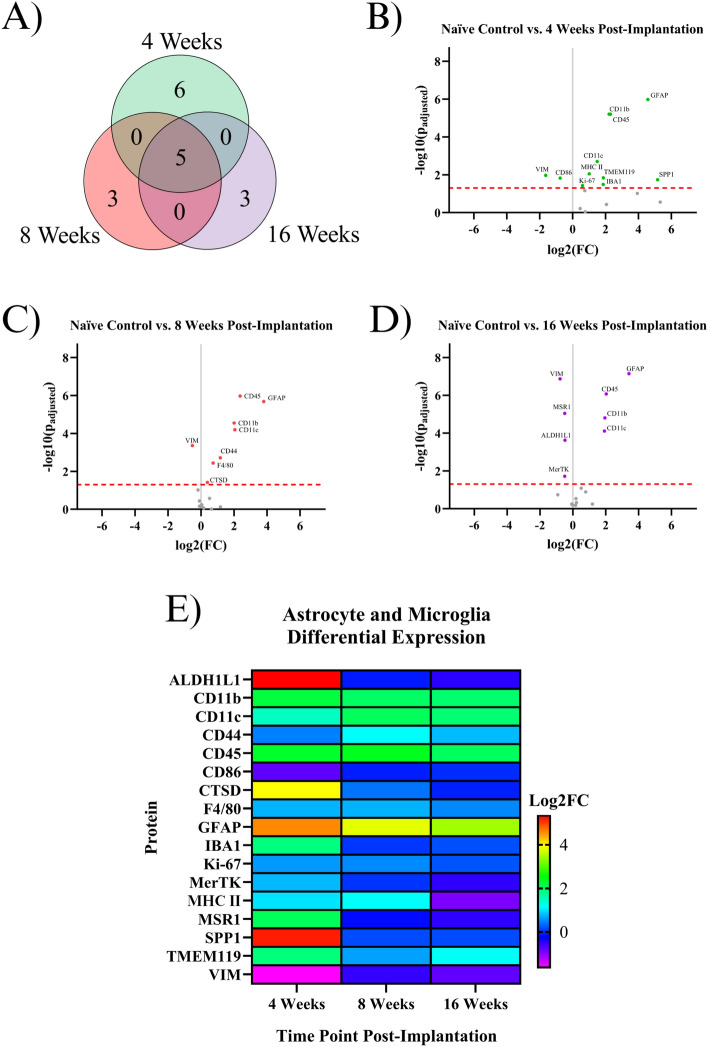
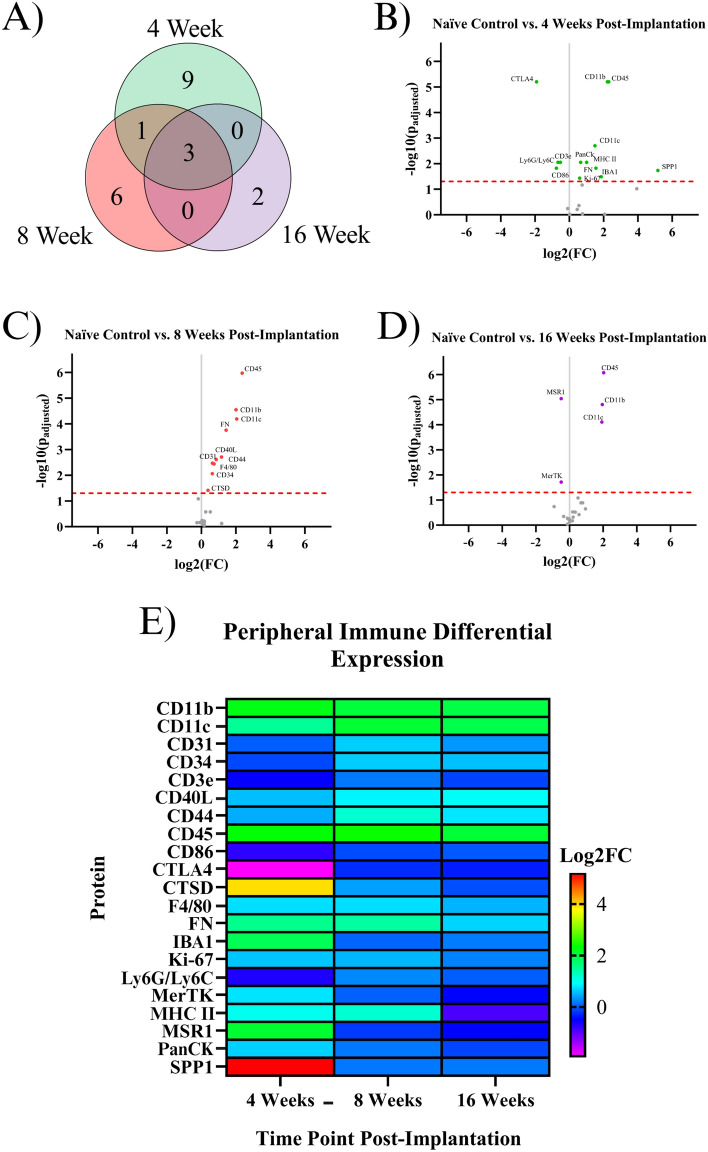
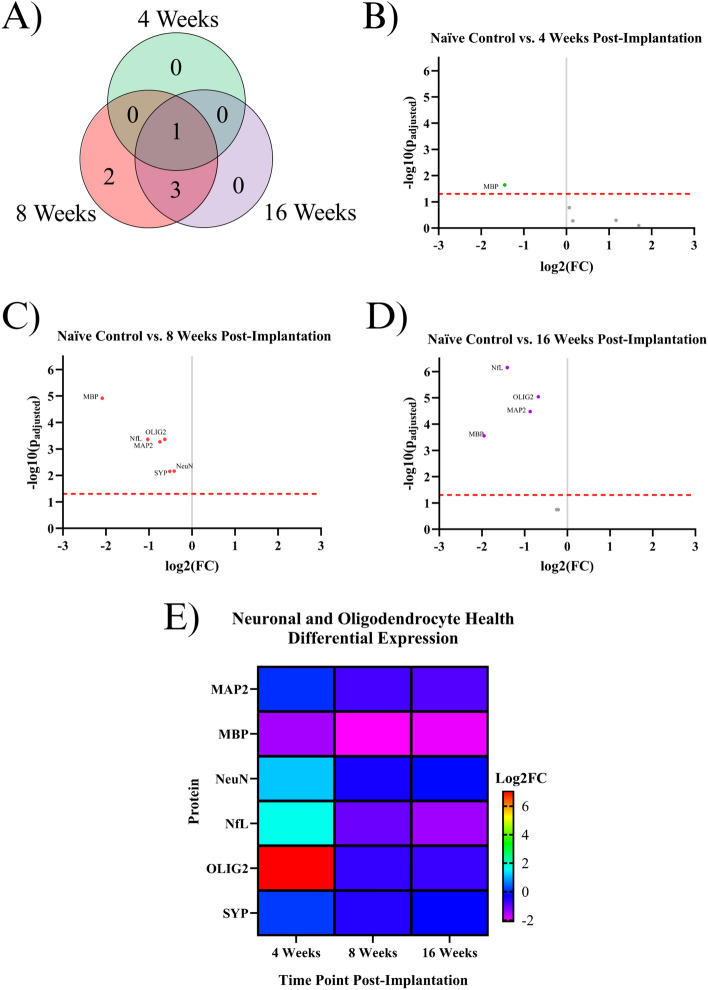
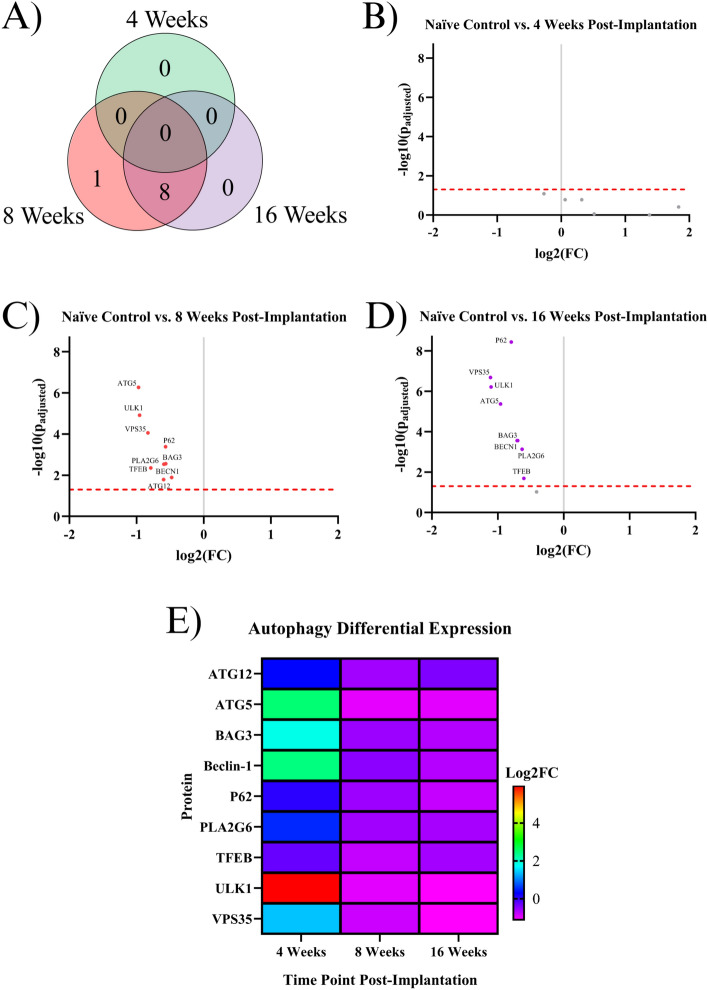
Intracortical microelectrodes (IMEs) are devices designed to be implanted into the cerebral cortex for various neuroscience and neuro-engineering applications. A critical feature of IMEs is their ability to detect neural activity from individual neurons. Currently, IMEs are limited by chronic failure, largely considered to be caused by the prolonged neuroinflammatory response to the implanted devices. Over the past few years, the characterization of the neuroinflammatory response has grown in sophistication, with the most recent advances focusing on mRNA expression following IME implantation. While gene expression studies increase our broad understanding of the relationship between IMEs and cortical tissue, advanced proteomic techniques have not been reported. Proteomic evaluation is necessary to describe the diverse changes in protein expression specific to neuroinflammation, neurodegeneration, or tissue and cellular viability, which could lead to the further development of targeted intervention strategies designed to improve IME functionality. In this study, we have characterized the expression of 62 proteins within 180 μm of the IME implant site at 4-, 8-, and 16-weeks post-implantation. We identified potential targets for immunotherapies, as well as key pathways that contribute to neuronal dieback around the IME implant.


Conflict of interest statement

The authors declare no competing interests.

Figures

Figure 1
Figure 1
Results of the differential expression analysis. (A) Venn diagram of the results, where the values represent the number of significantly differentially expressed proteins within the given time point. This diagram does not differentiate between up- or downregulation. (B–D) Volcano plots of each time point, where each point is a protein in the panel. The red dashed line shows the significance threshold of padjusted = 0.05. All significantly differentially expressed proteins are labeled. One insignificant protein (LC3B, padjusted = 0.19) was omitted from plot B due to an extremely high log2(FC) count of 11.92.
Figure 2
Figure 2
Results of the differential expression analysis of proteins associated with astrocytes and microglia. (A) Venn diagram of the results, where the values represent the number of significantly differentially expressed proteins within the given time point. This diagram does not differentiate between up- or downregulation (B–D) Volcano plots of each time point, where each point is a protein in the panel. The red dashed line shows the significance threshold of padjusted = 0.05. All significantly differentially expressed proteins are labeled. (E) A heat map of the results, where red/yellow/green/teal represents upregulation and dark blue/purple represents downregulation compared to naïve controls.
Figure 3
Figure 3
Results of the differential expression analysis of proteins associated with peripheral immunity. (A) Venn diagram of the results, where the values represent the number of significantly differentially expressed proteins within the given time point. This diagram does not differentiate between up- or downregulation. (B–D) Volcano plots of each time point, where each point is a protein in the panel. The red dashed line shows the significance threshold of padjusted = 0.05. All significantly differentially expressed proteins are labeled. (E) A heat map of the results, where red/yellow/green/teal represents upregulation and dark blue/purple represents downregulation compared to naïve controls.
Figure 4
Figure 4
Results of the differential expression analysis of proteins associated with neurons and oligodendrocytes. (A) Venn diagram of the results, where the values represent the number of significantly differentially expressed proteins within the given time point. This diagram does not differentiate between up- or downregulation. (B–D) Volcano plots of each time point, where each point is a protein in the panel. The red dashed line shows the significance threshold of padjusted = 0.05. All significantly differentially expressed proteins are labeled. (E) A heat map of the results, where red/yellow/green represents upregulation and teal/blue/purple represents downregulation compared to naïve controls.
Figure 5
Figure 5
Results of the differential expression analysis of proteins associated with autophagy. (A) Venn diagram of the results, where the values represent the number of significantly differentially expressed proteins within the given time point. This diagram does not differentiate between up- or downregulation (B–D) Volcano plots of each time point, where each point is a protein in the panel. The red dashed line shows the significance threshold of padjusted = 0.05. All significantly differentially expressed proteins are labeled. (E) A heat map of the results, where red/yellow/green represents upregulation and teal/blue/purple represents downregulation compared to naïve controls.
Figure 6
Figure 6
Results from the literature review show of 188 papers that characterized implanted microelectrodes. Only 1 paper quantified protein expression with counts, rather than typical intensity readings. This paper measured the expression of 3 proteins. The search terms used in PubMed were: "microelectrode" AND ("biological response" OR "inflammation" OR "tissue response" OR "inflammatory response" OR "foreign body response" OR "failure") AND ("brain" OR "cortical" OR "intracortical"). For a complete list of references, see Supplemental Materials.

Update of

References

    1. Ajiboye, A. B. et al. Restoration of reaching and grasping movements through brain-controlled muscle stimulation in a person with tetraplegia: A proof-of-concept demonstration. Lancet389, 1821–1830. 10.1016/S0140-6736(17)30601-3 (2017). 10.1016/S0140-6736(17)30601-3 - DOI - PMC - PubMed
    1. Jorfi, M., Skousen, J. L., Weder, C. & Capadona, J. R. Progress towards biocompatible intracortical microelectrodes for neural interfacing applications. J. Neural Eng.12, 011001. 10.1088/1741-2560/12/1/011001 (2015). 10.1088/1741-2560/12/1/011001 - DOI - PMC - PubMed
    1. Stifani, N. Motor neurons and the generation of spinal motor neuron diversity. Front. Cell Neurosci.8, 293. 10.3389/fncel.2014.00293 (2014). 10.3389/fncel.2014.00293 - DOI - PMC - PubMed
    1. Rapeaux, A. B. & Constandinou, T. G. Implantable brain machine interfaces: First-in-human studies, technology challenges and trends. Curr. Opin. Biotechnol.72, 102–111. 10.1016/j.copbio.2021.10.001 (2021). 10.1016/j.copbio.2021.10.001 - DOI - PubMed
    1. Shih, J. J., Krusienski, D. J. & Wolpaw, J. R. Brain–computer interfaces in medicine. Mayo Clin. Proc.87, 268–279. 10.1016/j.mayocp.2011.12.008 (2012). 10.1016/j.mayocp.2011.12.008 - DOI - PMC - PubMed

LinkOut - more resources