. 2024 Jul 30;14(1):17571.
doi: 10.1038/s41598-024-68098-z.

Deciphering the role of protein kinase A in the control of FoxP3 expression in regulatory T cells in health and autoimmunity

Affiliations

Deciphering the role of protein kinase A in the control of FoxP3 expression in regulatory T cells in health and autoimmunity

Maria Teresa Lepore et al. Sci Rep. .

Abstract

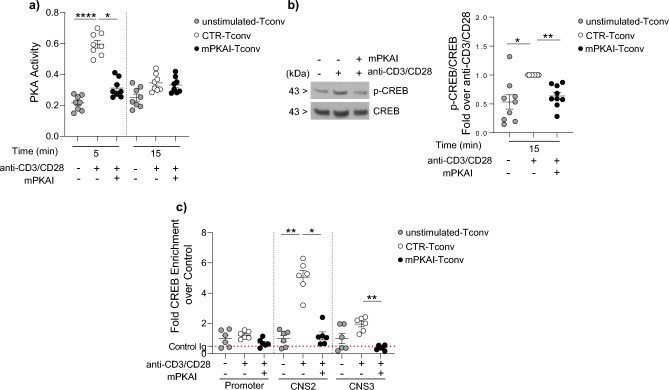
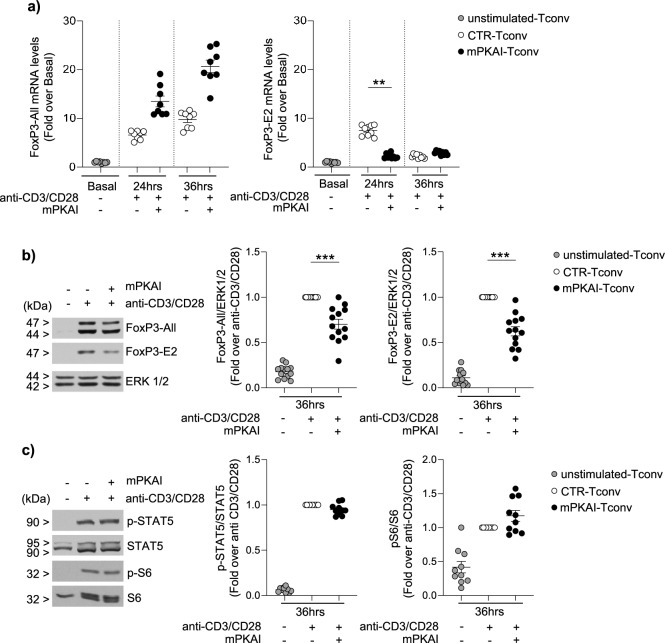
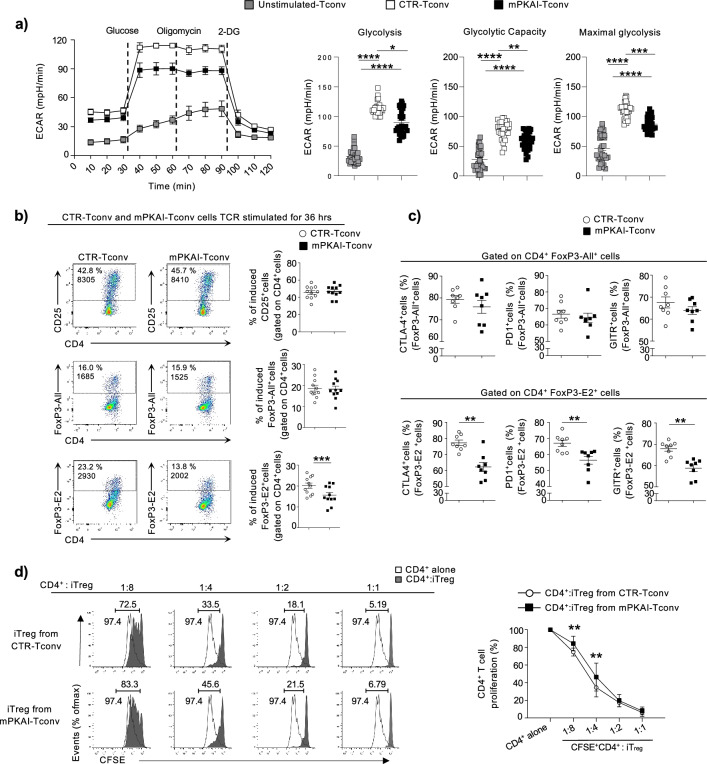
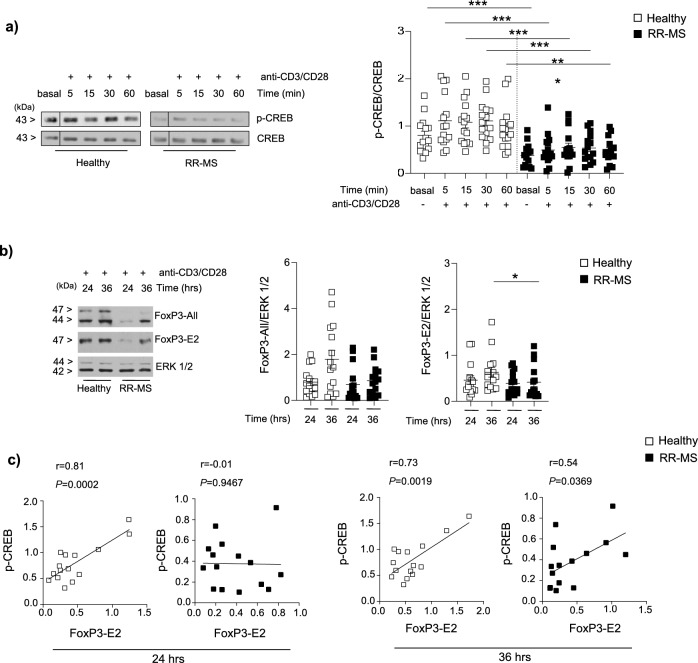
The molecular mechanisms that govern differential T cell development from CD4+CD25-conventional T (Tconv) into CD4+CD25+ forkhead-box-P3+ (FoxP3+) inducible regulatory T (iTreg) cells remain unclear. Herein, we investigated the relative contribution of protein kinase A (PKA) in this process. Mechanistically, we found that PKA controlled the efficiency of human iTreg cell generation through the expression of different FoxP3 splicing variants containing or not the exon 2. We found that transient PKA inhibition reduced the recruitment of cAMP-responsive element-binding protein (CREB) on regulatory regions of the FoxP3 gene, a condition that is associated with an impaired acquisition of their suppressive capacity in vitro. To corroborate our findings in a human model of autoimmunity, we measured CREB phosphorylation and FoxP3 levels in iTreg cells from treatment-naïve relapsing-remitting (RR)-multiple sclerosis (MS) subjects. Interestingly, both phospho-CREB and FoxP3 induction directly correlated and were significantly reduced in RR-MS patients, suggesting a previously unknown mechanism involved in the induction and function of human iTreg cells.


Conflict of interest statement

The authors declare no competing interests.

Figures

Figure 1
Figure 1
Low TCR stimulation activates PKA in human Tconv cells. (a) Scatter plots showing PKA activity in human mPKAI-Tconv and CTR-Tconv cells TCR-stimulated for 5 and 15 min. Data are shown from four independent experiments in duplicates (n = 8). (b) Left, immunoblot showing phosphorylated (p) and total CREB in human mPKAI-Tconv and CTR-Tconv cells TCR-stimulated or not for 15 min. Right, relative densitometric quantitation of p-CREB in the aforementioned experimental conditions. Data are shown from nine independent experiments (n = 9); uncropped blots are presented in Supplementary Fig. S2. (c) ChIP assay for CREB on FoxP3 promoter, CNS2 and CNS3 regions of mPKAI-Tconv and CTR-Tconv cells TCR-stimulated for 10 min. The horizontal line (bracket ± SEM) indicates the percent of input from a control ChIP (Ab:non-immune serum). Data are shown from three independent experiments in duplicates (n = 6). Independet experiments refer to different individuals.
Figure 2
Figure 2
Inhibition of PKA impairs FoxP3 induction. (a) Scatter plots showing FoxP3-All (left) and FoxP3-E2 (right) mRNA levels in mPKAI-Tconv and CTR-Tconv cells TCR-stimulated or not for 24 or 36 h, respectively. Data are shown from four independent experiments in duplicates (n = 8). (b) Left, immunoblot analysis of FoxP3-All, FoxP3-E2 and ERK1/2 in mPKAI-Tconv and CTR-Tconv cells TCR-stimulated for 36 h. Right, relative densitometric quantitation of FoxP3-All or FoxP3-E2 normalized on ERK 1/2 in the aforementioned experimental conditions. Data are shown from thirteen independent experiments (n = 13). (c) Left, immunoblot analysis of p-STAT5 and p-S6 in human Tconv cells, as described in B. Right, relative densitometric analysis of p-STAT5 and p-S6 normalized on their total proteins, respectively. Data are shown from five independent experiments in duplicates (n = 10). Independet experiments refer to different individuals. All the uncropped blots are presented in Supplementary Fig. S3.
Figure 3
Figure 3
PKA inhibition affects the immunometabolic asset and phenotype of Tconv cells during their diffentiation towards iTreg cells and their suppressive function (a) Left, kinetic profile of ECAR in human mPKAI-Tconv and CTR-Tconv cells TCR-stimulated or not for 12 h. ECAR was measured in real time, under basal conditions and in response to glucose, oligomycin, and 2-DG. Data are shown from three independent experiments at least in technical duplicates (n = 10). Right, parameters of the glycolytic pathway were calculated from the ECAR profile of Tconv cells in the above-mentioned conditions. Data are expressed as mean ± SEM of three different measurements, each of them in ten replicates (n = 30). (b) Representative dot plots (left) and cumulative data (right) of CD25, FoxP3-All and FoxP3-E2 in mPKAI-Tconv and CTR-Tconv cells. Data are shown from eleven independent experiments (n = 11). (c) Scatter plots showing the expression of CTLA-4, PD-1 and GITR gated on CD4+FoxP3-All+ (top) or CD4+FoxP3-E2+ (bottom) in mPKAI-Tconv and CTR-Tconv cells. Data are shown as mean ± SEM from four independent experiments in duplicates (n = 8). (d) Left, flow cytometry histograms showing proliferation of CFSE+CD4+ T cells TCR-stimulated for 96 h in vitro and cultured alone (empty curves) or in the presence of various numbers of flow-sorted iTreg from mPKAI-Tconv and CTR-Tconv cells. Numbers in plots indicate the percent of CSFE dilution in CD4+ T cells cultured alone (top left) and co-cultured with iTreg cells (above bracketed lines), as indicated. Right, cumulative data of CD4+ T cell proliferation in the above conditions. Data are shown from four independent experiments in duplicates (n = 8). Independet experiments refer to different individuals.
Figure 4
Figure 4
Reduced CREB phosphorylation associates with low FoxP3 expression in Tconv cells during their differentiation towards iTreg cells from autoimmune RR-MS subjects. (a) Left, immunoblot analysis of total and p-CREB in human Tconv cells from healthy and RR-MS subjects TCR-stimulated at different time points. Right, relative densitometric quantitation of p-CREB normalized on total CREB in the aforementioned experimental conditions. (b) Left, immunoblot analysis of FoxP3-All, FoxP3-E2 and ERK 1/2, in TCR-stimulated Tconv cells from healthy (n = 5) and RR-MS (n = 5) subjects. Right, relative densitometric quantitation of FoxP3-All and FoxP3-E2 normalized on ERK 1/2 in above conditions. Data are shown as mean ± SEM from five independent experiments (5 healthy and 5 RR-MS subjects) in triplicates (n = 15). All the uncropped blots are presented in Supplementary Fig. S6. (c) Statistical correlation between expression levels of basal p-CREB from ex-vivo Tconv cells with FoxP3-E2 in healthy (n = 5) and RR-MS (n = 5) subjects, in the above mentioned conditions. All the uncropped blots are presented in Supplementary Fig. S6.

Similar articles

References

    1. Sakaguchi, S., Yamaguchi, T., Nomura, T. & Ono, M. Regulatory T cells and immune tolerance. Cell133, 775–787. 10.1016/j.cell.2008.05.009 (2008). 10.1016/j.cell.2008.05.009 - DOI - PubMed
    1. Kawai, K., Uchiyama, M., Hester, J., Wood, K. & Issa, F. Regulatory T cells for tolerance. Hum. Immunol.79, 294–303. 10.1016/j.humimm.2017.12.013 (2018). 10.1016/j.humimm.2017.12.013 - DOI - PubMed
    1. Dikiy, S. & Rudensky, A. Y. Principles of regulatory T cell function. Immunity56, 240–255. 10.1016/j.immuni.2023.01.004 (2023). 10.1016/j.immuni.2023.01.004 - DOI - PubMed
    1. Joosten, S. A. & Ottenhoff, T. H. Human CD4 and CD8 regulatory T cells in infectious diseases and vaccination. Hum. Immunol.69, 760–770. 10.1016/j.humimm.2008.07.017 (2008). 10.1016/j.humimm.2008.07.017 - DOI - PubMed
    1. Santamaria, J. C., Borelli, A. & Irla, M. Regulatory T cell heterogeneity in the thymus: impact on their functional activities. Front. Immunol.12, 643153. 10.3389/fimmu.2021.643153 (2021). 10.3389/fimmu.2021.643153 - DOI - PMC - PubMed

MeSH terms

Substances

LinkOut - more resources