. 2024 Jul 29;14(1):17469.
doi: 10.1038/s41598-024-67479-8.

TRPML1 activation ameliorates lysosomal phenotypes in CLN3 deficient retinal pigment epithelial cells

Affiliations

TRPML1 activation ameliorates lysosomal phenotypes in CLN3 deficient retinal pigment epithelial cells

D Wünkhaus et al. Sci Rep. .

Abstract

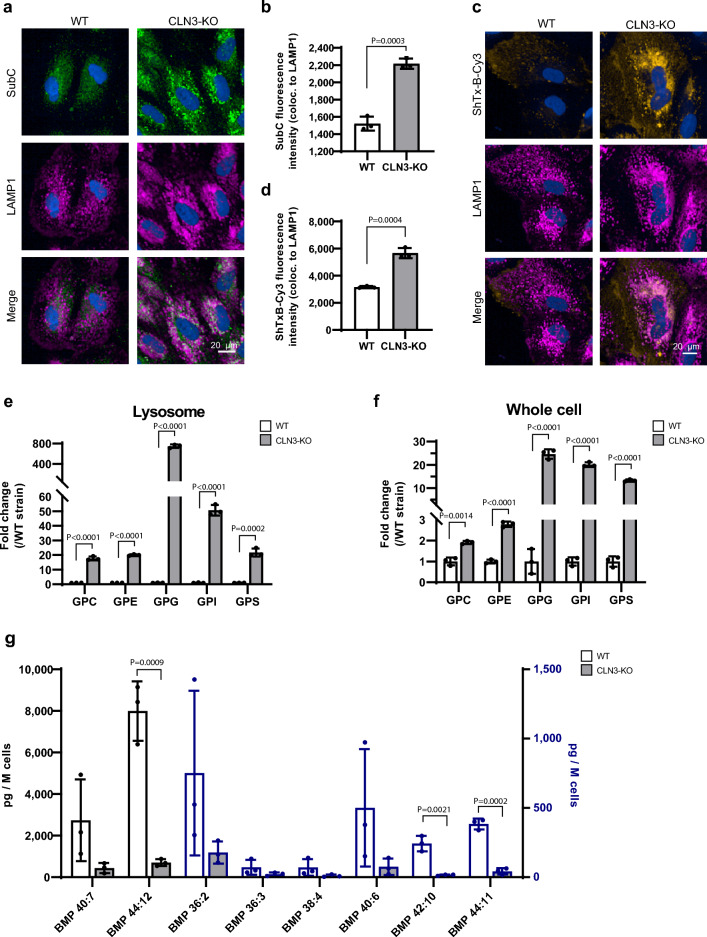
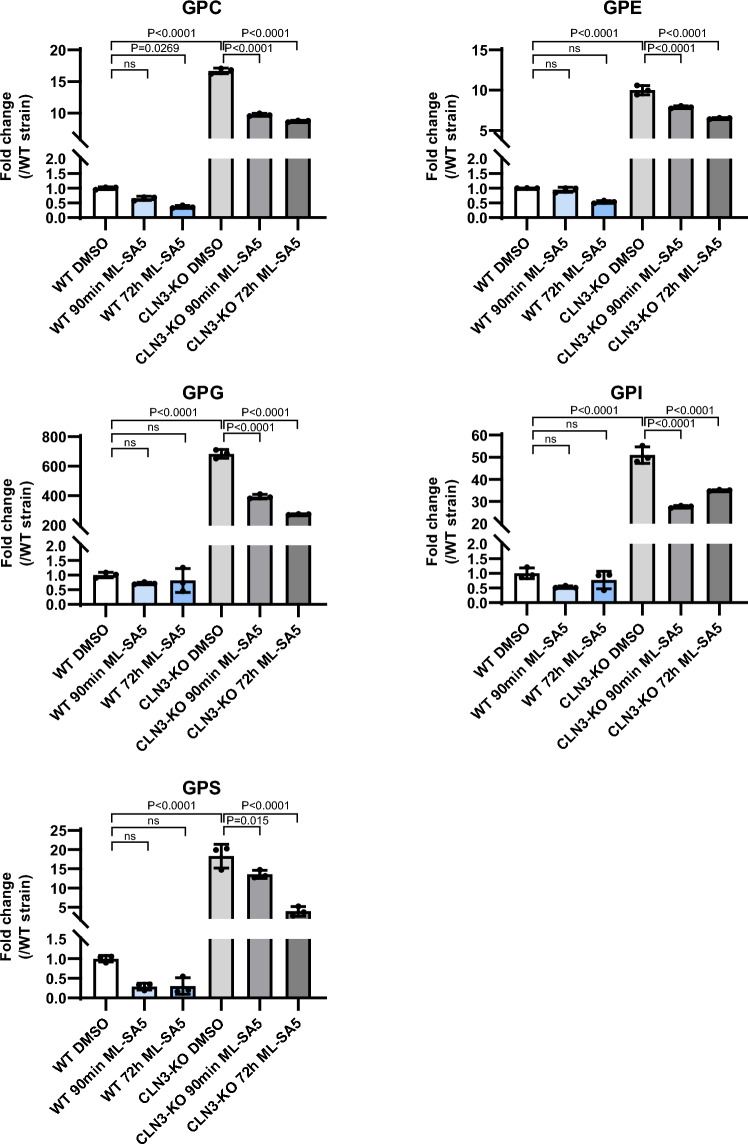
Mutations in the lysosomal membrane protein CLN3 cause Juvenile Neuronal Ceroid Lipofuscinosis (JNCL). Activation of the lysosomal ion channel TRPML1 has previously been shown to be beneficial in several neurodegenerative disease models. Here, we tested whether TRPML1 activation rescues disease-associated phenotypes in CLN3-deficient retinal pigment epithelial (ARPE-19 CLN3-KO) cells. ARPE-19 CLN3-KO cells accumulate LAMP1 positive organelles and show lysosomal storage of mitochondrial ATPase subunit C (SubC), globotriaosylceramide (Gb3), and glycerophosphodiesters (GPDs), whereas lysosomal bis(monoacylglycero)phosphate (BMP/LBPA) lipid levels were significantly decreased. Activation of TRPML1 reduced lysosomal storage of Gb3 and SubC but failed to restore BMP levels in CLN3-KO cells. TRPML1-mediated decrease of storage was TFEB-independent, and we identified TRPML1-mediated enhanced lysosomal exocytosis as a likely mechanism for clearing storage including GPDs. Therefore, ARPE-19 CLN3-KO cells represent a human cell model for CLN3 disease showing many of the described core lysosomal deficits, some of which can be improved using TRPML1 agonists.


Conflict of interest statement

The authors declare no competing interests.

Figures

Figure 1
Figure 1
SubC, Gb3, GPDs and BMP/LBPA levels are altered in CLN3-KO cells. (a) Representative immunocytochemical images of SubC and LAMP1 in cell cycle arrested ARPE-19 WT and CLN3-KO cells. (b) Quantification of SubC fluorescence intensity colocalizing to LAMP1 (images shown in (a)). Representative plots from one experiment. In total three independent experiments were performed. Values are means ± SD. P-values were calculated by unpaired two-tailed Student’s T-test. (c) Representative immunocytochemical images of Gb3 labeling using ShTxB-Cy3 and LAMP1 in cell cycle arrested ARPE-19 WT and CLN3-KO cells. (d) Quantification of ShTxB-Cy3 fluorescence intensity colocalizing to LAMP1 (images shown in c) using data from one experiment. In total three independent experiments were performed. Values are means ± SD. P-values were calculated by unpaired two-tailed Student’s T-test. (e,f) Plots show the abundance of different glycerophosphodiesters: glycerophosphocholine (GPC), glycerophosphoethanolamine (GPE), glycerophosphoglycerol (GPG), glycerophosphoinositol (GPI), and glycerophosphoserine (GPS) in lysosomes purified using the lysoIP method (e) and in whole-cell lysates (f) of ARPE-19 WT and CLN3-KO cells with CCA. Plots summarize data from three independent experiments. P-values were calculated by individual unpaired two-tailed student’s t-test for each GPD. (g) Plot shows levels of different BMP species, detected in cell lysates of cell cycle arrested ARPE-19 WT and CLN3-KO cells using mass spectrometry. Values are means ± SD of three independent experiments. P-values were calculated by individual unpaired two-tailed Student’s t-test for each BMP species. ns nonsignificant < 0.1234.
Figure 2
Figure 2
Increased lysosomal number, size and area in CLN3-KO cells. (a) Representative electron microscopy images of cell cycle arrested ARPE-19 WT and CLN3-KO cells. (b) Plots show quantification of lysosomal number, size and total lysosomal area per cell from 16 electron microscopy images. Values are means ± SEM. Scale bar: 500 nm. P-values were calculated by unpaired two-tailed Student’s T-test.
Figure 3
Figure 3
TRPML1 expression and currents in WT and CLN3-KO cells. (a) Relative mRNA expression levels of TRPML1, normalized to Peptidyl-prolyl cis–trans isomerase B (PPIB) and WT DMSO treated cells without CCA. Cells were treated for 24 h with 30 µM ML-SA5, with and without cell cycle arrest (CCA). Values are means ± SD, n = 3 independent experiments. P-values calculated by two-way ANOVA coupled with multiple comparisons using Tukey test. (b) Scheme of lysosomal patch clamp technique, showing main buffer components. Note the pH difference between the lysosome pH(L) = 4.6 and the cellular surrounding pH(C) = 7.2. (c) Representative TRPML1 currents with agonist ML-SA1 and antagonist ML-SI3 treatment in cell cycle arrested ARPE-19 CLN3-KO cells, measured with whole endolysosomal patch clamp technique. (d) Plot shows current densities of lysosomes from ARPE-19 CLN3-KO cells under CCA isolated and patched in three independent experiments. P-values were calculated by one-way ANOVA coupled with multiple comparisons using Tukey test. (e) Representative TRPML1 currents with agonist ML-SA1 and antagonist ML-SI3 treatment of non-CCA ARPE-19 CLN3-KO cells, measured with whole endolysosomal patch clamp technique. (f) Plot shows current densities of four independently patched lysosomes from ARPE-19 CLN3-KO cells without cell cycle arrest. P-values were calculated by one-way ANOVA coupled with multiple comparisons using Tukey test.
Figure 4
Figure 4
TRPML1 activation ameliorates phenotypes of CLN3-KO cells. (a) Representative immunocytochemical images of SubC (green) and LAMP1 (magenta) in cell cycle arrested ARPE-19 WT and CLN3-KO cells. ML-SA5 was added for 48 h, 7 days after induction of CCA. Scale bar: 20 µm. (b,c) Quantification of immunocytochemical images shown in A (b) for SubC fluorescence intensity and (c) area of SubC-LAMP1 colocalization. Representative plots from one experiment. In total three independent experiments were performed. Values are means ± SD. (d) Representative immunocytochemical images of Gb3 labeling using ShTxB-Cy3 (yellow) and LAMP1 (magenta) in cell cycle arrested ARPE-19 WT and CLN3-KO cells. Cells were treated with ML-SA5 for 48 h, 7 days after induction of CCA. Scale bar: 20 µm. (e,f) Quantification of immunocytochemical images shown in d (e) for ShTxB-Cy3 fluorescence intensity and (f) area of ShTxB-Cy3-LAMP1 colocalization. Representative plots from one experiment. In total three independent experiments were performed. Values are means ± SD.(f) Representative electron microscopy images of ARPE-19 CLN3-KO cells under cell cycle arrest. Cells were treated with 10 µM ML-SA5 for 48 h, 7 days after induction of CCA. Scale bar: 500 nm. (g) Plots show quantification of total lysosome area per cell from 16 electron microscopy images. Values are means ± SEM. P-values calculated by two-way ANOVA coupled with multiple comparisons using Tukey test. ns nonsignificant < 0.1234.
Figure 5
Figure 5
Effect of TRPML1 activation on lysosomal GPD levels in WT and CLN3-KO cells. Plots show the fold change of the different GPD species in isolated lysosomes from ARPE-19 WT and CLN3-KO cells expressing the lysosomal tag 3xHA-TMEM192. Cells were under CCA and treated with 10 µM ML-SA5 for 90 min and 72 h. Values are means ± SD of three independent experiments. P-values were calculated by one-way ANOVA coupled with multiple comparisons using Tukey test. ns nonsignificant < 0.1234.
Figure 6
Figure 6
Effect of TRPML1 activation on TFEB expression and nuclear translocation and TFEB knockdown in WT and CLN3-KO cells. (a) Representative immunocytochemical images showing TFEB nuclear translocation after treatment of cell cycle arrested ARPE-19 WT and CLN3-KO cells for 2 h with 1 µM Torin1 and 30 µM ML-SA5. Scale bar: 20 µm. (b) Quantification of images shown in (a). Plot shows TFEB nuclear/cytosol ratio of one representative experiment. In total three independent experiments were performed. Values are means ± SD. (c) Immunoblot analysis of total cellular TFEB levels. Immunoblot images were cropped, original full-length blots are presented in supplementary Fig. S10a. Cell cycle arrested ARPE-19 WT and CLN3-KO were treated with mTORC-inhibitor Torin1 and TRPML1 agonist ML-SA5 for 2 h. Treatment leads to TFEB dephosphorylation and nuclear translocation, which is reflected by a size shift. (d) Relative mRNA expression levels of TFEB, normalized to PPIB and WT DMSO treated cells without CCA. Cells were treated for 24 h with 30 µM ML-SA5. Values shown are means ± SD, n = 3 independent experiments. (e,g) Representative immunocytochemical images of SubC (e) and Shigatoxin labeled Gb3 (g) after siRNA mediated knockdown of TFEB in CLN3-KO cells. Scale bar: 20 µm. (f,h) Quantification of images shown in E and G. Plots show SubC-LAMP1 (e) and ShTxB-Cy3-LAMP1 (g) area of colocalization of cell cycle arrested ARPE-19 cells with and without addition of TFEB siRNAs, followed by ML-SA5 treatment for 48 h. Representative plots from one experiment. In total three independent experiments were performed. Values are means ± SD. P-values were calculated by a two-way ANOVA coupled with multiple comparisons using Tukey test. ns nonsignificant < 0.1234.
Figure 7
Figure 7
Effect of TRPML1 activation on autophagy in WT and CLN3-KO cells. (a) Immunoblot analysis of LC3. Immunoblot images were cropped from the 45 min exposure time blot. Original full-length blots also with lower exposure time are presented in Fig. S10b. Cell cycle arrested ARPE-19 WT and CLN3-KO cells were treated for 30 min with 30 µM ML-SA5. (b) Quantification of LC3-II/(LC3-I + LC3-II) levels normalized to Vinculin, n = 6 independent experiments. (c) Relative mRNA expression of LC3 normalized to Peptidyl-prolyl cis–trans isomerase B (PPIB) and DMSO treated WT cells without CCA. Cell cycle arrested ARPE-19 cells were treated for 24 h with 30 µM ML-SA5. Values are means ± SD, n = 3 independent experiments. (d) Representative immunocytochemical images of LC3 and LAMP1 localization in cell cycle arrested ARPE-19 WT and CLN3-KO cells. Scale bar: 20 µm. (e,f) Plots represent the number of LC3 structures/cell (e) and LC3-LAMP1 colocalizing structures/per cell (f). Cells were treated with ML-SA5 for 30 min (d–f). Plots summarize data from one experiment. In total 3 independent experiments were performed. Values are means ± SD. ns nonsignificant < 0.1234.
Figure 8
Figure 8
Effect of TRPML1 activation on lysosomal exocytosis in WT and CLN3-KO cells. (a) Gating strategy used to identify LAMP1 positive cells by flow cytometry. (b,c) Exemplary flow cytometry plots in cell cycle arrested ARPE-19 WT (b) and CLN3-KO (c) cells. (d,e) Plots represent the percentage of cell cycle arrested ARPE-19 WT (d) and CLN3-KO (e) cells showing plasma membrane LAMP1 staining. For reference, cells were treated for 15 min with Ionomycin (Iono.). ML-SA5 treatment was performed for 90 min. Shown are individual values from single experiments ± SD of all experiments, n ranges from 3 to 6 independent experiments. ns nonsignificant < 0.1234.

References

    1. Cotman, S. L. & Staropoli, J. F. The juvenile Batten disease protein, CLN3, and its role in regulating anterograde and retrograde post-Golgi trafficking. Clin. Lipidol.7, 79–91 (2012). 10.2217/clp.11.70 - DOI - PMC - PubMed
    1. Lerner, T. J. et al. Isolation of a novel gene underlying batten disease, CLN3. Cell82, 949–957 (1995). 10.1016/0092-8674(95)90274-0 - DOI - PubMed
    1. Cárcel-Trullols, J., Kovács, A. D. & Pearce, D. A. Cell biology of the NCL proteins: What they do and don’t do. Biochim. Biophys. Acta Mol. Basis Dis.1852, 2242–2255 (2015).10.1016/j.bbadis.2015.04.027 - DOI - PubMed
    1. Mirza, M. et al. The CLN3 gene and protein: What we know. Mol. Genet. Genomic Med.7, 1–41 (2019).10.1002/mgg3.859 - DOI - PMC - PubMed
    1. Luiro, K., Yliannala, K., Ahtiainen, L., Maunu, H. & Ja, I. Interconnections of CLN3, Hook1 and Rab proteins link Batten disease to defects in the endocytic pathway. Hum. Mol. Genet.13, 3017–3027 (2004). 10.1093/hmg/ddh321 - DOI - PubMed

MeSH terms

Substances

LinkOut - more resources