. 2024 Sep;26(9):1585-1596.
doi: 10.1038/s41556-024-01473-0. Epub 2024 Jul 30.

mTORC2-driven chromatin cGAS mediates chemoresistance through epigenetic reprogramming in colorectal cancer

Affiliations

mTORC2-driven chromatin cGAS mediates chemoresistance through epigenetic reprogramming in colorectal cancer

Guoqing Lv et al. Nat Cell Biol. 2024 Sep.

Abstract

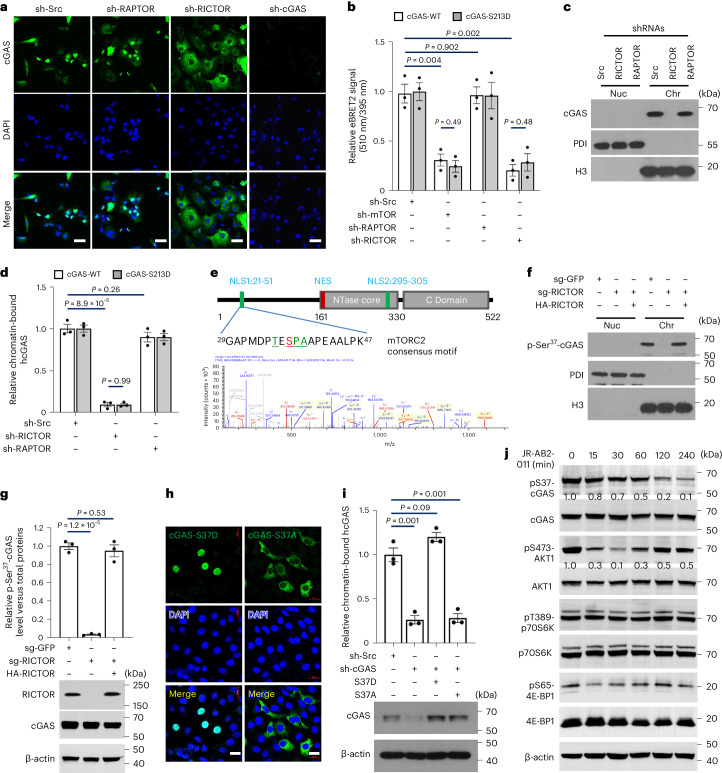
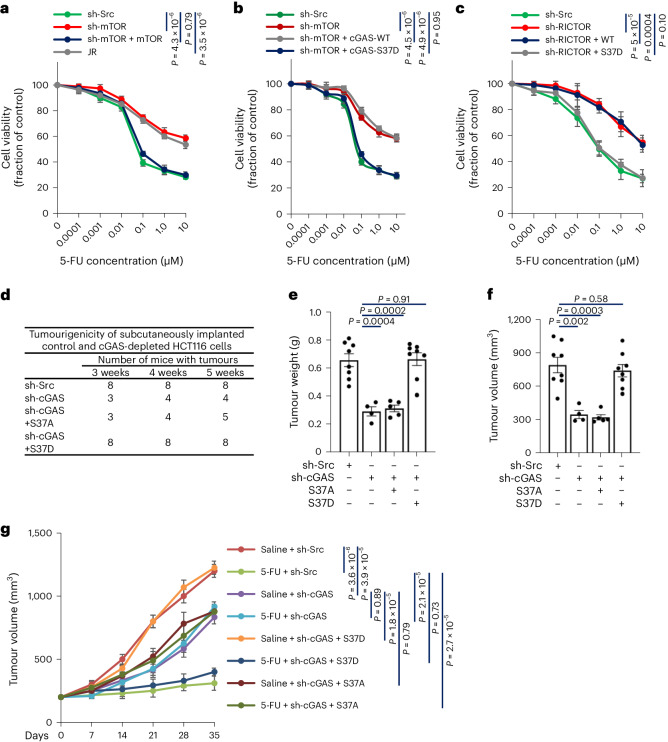
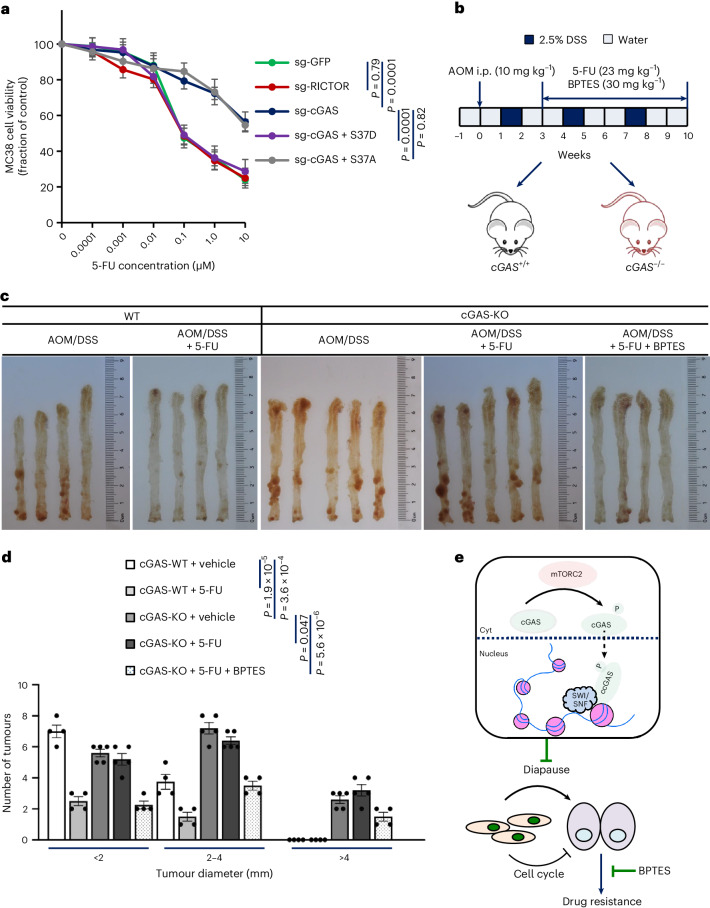
Cyclic GMP-AMP synthase (cGAS), a cytosolic DNA sensor that initiates a STING-dependent innate immune response, binds tightly to chromatin, where its catalytic activity is inhibited; however, mechanisms underlying cGAS recruitment to chromatin and functions of chromatin-bound cGAS (ccGAS) remain unclear. Here we show that mTORC2-mediated phosphorylation of human cGAS serine 37 promotes its chromatin localization in colorectal cancer cells, regulating cell growth and drug resistance independently of STING. We discovered that ccGAS recruits the SWI/SNF complex at specific chromatin regions, modifying expression of genes linked to glutaminolysis and DNA replication. Although ccGAS depletion inhibited cell growth, it induced chemoresistance to fluorouracil treatment in vitro and in vivo. Moreover, blocking kidney-type glutaminase, a downstream ccGAS target, overcame chemoresistance caused by ccGAS loss. Thus, ccGAS coordinates colorectal cancer plasticity and acquired chemoresistance through epigenetic patterning. Targeting both mTORC2-ccGAS and glutaminase provides a promising strategy to eliminate quiescent resistant cancer cells.


Conflict of interest statement

The authors declare no competing interests.

Figures

Fig. 1
Fig. 1. High-throughput screening identifies PI3K–mTOR pathway regulation of cGAS–chromatin localization.
a, Cell fractionation and ELISA were used to quantify cGAS protein levels in subcellular fractions of HCT116 cells. n = 5 independent experiments per group. b, A chromatin cGAS biosensor composed of pcDNA3.1(+)-GFP2-cGAS and pcDNA3.1(+)-Rluc8-H2A was generated. The eBRET2 signal ratios indicate cGAS–H2A interactions. c, The biosensor underwent high-throughput drug screening in HCT116 cells. Ratios of eBRET2 signals with drugs (Bioactive Compound Library) versus dimethylsulfoxide (DMSO) indicate effects on cGAS–chromatin interactions. d, HCT116 cells were treated with GDC-0941 for the times indicated, then soluble nuclear and chromatin fractions were analysed by immunoblot (IB) with the antibodies shown. e, Immunofluorescence analysis of cGAS subcellular distribution in HCT116 cells treated with PI3K–mTOR inhibitors (2 µM, 12 h). MK-2206, a highly selective AKT inhibitor; rapamycin, an allosteric mTORC1 inhibitor; PF-4708671, a p70 ribosomal S6 kinase inhibitor; Scale bars, 20 µm. f, HCT116 cells transfected with the biosensor were treated with 2 µM of the indicated compounds for 12 h, then eBRET2 signals were measured. Ratios of compounds versus control indicate effects on cGAS–chromatin interactions. n = 3 independent experiments per group. Data are shown as mean ± s.e.m. Unpaired two-tailed t-test. Experiments were repeated three times (d, e) or twice (c) with similar results. Numerical data and unprocessed blots are available as source data. Source data
Fig. 2
Fig. 2. mTORC2-mediated phosphorylation of cGAS at serine 37 promotes its chromatin localization.
a, Immunofluorescence analysis of HCT116 cells lentivirally infected with shRNA targeting the indicated genes or a scramble control (sh-Src). Nuclei were labelled with 4,6-diamidino-2-phenylindole (DAPI, blue). Scale bars, 20 µm. b, eBRET2 signal in HCT116 cells stably expressing the indicated shRNAs, reporting on cGAS–H2A interactions. c, Soluble nuclear (Nuc) and chromatin (Chr) fractions from HCT116 cells stably expressing the indicated shRNAs were collected for IB analysis with the antibodies shown. d, ELISA quantification of cGAS protein levels in chromatin fractions isolated using a Chromatin Extraction Kit from HCT116 cells stably expressing indicated shRNAs. hcGAS, human cGAS. e, In vitro LC–MS/MS phosphorylation assays identified recombinant cGAS serine 37 as a direct phosphorylation site of mTORC2. f, RICTOR knockout HCT116 cells were fractionated and immunoblotted. g, ELISA quantification of pSer37-cGAS levels in RICTOR knockout HCT116 cells stably expressing HA-RICTOR. h, Localization of mutant cGAS was assessed by immunofluorescence in cGAS-knockout HCT116 cells. Scale bars, 20 µm. i, ELISA quantification of cGAS protein levels in chromatin fractions from cGAS-knockdown HCT116 cells expressing shRNA-resistant cGAS mutants. j, STING−/− HCT116 cells were treated with 10 µM JR-AB2-011 for the times indicated, then whole-cell lysates (WCLs) were analysed by IB with the antibodies shown. Data are shown as mean ± s.e.m. from three independent experiments (b, d, g, i). Unpaired two-tailed t-test. Experiments were repeated three times (a, c, f) with similar results. Numerical data and unprocessed blots are available as source data. WT, wild type. Source data
Fig. 3
Fig. 3. ccGAS recruits SWI/SNF to regulate genes involved in DNA replication and glutaminolysis.
a, Functional enrichment (cell component) analysis of 33 unique cGAS-interacting intranuclear proteins. b, IB analysis of immunoprecipitation (IP) and WCLs derived from HCT116 cells. c, The cGAS CUT&Tag peaks were annotated by ChIPseeker, and 16.64% were found to be located on gene promoters. d, KEGG pathway analysis of promoter-localized cGAS peaks showed that these genes were closely related to cell cycle and amino acid metabolism. e, Functional enrichment analysis of 53 downregulated proteins under cGAS knockdown in HCT116 cells. f, Eighty-one proteins significantly altered in abundance under cGAS knockdown, of which 61 proteins,18 upregulated (orange) and 43 downregulated (blue), were annotated to 142 reliable protein–protein interactions (grey line) based on databases such as BioGrid and StringDB. Node size indicates the degree of altered abundance. g, ChIP–qPCR analysis of cGAS occupancy at the KGA promoter in HCT116 cells lentivirally infected with the indicated shRNAs. h, ChIP–qPCR analysis of ARID1A occupancy at the KGA promoter in cGAS-knockout HCT116 cells stably expressing control or cGAS mutants. i, HCT116 cells were treated with 2 µM GDC-0941 for the indicated times, mRNA levels of indicated genes were quantified by qPCR analysis and normalized to ACTB control and WCLs were analysed by IB. j, cGAS mutants were transfected into cGAS-knockout HCT116 cells and KGA mRNA levels and WCLs were analysed. Data are shown as mean ± s.e.m. from three independent experiments (gj). Unpaired two-tailed t-test. Experiments were repeated three times (b) with similar results. Numerical data and unprocessed blots are available as source data. Source data
Fig. 4
Fig. 4. ccGAS depletion induces a diapause-like state and chemoresistance in colorectal cancer cells.
a, Quantification data of cell cycle distribution for HCT116 cells are presented. shRNA-resistant cGAS mutants were transfected into HCT116 cells stably expressing cGAS shRNA. ADU-S100, an activator of STING, 10 µM. b, Representative images of colony formation assays showed the proliferative capacity of HCT116 cells stably expressing indicated cGAS mutants. c, Colony formation assays were quantified in HCT116 cells stably expressing indicated cGAS mutants. d, HCT116 cells stably expressing indicated cGAS mutants were measured for cell proliferation. e, The relative size of cGAS-knockout HCT116 cells with cGAS mutants restoration was calculated. n = 2 × 107 cells per group. f, HCT116 cells stably expressing cGAS shRNA were treated with the indicated concentrations of 5-FU and cell viability was assessed after 24 h. g, cGAS-knockdown HCT116 cells stably transfected cGAS or pretreated with 10 µM JR-AB2-011 for 6 h were treated with the indicated concentrations of 5-FU, and cell viability was assessed after 24 h. JR, JR-AB2-011, a selective mTORC2 inhibitor. h, HCT116 cells stably expressing indicated cGAS mutants were treated with the indicated concentrations of 5-FU and cell viability was assessed after 24 h. i, Colony formation assays were performed in HCT116 cells in the presence of 2 μM 5-FU in DMSO. j, HCT116 cells stably expressing indicated shRNAs were treated with the indicated concentrations of 5-FU and cell viability was assessed after 24 h. k, Cell viability assays measuring idarubicin response of THP-1 cells stably expressing indicated cGAS mutants. Data are shown as mean ± s.e.m. from three independent experiments. Unpaired two-tailed t-test (a, c, e, i) and Kruskal–Wallis one-way analysis of variance (ANOVA) followed by Dunn’s multiple comparison tests (d, fh, j, k). Experiments were repeated four times (b) with similar results. Numerical source data are available. Source data
Fig. 5
Fig. 5. mTORC2-driven ccGAS directs colorectal cancer plasticity and acquired chemoresistance in vivo.
a, mTOR-knockdown HCT116 cells stably transfected mTOR or pretreated with 10 µM JR-AB2-011 for 6 h were treated with the indicated concentrations of 5-FU, and cell viability was assessed after 24 h. b, mTOR-knockdown HCT116 cells stably expressing indicated cGAS mutants were treated with the indicated concentrations of 5-FU and cell viability was assessed after 24 h. c, RICTOR-knockdown HCT116 cells stably expressing indicated cGAS mutants were treated with the indicated concentrations of 5-FU and cell viability was assessed after 24 h. d, HCT116 cells lentivirally infected with indicated shRNAs or cGAS mutants were tested for tumour formation in nude mice (2 × 107 cells per mouse). n = 8 mice per group. e, Mice were killed after 5 weeks of xenotransplantation and tumour weight in each group was calculated. n (left to right) = 8, 4, 5, 8 mice. f, Mice were killed after 5 weeks of xenotransplantation and the tumour volume in each group was calculated. n (left to right) = 8, 4, 5, 8 mice. g, Mouse xenograft experiments using HCT116 cells stably expressing cGAS shRNA or cGAS mutants. When the tumour diameter reached 5 mm, 5-FU (23 mg kg−1, twice a week) was intraperitoneally injected for five consecutive weeks. Tumour growth curves were calculated. n = 5 mice per group. Data are shown as means ± s.e.m. from three independent experiments (ac). Unpaired two-tailed t-test (e, f) and Kruskal–Wallis one-way ANOVA followed by Dunn’s multiple comparison tests (ac, g). Numerical data are available as source data. Source data
Fig. 6
Fig. 6. KGA inhibition overcomes chemoresistance induced by disruption of mTORC2–ccGAS axis.
a, Mouse xenograft experiments were performed with HCT116 cells stably expressing cGAS shRNA. When the tumour diameter reached 5 mm, 5-FU (23 mg kg−1, twice a week) was intraperitoneally injected for five consecutive weeks. Tumour growth curves were calculated. n = 5 mice per group. b, HCT116 cells stably expressing cGAS shRNA were treated with 10 µM BPTES and the indicated concentrations of 5-FU and cell viability was assessed after 24 h. n = 3 independent experiments per group. c, HCT116 cells stably expressing the indicated shRNA or cGAS mutants were treated with 10 µM BPTES and the indicated concentrations of 5-FU and cell viability was assessed after 24 h. n = 3 independent experiments per group. d, Immunoblot analysis of WCLs derived from PDX models (RICTOR+/+ and RICTOR−/−). e, Immunohistochemical staining of patient-derived xenograft (PDX) models for the indicated proteins. f, qPCR analysis of indicated gene expression in RICTOR homozygous deletion PDX model normalized to ACTB. g, The PDX model was established with RICTOR homozygous deletion colorectal cancer. When the tumour reached 5 mm in diameter, intraperitoneal injection was performed using 5-FU (23 mg kg−1, twice per week) and BPTES (30 mg kg−1, twice per week) for 5 weeks. Tumour growth curves were calculated. n = 5 mice per group. Data are shown as mean ± s.e.m. Kruskal–Wallis one-way ANOVA followed by Dunn’s multiple comparison tests (ac, g) and unpaired two-tailed t-test (f). Experiments were repeated three times (d, e) with similar results. Numerical data and unprocessed blots are available as source data. Source data
Fig. 7
Fig. 7. Targeting KGA re-establishes chemotherapy sensitivity in tumours of cGAS-deficient mice.
a, MC38 cells stably expressing indicated hcGAS mutants were treated with the indicated concentrations of 5-FU and cell viability was assessed after 24 h. n = 3 independent experiments per group. b, The colitis-associated colorectal cancer model was established with AOM/DSS in cGAS-WT and knockout (KO) littermate mice. After 21 days of treatment, intraperitoneal injection (i.p.) was performed using 5-FU (23 mg kg−1, twice per week) and BPTES (30 mg kg−1, twice per week) for 7 weeks. c, Representative images of AOM/DSS-induced tumour in colon tissues demonstrating the number and location of colon tumours. d, The tumour number of AOM/DSS mice in each group was counted by macroscopic examination of colon tissue. n (left to right) = 4, 4, 5, 5 and 4 mice. e, mTORC2 phosphorylates cGAS to promote its chromatin localization and SWI/SNF recruitment to regulate target gene expression, thereby mediating plasticity and chemoresistance in colorectal cancer. Data are shown as mean ± s.e.m. Kruskal–Wallis one-way ANOVA followed by Dunn’s multiple comparison tests (a) and unpaired two-tailed t-test (d). Numerical data are available as source data. Source data
Extended Data Fig. 1
Extended Data Fig. 1. PI3K-mTOR pathway inhibition reduces cGAS chromatin localization.
a. Immunofluorescence analysis of cGAS localization (green) in HCT116 cells throughout the cell cycle as defined by DAPI staining (blue). Scale bar, 5 µm. b. Immunofluorescence analysis of subcellular localization of cGAS mutants versus wild-type in cGAS knockout HCT116 cells. Scale bar, 10 µm. c. eBRET2 signal measured the chromatin binding affinity of cGAS mutants versus wild-type, as indicated by the interaction between H2A-Rluc8 and cGAS-GFP following transfection into cGAS knockout HCT116 cells. d. SILAC proteomics identified cGAS and HELLS as proteins whose chromatin association is most sensitive to treatment with the PI3K inhibitor GDC-0941. The and Heavy (treated) and light (control) peptide signals are shown inyellow and blue, respectively. e. ELISA quantification of cGAS protein levels in different cell fractions from HCT116 cells treated with GDC-0941 for the indicated times. Fractionation was performed using ProteoExtract® Kit and Chromatin Extraction Kit. Data are means ± SEM of three independent experiments. Data are shown as means ± s.e.m. from three independent experiments (c, e). Unpaired two-tailed t-test. Experiments were repeated three times (a, b) with similar results. Numerical source data are available as source data.
Extended Data Fig. 2
Extended Data Fig. 2. mTORC2 induces cGAS chromatin localization.
a. Immunoblot analysis of whole-cell lysates (WCLs) from HCT116 cells treated with PI3K-mTOR pathway inhibitors (2 µM, 12 hours). b. Automated quantification of cGAS intensities in individual cell nuclei and cytosol from (B) using CellProfiler. Nuclear/cytosolic ratios are plotted as violin plots with mean for each condition. n = 50 from 3 independent experiments. Unpaired two-tailed t-test. c. Immunoblot analysis of whole cell lysates from HCT116 cells lentivirally infected with scrambled (sh-Src) or shRNAs targeting mTOR components. d. Immunofluorescence analysis and quantification cGAS subcellular distribution in HCT116 cells lentivirally infected with the scramble control or gene-targeted shRNAs. Nuclear/cytosolic ratios are plotted as violin plots with means for each condition. n = 50 from 3 independent experiments. Unpaired two-tailed t-test. e. Co-immunoprecipitation and immunoblot analysis of cGAS and mTORC2 component interaction in HCT116 cells. f. Co-immunoprecipitation of Myc-tagged cGAS mutants from HCT116 cells transfected with the indicated constructs. g. eBRET2 signal reporting the interaction between cGAS and SIN1 (mTORC2 component) in HCT116 cells expressing a GFP2-cGAS and Rluc8-SIN1 biosensor. Bars represent the means ± s.e.m. from three independent experiments. Unpaired two-tailed t-test. h. Schematic of the workflow establishing an in vitro cGAS phosphorylation system using purified mTORC2 complexes and AKT1 as a control substrate. i. Mass spectrometry analysis of in vitro cGAS phosphorylation by purified mTORC1 or mTORC2 complexes from starved (48 h) or insulin-stimulated (30 min with 100 nM insulin) HCT293T cells. Experiments were repeated three times (a, c, e, f, h) with similar results. Numerical source data and unprocessed blots are available as source data. Source data
Extended Data Fig. 3
Extended Data Fig. 3. mTORC2 induces cGAS phosphorylation at serine 37.
a. In vitro cGAS phosphorylation assays by means of LC–MS/MS showed that purified mTORC1 could not directly phosphorylate recombinant His-cGAS. b. Generation of a pSer37-cGAS polyclonal antibody by immunizing rabbits with a phosphorylated peptide antigen and affinity purifying the antibodies. The antigen sequence used for immunization was cGAS aa 29-47 (GAPMDPTES*PAAPEAALPK). S* stands for phosphorylated serine residue in these synthetic peptides. The antibodies were affinity purified using the antigen peptide column, but they were not counter selected on unmodified antigen. c. Dot blot analysis of antibody specificity using serial dilutions of phosphorylated and non-phosphorylated cGAS peptides. This experiment was performed three times with similar results. d. Correlation between cell lysate protein concentration and absorbance signal in a pSer37-cGAS ELISA using HCT116 and MC38 cell extracts, demonstrating cell type-specific expression. This experiment was performed three times with similar results. e. HCT116 cells were treated with GDC-0941 for times indicated, then WCLs were analysed by immunoblot (IB) with the antibodies shown. This experiment was performed three times with similar results. f. Purified mTORC2 or AKT1 was incubated with recombinant His-cGAS to establish in vitro cGAS phosphorylation system, and the phosphorylation sites were analysed by means of LC–MS/MS. g. In vitro cGAS phosphorylation assays by means of LC–MS/MS showed that purified AKT1, but not mTORC2, directly phosphorylated cGAS at serine 305 in vitro. Unprocessed blots are available as source data. Source data
Extended Data Fig. 4
Extended Data Fig. 4. Serine 37 phosphorylation promotes cGAS chromatin localization.
a. eBRET2 signal reporting on chromatin (H2A) binding of cGAS mutants following tansfection into cGAS knockout HCT116 cells. b. Immunofluorescence analysis of subcellular localization of cGAS S37A and S37D mutants re-expressed by lentiviral transduction in cGAS-knockout HCT116 cells. Scale bar, 20 µm. c. Immunofluorescence analysis of p-Ser37-cGAS (serine 37 phosphorylation) and H2A (chromatin marker) subcellular distribution in HCT116 cells. d. cGAS proteins were immunoprecipitation from extranuclear and intranuclear (chromatin-bound) fractions of HCT116 cells, and the phosphorylation sites were analysed by means of LC–MS/MS analysis. e. Immunofluorescence analysis of extranuclear versus intranuclear localization of cGAS S37D and S37A mutants re-expressed in cGAS-knockout HCT116 cells. f. Immunofluorescence analysis of cGAS S37D and S37A mutant localization in mitotic HCT116 cells, showing chromatin binding capacity. g. ELISA quantification of cGAS protein levels in chromatin fractions isolated using a Chromatin Extraction Kit from STING-/- HCT116 cells treated with 10 µM JR-AB2-011 for indicated times. h. eBRET2 signal measured the interaction between H2A-Rluc8 and cGAS-GFP in STING-/- HCT116 cells treated with 10 µM JR-AB2-011 for indicated times. Data are shown as means ± s.e.m. from three independent experiments (a, g, h). Unpaired two-tailed t-test. Experiments were repeated three times (b, c, e, f) with similar results. Numerical source data are available as source data. Source data
Extended Data Fig. 5
Extended Data Fig. 5. Interactome analysis identifies SWI/SNF complex recruitment by ccGAS.
a. Schematic of experimental workflow for identification of cGAS interacting proteins. ProteoExtract®Kit and Chromatin Extraction Kit were used to obtain proteins of intracellular and extracellular cell fractions, and then the interaction proteins of cGAS in different cell fractions were obtained by immunoprecipitation. cGAS interactome was analysed by means of LC–MS/MS. b. LC–MS/MS analysis detected the binding proteins of cGAS in different cell fractions, and the frequency distribution histogram described the signal distribution. By comparing with the control group, proteins that significantly interact with cGAS in cytoplasm and nucleus could be screened out. c. Gene Ontology enrichment of cGAS interacting proteins in the cytoplasm. d. PPI network of 102 nuclear cGAS interactors including 89 nodes and 451 interactions annotated from public databases. among which 6 are cGAS and their Direct interactors are highlighted in orange. e. Gene Ontology enrichment of cGAS interacting proteins in the nucleus. f. PPI network of 33 unique intranuclear cGAS interactors including 30 nodes and 95 interactions, showing enrichment for SWI/SNF complex components. g. Co-immunoprecipitation and immunoblot validation of ARID1A binding to indicated cGAS mutants. This experiment was performed three times with similar results. Statistics source data and unprocessed blots are available as source data. Source data
Extended Data Fig. 6
Extended Data Fig. 6. CUT&Tag profiling reveals genes regulated by ccGAS associated with cell cycle and amino acid metabolism.
a. Schematic of CUT&Tag workflow to map genomic cGAS binding sites. b. Spearman correlation heatmap comparing biological replicates. c. Scatter plot and correlation of peak calls between technical replicates, demonstrating reproducibility. d. Visualization of cGAS CUT&Tag signals on Chromosome 1. e. Metagene analysis showing cGAS CUT&Tag enrichment at transcription start sites (TSS). f. Genomic distribution of cGAS peaks in relation to essential genes with necessary for cell survival. g. Motif enrichment analysis within top 500 cGAS-bound regions sorted by signal intensity. h. KEGG pathway analysis of all cGAS CUT&Tag peaks. i. Visualization of cGAS CUT&Tag signals at the promoter of KGA (chr2: 191,792,416–191,830,270) and PTER (chr10: 16,401,685–16,456,017). j. Gene Ontology enrichment of genes with cGAS CUT&Tag peaks in promoter regions. Statistics source data are available as source data.
Extended Data Fig. 7
Extended Data Fig. 7. TMT proteomics identifies DNA replication proteins and kidney-type glutaminase regulated downstream of ccGAS.
a. Schematic of experrimental workflow for identification of ccGAS downstream proteins. Proteins from HCT116 cells lentivirally infected with the indicated shRNAs or cGAS-S37A mutants were labelled with TMT reagents and analysed by LC–MS/MS. b. Protein signal distribution after cGAS knockdown determined by tandem mass tag (TMT). c. After cGAS knockdown, 81 proteins with significant changes in abundance were quantitatively screened from 6523 proteins, of which 28 were upregulated (orange) and 53 were downregulated (blue). d. The interaction frequency of 81 proteins with significant changes in abundance was significantly higher than that of randomized controls. e. Gene Ontology enrichment of 53 downregulated proteins, associated with DNA replication. Statistics source data are available as source data.
Extended Data Fig. 8
Extended Data Fig. 8. ccGAS depletion regulates expression of the CDC45-MCM-GINS (CMG) complex and KGA.
a. Immunoblot analysis of whole cell lysates from HCT116 cells infected with cGAS shRNA or control lentiviruses. b. qPCR analysis of indicated gene expression normalized to ACTB in cGAS knockdown HCT116 cells. c. TMT proteomics quantification of KGA and GAC protein levels in cGAS knockdown HCT116 cells. d. Immunoblot analysis of WCL derived from cGAS-knockdown HCT116 cells infected with lentiviruses encoding shRNA-resistant cGAS. e. qPCR analysis of indicated gene expression in cGAS rescued knockdown HCT116 cells. f. Glutaminase activity assay of parental and cGAS knockout cells expressing cGAS mutants. g. ChIP–qPCR analysis of cGAS occupancy at KGA promoter in indicated HCT116 cells. h. ChIP–qPCR analysis of cGAS occupancy at the KGA promoter in cGAS knockout colorectal cancer cells stably expressing indicated cGAS mutants. i. Wild-type and S213D mutant cGAS were transfected into cGAS-knockout HCT116 cells, and KGA mRNA levels and chromatin-bound proteins were analysed. j. Contribution of glutamine to oxygen consumption in indicated cell lines analysed by Seahorse. Data are shown as means ± s.e.m. from three independent experiments (b, e–j). Unpaired two-tailed t-test. Experiments were repeated three times (a, d) with similar results. Numerical source data and unprocessed blots are available as source data. Source data
Extended Data Fig. 9
Extended Data Fig. 9. ccGAS depletion induces diapause-like state and chemoresistance in colorectal cancer cells.
(A) Flow cytometric analysis of cell cycle profiles in HCT116 cells lentivirally infected with the indicated shRNAs. (B) Quantification of cell cycle distributions in HCT116 cells lentivirally infected with the indicated shRNAs. (C) cGAS or STING was transfected into HCT116 cells stably expressing cGAS shRNA. Quantification of cell cycle distributions in cGAS knockdown HCT116 cells stably expressing cGAS, STING, or treated with STING activator ADU-S100 (10 µM). (D) cGAS-S37D/A mutants were transfected into cGAS-knockout HCT116 cells, the subcellular distribution of cGAS mutants was analysed by immunofluorescence, and the morphology of the corresponding cells was observed. (E) Immunofluorescence analysis of cell morphology in cGAS-knockout HCT116 cells with cGAS-S37D mutants restoration. F-actin stain used to label cytoskeleton. (F) Immunofluorescence analysis of cell morphology in cGAS-knockout HCT116 cells with cGAS-S37A mutants restoration. (G) Cell viability assays measuring 5-FU response in cGAS knockdown HCT116 cells stably expressing shRNA-resistant cGAS-S213D mutants or pretreated with 10 µM ADU-S100 for 6 hours. Data are shown as means ± s.e.m. from three independent experiments (b, c, g). Unpaired two-tailed t-test (b, c) and Kruskal–Wallis one-way ANOVA followed by Dunn’s multiple comparison tests (g). Experiments were repeated four times (d–f) with similar results. Numerical source data are available as source data. Source data
Extended Data Fig. 10
Extended Data Fig. 10. The ccGAS-KGA signalling axis is conserved in murine colorectal cancer cells.
a. CDKN1A mRNA levels were quantified by qPCR analysis and normalized to ACTB control in HCT116 cells stably expressing indicated shRNAs. b. Cell viability assays measuring 5-FU response in HCT116 cells stably transfected MLH1 or pretreated with 10 µM JR-AB2-011 for 6 hours. JR (JR-AB2-011), a selective mTORC2 inhibitor. c. qPCR analysis of indicated gene expression in HCT116 cells stably transfected MLH1. d. Colony formation assays measuring drug response of HT29 cells. e. Colony formation assays measuring drug response of SW480 cells. f. HCT116 cells stably expressing indicated shRNAs were treated with the indicated concentrations of 5-FU and cell viability was assessed after 24 hours. g. Glutaminase activity assay of PDX models (RICTOR+/+ and RICTOR−/−). h. ELISA quantification of cGAS protein levels in chromatin fractions isolated using a Chromatin Extraction Kit from MC38 cells stably expressing indicated shRNAs. i. Immunofluorescence analysis of human cGAS S37A or S37D mutant localization in MC38 cells. Scale bar, 10 µm. j. qPCR analysis of gene expression in indicated MC38 cells normalized to ACTB. k. Contribution of glutamine to oxygen consumption in the indicated MC38 cells analysed by Seahorse. Data are shown as means ± s.e.m. from three independent experiments (a–h, j, k). Unpaired two-tailed t-test (a, ce, g, h, j, k) and Kruskal–Wallis one-way ANOVA followed by Dunn’s multiple comparison tests (b, f). Experiments were repeated four times (i) with similar results. Numerical source data and unprocessed blots are available as source data. Source data

References

    1. Motwani, M., Pesiridis, S. & Fitzgerald, K. A. DNA sensing by the cGAS-STING pathway in health and disease. Nat. Rev. Genet.20, 657–674 (2019). 10.1038/s41576-019-0151-1 - DOI - PubMed
    1. Chen, C. & Xu, P. Cellular functions of cGAS-STING signaling. Trends Cell Biol.10.1016/j.tcb.2022.11.001 (2022). - PubMed
    1. Hopfner, K. P. & Hornung, V. Molecular mechanisms and cellular functions of cGAS-STING signalling. Nat. Rev. Mol. Cell Biol.21, 501–521 (2020). 10.1038/s41580-020-0244-x - DOI - PubMed
    1. Bordon, Y. Nuclear waste ignites cGAS. Nat. Rev. Immunol.17, 533 (2017). 10.1038/nri.2017.102 - DOI - PubMed
    1. Ng, K. W., Marshall, E. A., Bell, J. C. & Lam, W. L. cGAS-STING and cancer: dichotomous roles in tumor immunity and development. Trends Immunol.39, 44–54 (2018). 10.1016/j.it.2017.07.013 - DOI - PubMed

Publication types

MeSH terms