

Distinct alterations in probabilistic reversal learning across at-risk mental state, first episode psychosis and persistent schizophrenia
- PMID: 39080434
- PMCID: PMC11289106
- DOI: 10.1038/s41598-024-68004-7
Distinct alterations in probabilistic reversal learning across at-risk mental state, first episode psychosis and persistent schizophrenia
Abstract
We used a probabilistic reversal learning task to examine prediction error-driven belief updating in three clinical groups with psychosis or psychosis-like symptoms. Study 1 compared people with at-risk mental state and first episode psychosis (FEP) to matched controls. Study 2 compared people diagnosed with treatment-resistant schizophrenia (TRS) to matched controls. The design replicated our previous work showing ketamine-related perturbations in how meta-level confidence maintained behavioural policy. We applied the same computational modelling analysis here, in order to compare the pharmacological model to three groups at different stages of psychosis. Accuracy was reduced in FEP, reflecting increased tendencies to shift strategy following probabilistic errors. The TRS group also showed a greater tendency to shift choice strategies though accuracy levels were not significantly reduced. Applying the previously-used computational modelling approach, we observed that only the TRS group showed altered confidence-based modulation of responding, previously observed under ketamine administration. Overall, our behavioural findings demonstrated resemblance between clinical groups (FEP and TRS) and ketamine in terms of a reduction in stabilisation of responding in a noisy environment. The computational analysis suggested that TRS, but not FEP, replicates ketamine effects but we consider the computational findings preliminary given limitations in performance of the model.
© 2024. The Author(s).
Conflict of interest statement
PCF consults for Ninja Theory Limited and for Hooke London; GKM consults for IESO Digital Health. The authors report no other competing interests.
Figures
 ), interquartile range (
 ), and range (
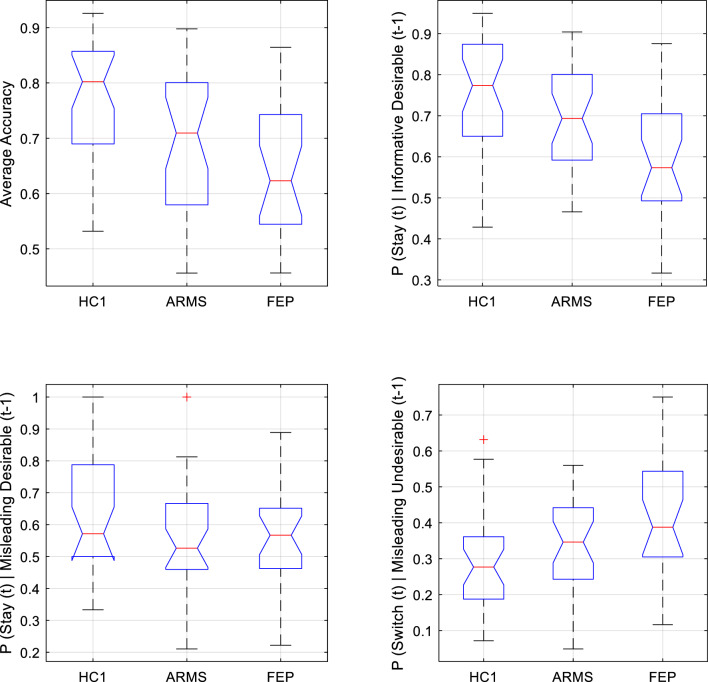
 ) of key behavioural outcomes from Study 1, plotted separately for Healthy Control (HC1), At-Risk Mental State (ARMS) and First Episode Psychosis (FEP) groups. Any outlying data points within a group are plotted individually (
 ). Top left Accuracy was significantly lower in FEP than HC1, and was lower at trend-level in ARMS than HC1. Top right Behavioural sensitivity to informative (high-probability) desirable feedback. The tendency to adaptively stay with an optimal strategy following desirable feedback was significantly lower in FEP than in both HC1 and ARMS groups (who did not significantly differ from one another in this regard). Bottom left Behavioural sensitivity to misleading (low-probability) desirable feedback did not differ between groups. Bottom right Behavioural sensitivity to misleading (low-probability) undesirable feedback. FEP participants were significantly more likely than HC1 participants to inappropriately ‘switch’ following low-probability undesirable feedback.
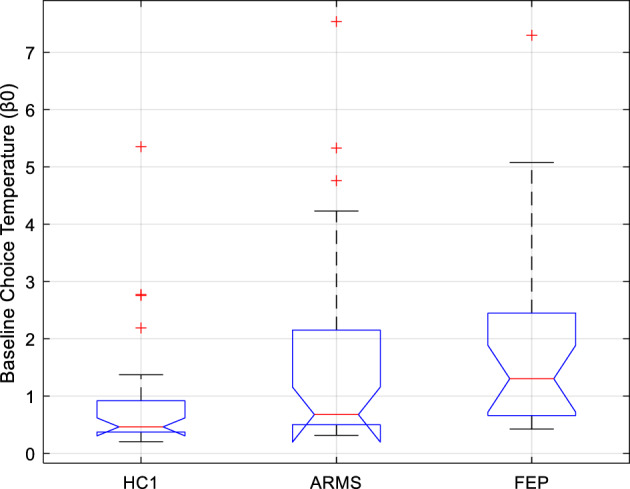
 ), interquartile range (
 ), and range (
 ) of Study 1 subjects’ baseline choice temperature free parameter (β0) under the winning computational model, plotted separately for Healthy Control (HC1), At-Risk Mental State (ARMS), and First Episode Psychosis (FEP) participants. Any outlying values of β0 within a group are plotted individually (
 ). Compared to the control group (HC1), there was a significant elevation of β0 in patients with FEP, and a trend-level tendency towards elevated β0 in patients with ARMS.
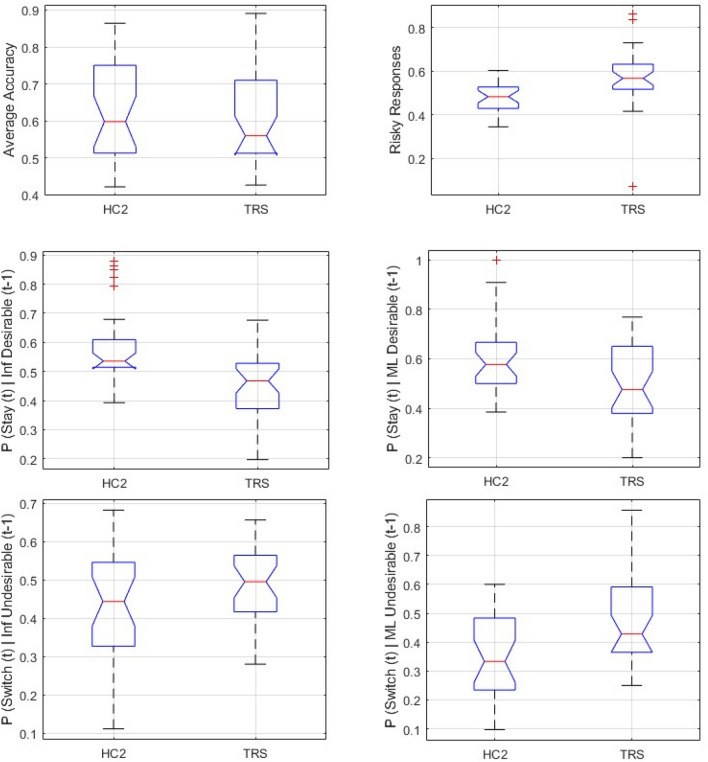
 ), interquartile range (
 ), and range (
 ) of key behavioural outcomes from Study 2, plotted separately for Healthy Control (HC2), and Treatment-Resistant Chronic Schizophrenia (TRS) groups. Any outlying data points within a group are plotted individually (
 ). Top left Average accuracy did not differ significantly between HC2 and TRS. Top right Average proportion of all responses that were ‘Risky’ was significantly higher in TRS than HC2. Middle Left Compared to controls, TRS is associated with significantly reduced tendency to adaptively stay with an optimal strategy following high-probability (Informative, ‘Inf’) desirable feedback to a correct response. Middle Right Compared to controls, TRS is associated with significantly reduced propensity to inappropriately stay with a suboptimal strategy following low-probability (Misleading, ‘ML’) desirable feedback to an incorrect response. Bottom Left Compared to controls, TRS is associated with significantly elevated tendency to adaptively switch away from a suboptimal strategy following informative (‘Inf’) undesirable feedback (left) to an incorrect response. Bottom Right Compared to controls, TRS is associated with significantly elevated propensity to inappropriately switch away from an optimal strategy following Misleading (‘ML’) undesirable feedback to a correct response.
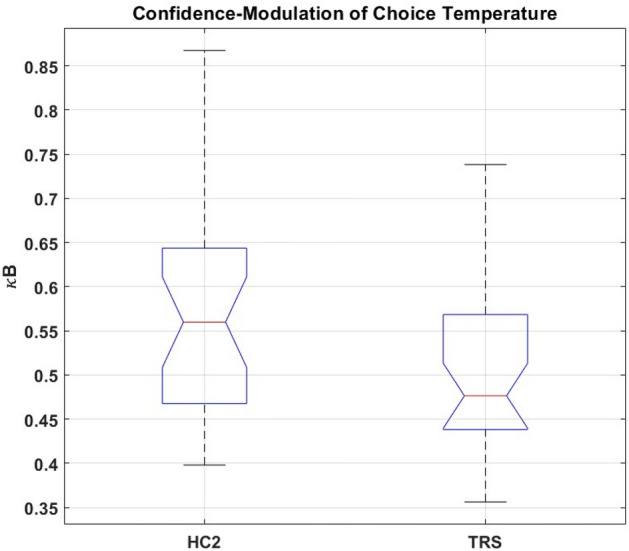
 ), interquartile range (
 ), and range (
 ) of Study 2 subjects’ values of κB (the free parameter corresponding to the weighting factor for trialwise confidence-modulation of choice temperature, under the winning computational model) plotted separately for Treatment-Resistant Chronic Schizophrenia (TRS) and Healthy Control (HC2) groups. Any outlying values of κB within a group are plotted individually (
 ). Average κB was significantly lower in TRS than HC2.
References
-
- Gray, J. A., Feldon, J., Rawlins, J. N. P., Hemsley, D. & Smith, A. D. The neuropsychology of schizophrenia. Behav. Brain Sci.14, 1–84 (1991).10.1017/S0140525X00065055 - DOI
MeSH terms
Substances
Grants and funding
LinkOut - more resources
Full Text Sources
Medical
