. 2024 Jul 30;14(1):17500.
doi: 10.1038/s41598-024-68555-9.

Reliability of brain metrics derived from a Time-Domain Functional Near-Infrared Spectroscopy System

Affiliations

Reliability of brain metrics derived from a Time-Domain Functional Near-Infrared Spectroscopy System

Julien Dubois et al. Sci Rep. .

Abstract

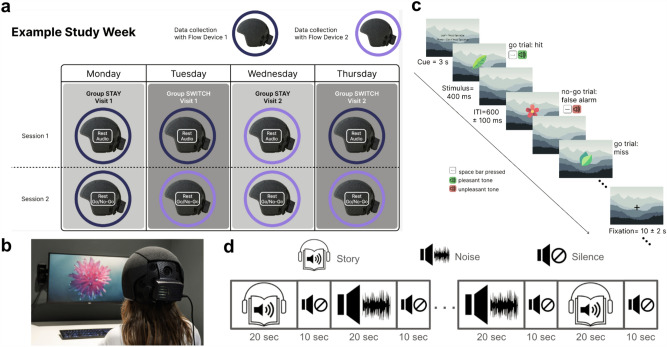
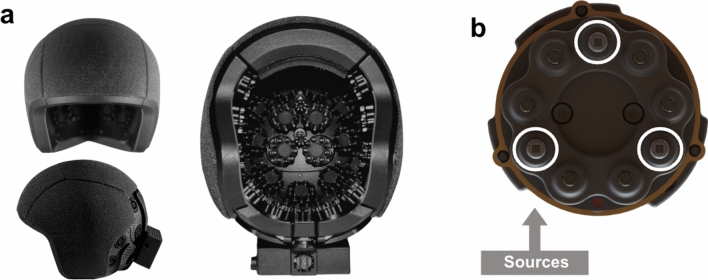
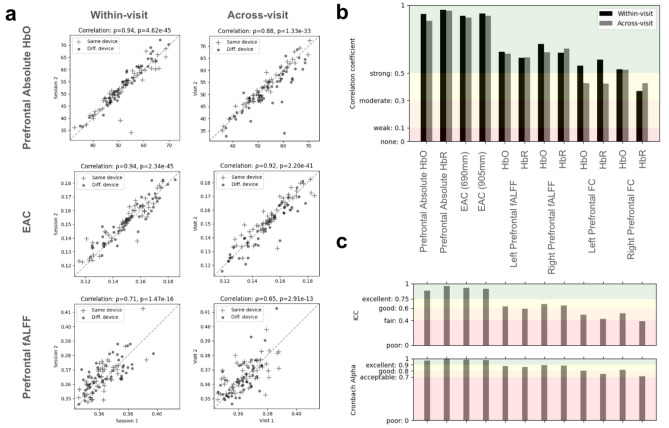
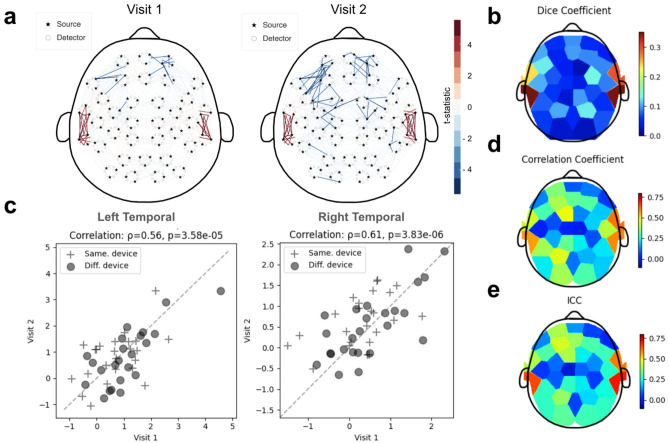
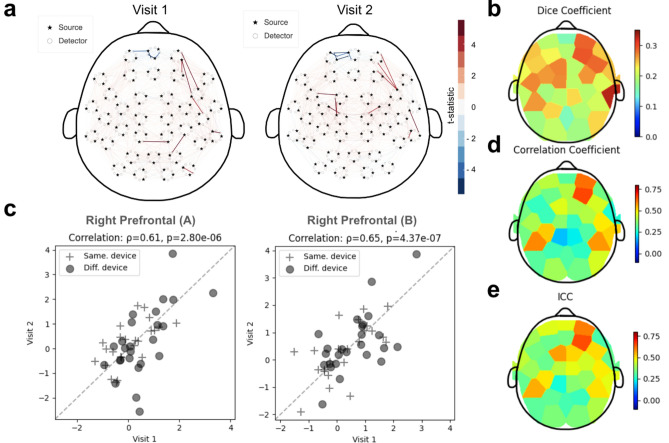
With the growing interest in establishing brain-based biomarkers for precision medicine, there is a need for noninvasive, scalable neuroimaging devices that yield valid and reliable metrics. Kernel's second-generation Flow2 Time-Domain Functional Near-Infrared Spectroscopy (TD-fNIRS) system meets the requirements of noninvasive and scalable neuroimaging, and uses a validated modality to measure brain function. In this work, we investigate the test-retest reliability (TRR) of a set of metrics derived from the Flow2 recordings. We adopted a repeated-measures design with 49 healthy participants, and quantified TRR over multiple time points and different headsets-in different experimental conditions including a resting state, a sensory, and a cognitive task. Results demonstrated high reliability in resting state features including hemoglobin concentrations, head tissue light attenuation, amplitude of low frequency fluctuations, and functional connectivity. Additionally, passive auditory and Go/No-Go inhibitory control tasks each exhibited similar activation patterns across days. Notably, areas with the highest reliability were in auditory regions during the auditory task, and right prefrontal regions during the Go/No-Go task, consistent with prior literature. This study underscores the reliability of Flow2-derived metrics, supporting its potential to actualize the vision of using brain-based biomarkers for diagnosis, treatment selection and treatment monitoring of neuropsychiatric and neurocognitive disorders.


Conflict of interest statement

All authors were employed by Kernel during this study.

Figures

Figure 1
Figure 1
Overview of study design and experiments. (a) Example schematic of a study week. Note that participants (either assigned to the group STAY or SWITCH) completed two study visits. Recordings during each visit were split into two parts: (1) resting state followed by a passive auditory task; and (2) resting state followed by a Go/No-go task. The headset was removed between these two stages. Different shades of purple denotes which headset was used for a given visit/session. (b) A model wearing the Flow2 headset while performing the resting state session, which consisted of watching a 7 min audiovisual segment. (c) Schematic of the Go/No-Go task structure. Shown are a few representative trials at the start of a go/no-go block. (d) Schematic of the passive auditory task with story and noise blocks (20 s each) and 10 s of silence in between each block.
Figure 2
Figure 2
Kernel Flow2, second-generation Kernel whole-head TD-fNIRS system. (a) Schematic of front, side and inside view of the Flow2 headset. Note the individual modules located throughout the headset thus providing whole-head coverage. (b) Schematic of a module, which consists of 3 sources (marked by white circles) and 6 detectors.
Figure 3
Figure 3
Various features revealed within-visit and across-visit reliability during resting state sessions. (a) Different representative resting state features (each row) were highly correlated between two sessions within a given visit (i.e. between visit1session1 and visit1session2; and between between visit2session1 and visit2session2; left column; within-visit) and across visits (i.e. between visit1session1 and visit2session1; and between visit1session2 and visit2session2; right column; across-visit). The three shown features are the absolute HbO [µM] in the prefrontal region, EAC of the 905 nm wavelength, and fALFF within the right prefrontal region HbO. Note that in addition to the high correlation coefficients, the values lie very close to the diagonal line (dashed line) indicating the similarity of the values. (b) Within- and across-visit reliability (black and gray vertical bars respectively) as measured by the Spearman correlation coefficient between different visits/sessions, as described in (a), are shown for all resting state features. The colored background segments correspond to the commonly-used thresholds for the strength of correlation. (c) Reliability of features across all four resting state sessions were computed using ICC (top) and Cronbach alpha (bottom). Colored segments depict different reliability thresholds as commonly used in the literature.
Figure 4
Figure 4
Activations in the auditory cortex during the passive auditory task were reliable across study visits. (a) Group-level GLMs for the story condition during visit 1 (left) and visit 2 (right) were qualitatively similar as evidenced by the t-statistics from a one-sample t-test. Here, for each channel (each line) GLM beta values from all participants were compared against zero. Only channels that were significantly different from zero (p < 0.05; corrected) are shown. (b) The group-level dice coefficient (a measure of channel-level reliability) was computed as the average dice coefficient of all participants for each module (each color patch). Note the patches with higher values (> 0.3) in the auditory cortex areas. (c) For each participant (each marker), the average GLM test statistics for each module was calculated and compared between two recordings (i.e. visit 2 GLM test statistics versus visit 1 GLM test statistics). Two representative modules in bilateral auditory regions showed strong and significant correlations (Spearman) between the two visits. (d, e) Correlation coefficients (Spearman ⍴) (d) and ICC values (e) computed to measure stability of GLM test statistics (across time) are shown for each module (each color patch). Note how the reliability as measured by dice coefficient (b), correlation coefficient (d) and ICC (e) exhibit consistent patterns, with the left and right auditory areas showing the highest reliability (bluer patches indicate lower reliability and redder patches indicate higher reliability). Results shown here are all computed over the story condition of the task.
Figure 5
Figure 5
Reliability of the right prefrontal regions was observed in a Go/No-Go inhibitory control task. (a) Shown are the t-statistics from a one-sample t-test on channel-wise GLM beta values for each participant, for the contrast go/no-go. These group-level GLMs showed similarity in brain activation patterns during the task between visit 1 (left) and visit 2 (right). Only channels that were significantly different from zero (p < 0.05; corrected) are shown. (b) The dice coefficient of all participants were averaged for each module to obtain the group-level dice coefficient (a measure of channel-level reliability). Each patch represents a module. Note the presence of patches with higher values in the following areas: right prefrontal, right auditory, and left auditory/motor. (c) Two representative modules in the right prefrontal region showed strong and significant correlations (Spearman) between the two visits. Each marker represents the average GLM test statistics for each module for a given participant compared between two recordings (i.e. visit 2 GLM test statistics versus visit 1 GLM test statistics). (d, e) Module-level reliability of GLM test statistics (across time) is shown using correlation coefficient (Spearman ⍴) (d) and ICC values (e). Each color patch represents a module. Several regions, and primarily the right prefrontal region, showed high reliability consistently across all three measures of reliability (b, d, e). Results shown here are all computed over the go/no-go condition of the task. In all heatmaps bluer patches indicate lower reliability and redder patches indicate higher reliability.

Similar articles

Cited by

  • A compact time-domain diffuse optical tomography system for cortical neuroimaging.
    Chekin Y, Decker D, Dehghani H, Dubois J, Field RM, Gopalakrishnan V, Koch EM, Lerner G, Aghajan ZM, Miller N, Olvera I, Patel MJ, Perdue KL, Schmidt J, Szczepanski V. Chekin Y, et al. Imaging Neurosci (Camb). 2025 Feb 20;3:imag_a_00475. doi: 10.1162/imag_a_00475. eCollection 2025. Imaging Neurosci (Camb). 2025. PMID: 40800861 Free PMC article.

References

    1. Camp, C. C., Noble, S., Scheinost, D., Stringaris, A. & Nielson, D. M. Test-retest reliability of functional connectivity in adolescents with depression. Biol. Psychiatry Cogn. Neurosci. Neuroimaging9, 21–29 (2024). - PMC - PubMed
    1. Compère, L., Siegle, G. J. & Young, K. Importance of test–retest reliability for promoting fMRI based screening and interventions in major depressive disorder. Transl. Psychiatry11, 387 (2021). 10.1038/s41398-021-01507-3 - DOI - PMC - PubMed
    1. Dubois, J. & Adolphs, R. Building a science of individual differences from fMRI. Trends Cogn. Sci.20, 425–443 (2016). 10.1016/j.tics.2016.03.014 - DOI - PMC - PubMed
    1. Atri, A. et al. Test-retest reliability of memory task functional magnetic resonance imaging in Alzheimer disease clinical trials. Arch. Neurol.10.1001/archneurol.2011.94 (2011). 10.1001/archneurol.2011.94 - DOI - PMC - PubMed
    1. Paek, E. J., Murray, L. L., Newman, S. D. & Kim, D.-J. Test-retest reliability in an fMRI study of naming in dementia. Brain Language191, 31–45 (2019). 10.1016/j.bandl.2019.02.002 - DOI - PubMed

LinkOut - more resources