. 2024 Sep;25(9):1692-1703.
doi: 10.1038/s41590-024-01916-8. Epub 2024 Jul 30.

A unique serum IgG glycosylation signature predicts development of Crohn's disease and is associated with pathogenic antibodies to mannose glycan

Affiliations

A unique serum IgG glycosylation signature predicts development of Crohn's disease and is associated with pathogenic antibodies to mannose glycan

Joana Gaifem et al. Nat Immunol. 2024 Sep.

Abstract

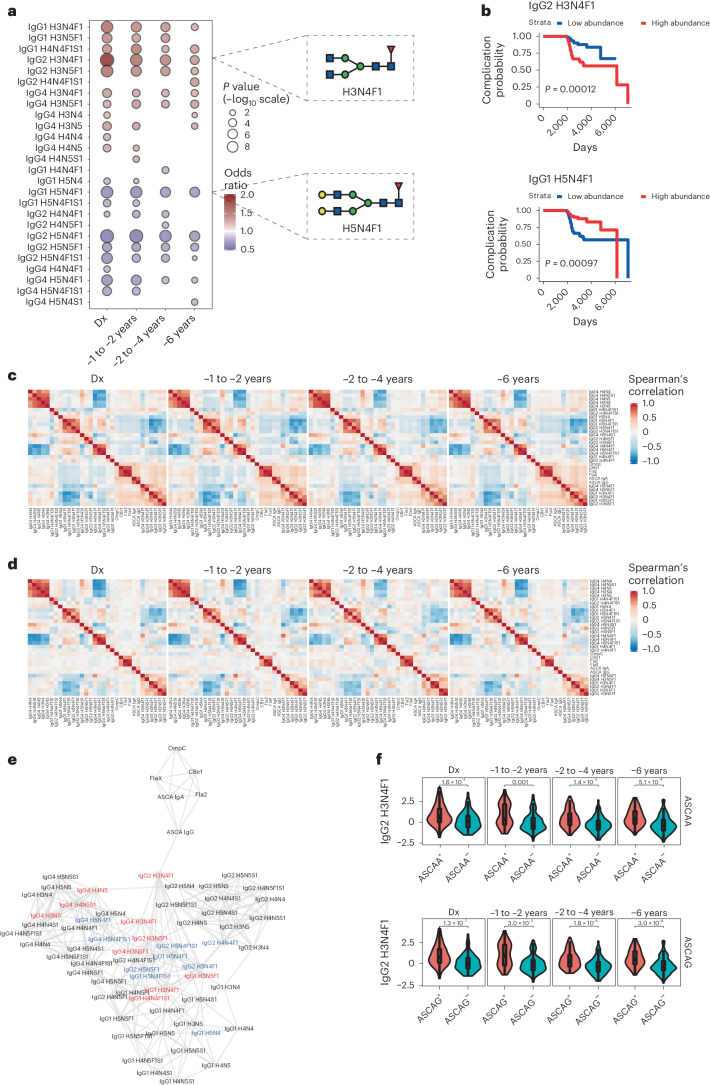
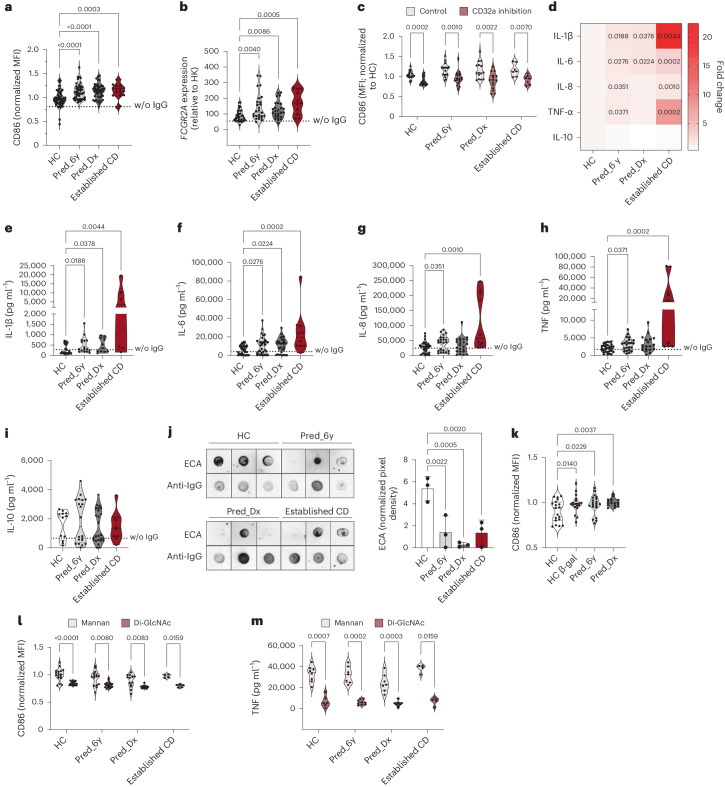
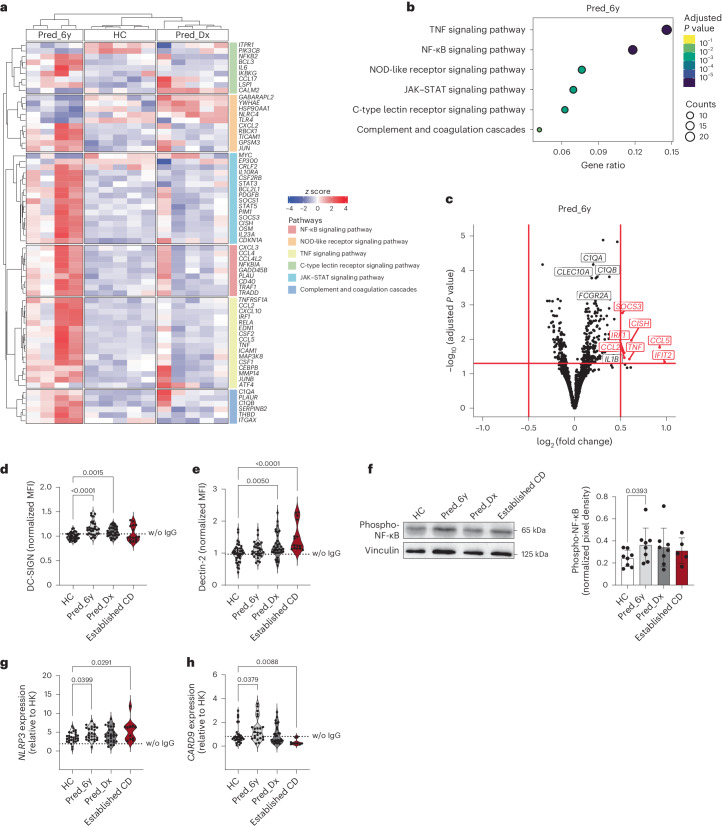
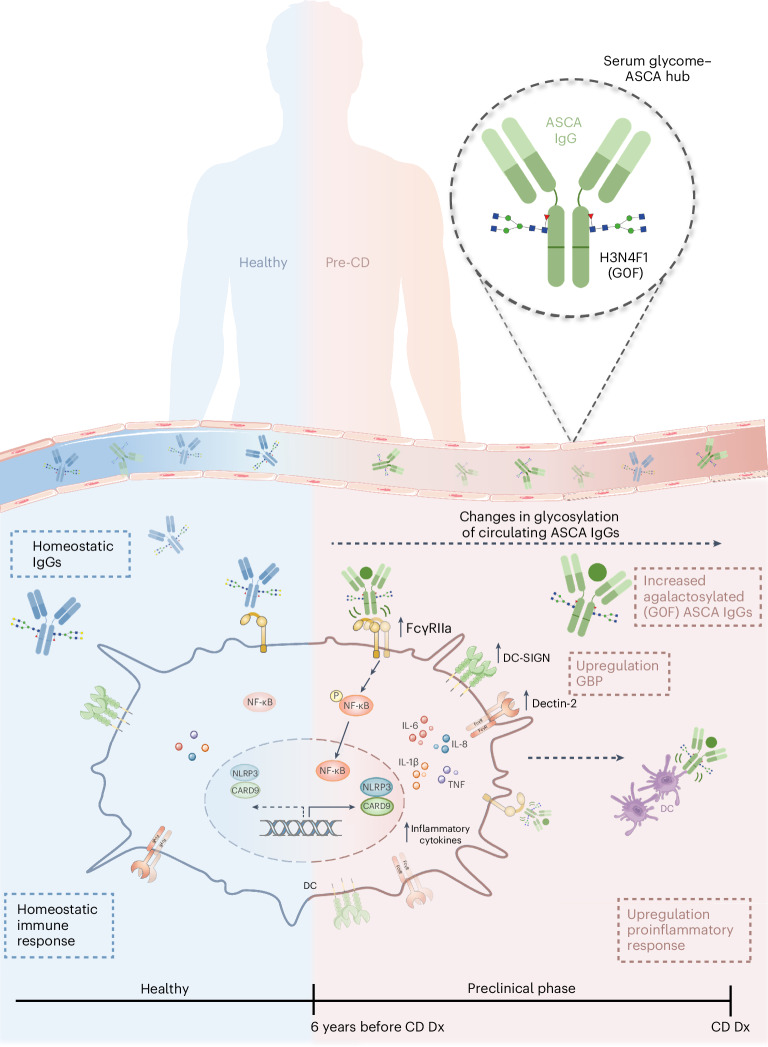
Inflammatory bowel disease (IBD) is characterized by chronic inflammation in the gut. There is growing evidence in Crohn's disease (CD) of the existence of a preclinical period characterized by immunological changes preceding symptom onset that starts years before diagnosis. Gaining insight into this preclinical phase will allow disease prediction and prevention. Analysis of preclinical serum samples, up to 6 years before IBD diagnosis (from the PREDICTS cohort), revealed the identification of a unique glycosylation signature on circulating antibodies (IgGs) characterized by lower galactosylation levels of the IgG fragment crystallizable (Fc) domain that remained stable until disease diagnosis. This specific IgG2 Fc glycan trait correlated with increased levels of antimicrobial antibodies, specifically anti-Saccharomyces cerevisiae (ASCA), pinpointing a glycome-ASCA hub detected in serum that predates by years the development of CD. Mechanistically, we demonstrated that this agalactosylated glycoform of ASCA IgG, detected in the preclinical phase, elicits a proinflammatory immune pathway through the activation and reprogramming of innate immune cells, such as dendritic cells and natural killer cells, via an FcγR-dependent mechanism, triggering NF-κB and CARD9 signaling and leading to inflammasome activation. This proinflammatory role of ASCA was demonstrated to be dependent on mannose glycan recognition and galactosylation levels in the IgG Fc domain. The pathogenic properties of (anti-mannose) ASCA IgG were validated in vivo. Adoptive transfer of antibodies to mannan (ASCA) to recipient wild-type mice resulted in increased susceptibility to intestinal inflammation that was recovered in recipient FcγR-deficient mice. Here we identify a glycosylation signature in circulating IgGs that precedes CD onset and pinpoint a specific glycome-ASCA pathway as a central player in the initiation of inflammation many years before CD diagnosis. This pathogenic glyco-hub may constitute a promising new serum biomarker for CD prediction and a potential target for disease prevention.


Conflict of interest statement

G.L. is the founder and owner of Genos, Ltd., a private research organization that specializes in high-throughput glycomic analysis, and has several patents in this field. M.N. and J.Š. are employees of Genos, Ltd. The other authors declare no competing interests.

Figures

Fig. 1
Fig. 1. Alterations in IgG Fc glycosylation precede CD development and are associated with complicated disease.
a, Total IgGs from serum samples from n = 251 individuals with CD and n = 250 HC individuals at different time points (preclinical phase: 1–2, 4–6 and 6 years before CD diagnosis and at CD diagnosis matched for HCs) were isolated and analyzed by mass spectrometry. The association between glycan traits measured at different time points and CD onset is shown. The size of the bubble corresponds to the P value from two-sided t-tests from a logistic regression model (–log10 scale) after adjusting for sex, race and age, whereas bubble color corresponds to odds ratio. Only associations significant at a 10% false discovery rate are reported. b, Association between different glycan traits and the development of CD complications (depicted as days to CD complication development) assessed by Kaplan–Meier analysis. P values from two-sided log-rank tests are reported. c, Spearman’s correlations between serologic markers and glycan traits associated with CD onset. Correlations are reported considering only individuals with CD for different time points before diagnosis. d, Spearman’s correlations between serologic markers and glycan traits associated with CD onset. Correlations are reported considering only HC individuals for different time points before diagnosis. e, Estimated coexpression networks based on individuals with CD capturing the association between glycan traits and serologic markers. f, Box plot of IgG2 H3N4F1 stratified by ASCA IgA (ASCAA) and ASCA IgG (ASCAG) positivity for individuals with CD for different time points before diagnosis. The number of individuals with CD in f for each time point is 200 at diagnosis (Dx), 116 at –1 to –2 years, 165 at –2 to –4 years and 201 at –6 years before diagnosis. In the box plot, the bottom and top hinges correspond to the first and third quartiles (the 25th and 75th percentiles), with median levels represented by a horizontal line. The top (bottom) whisker extends from the hinge to the largest (smallest) value no farther than 1.5× interquartile range from the hinge. Data beyond the end of the whiskers are defined as outliers and are plotted individually. P values from two-sided t-tests are reported. Source data
Fig. 2
Fig. 2. ASCAs generated years before CD diagnosis can trigger proinflammatory immune responses.
a, DCs incubated with ASCAs from preclinical individuals (Pred_6y, n = 44) and individuals diagnosed with CD (Pred_Dx, n = 44; established CD (full-blown), n = 18) displayed increased CD86 expression (data are normalized to HC individuals; HC, n = 62); MFI, mean fluorescence intensity; w/o, without. b, FCGR2A expression is also increased in DCs incubated with ASCAs from preclinical individuals (Pred_6y, n = 26) and individuals diagnosed with CD (Pred_Dx, n = 26; established CD, n = 11) compared to HC individuals (n = 34). FCGR2A expression is shown normalized to the expression of the housekeeping (HK) gene 18S. c, CD86 expression on DCs was decreased after blockade of FcγRIIa (data are normalized to that of HC individuals; control: HC n = 17, Pred_6y n = 17, Pred_Dx n = 15, established CD n = 7; with CD32a inhibition: HC n = 16, Pred_6y n = 17, Pred_Dx n = 15, established CD n = 7). di, ASCAs from individuals before and after diagnosis of CD promoted a distinct proinflammatory profile on DCs compared to ASCAs from HC individuals (n = 6–36 per group). Data in d corresponds to the fold change compared to HC. Data in e show HC (n = 23), Pred_6y (n = 16), Pred_Dx (n = 11) and established CD (n = 6). Data in f show HC (n = 35), Pred_6y (n = 33), Pred_Dx (n = 29) and established CD (n = 10). Data in g show HC (n = 36), Pred_6y (n = 23), Pred_Dx (n = 23) and established CD (n = 10). Data in h show HC (n = 31), Pred_6y (n = 23), Pred_Dx (n = 19) and established CD (n = 9). Data in i show HC (n = 12), Pred_6y (n = 20), Pred_Dx (n = 25) and established CD (n = 10). j, ASCAs from individuals before and after diagnosis with CD show decreased galactosylation (by ECA reactivity) compared to ASCAs from HC individuals (n = 3 per group; independent replicates). k, Ablation of galactose residues on IgGs from HC individuals (HC β-gal; n = 19) leads to increased CD86 expression similar to that imposed by ASCAs from individuals with CD (normalized to HC; HC, n = 19; Pred_6y, n = 20; Pred_Dx, n = 17). l, CD86 expression on DCs is lower when in contact with di-GlcNAc-specific IgGs than ASCAs (normalized to HC mannan; mannan: HC n = 17, Pred_6y n = 15, Pred_Dx n = 13, established CD n = 4; di-GlcNAc: HC n = 17, Pred_6y n = 17, Pred_Dx n = 12, established CD n = 5). m, DCs cocultured with di-GlcNAc-specific IgGs also display a decrease in TNF production (mannan: HC n = 8, Pred_6y n = 7, Pred_Dx n = 7, established CD n = 4; di-GlcNAc: HC n = 6, Pred_6y n = 9, Pred_Dx n = 8, established CD n = 5). Data in c, l and m were analyzed comparing treatments within each group by Mann–Whitney t‐test. Data in j and k were analyzed comparing each condition with the control (HC) by one-way analysis of variance with an uncorrected Fisher’s least significant difference test. Data on the remaining graphs were analyzed comparing each condition with the control (HC) by Kruskal–Wallis test with an uncorrected Dunn’s test. P values are shown in the graphs. Each data point represents the data from a single individual (biological replicates). Source data
Fig. 3
Fig. 3. ASCA Fc glycoforms from individuals before CD diagnosis shape the expression of proinflammatory signaling pathways and glycan-binding proteins in DCs, leading to NLRP3 and CARD9 expression.
a, Heat map of the relative expression values (z score of each gene across samples) for the top six upregulated KEGG pathways found in DCs cocultured with ASCA IgGs from individuals at the preclinical phase (Pred_6y, n = 4) versus ASCA IgGs from HC individuals (n = 5). In addition to Pred_6y and HC individuals, the heat map also shows the expression of these genes in DCs cultured with ASCA IgGs from individuals at diagnosis (Pred_Dx, n = 5). Only differentially expressed genes are shown, excluding genes belonging to more than one pathway. b, Dot plot of the overrepresentation analysis (KEGG ontology) for Pred_6y versus HC. The plot represents the top six enriched pathways (false discovery rate < 0.05), excluding human disease pathways. The diameter of the dot indicates the number of upregulated genes (false discovery rate < 0.05) belonging to the pathway. The color code indicates the adjusted P value for the pathway. Overrepresentation uses a hypergeometric test corrected for multiple testing using the Benjamini–Hochberg method to determine the statistical significance of the upregulated differentially expressed genes in each Gene Ontology term. c, Volcano plot depicting differentially expressed genes in DCs cocultured with ASCAs from Pred_6y (n = 4) versus HC (n = 5) individuals. Red dots represent genes expressed at higher levels in Pred_6y individuals. Black dots represent genes below the cutoff of significance (| log2 (fold change) | ≥ 0.5 and adjusted P values of ≤0.05). DESeq2 uses negative binomial generalized linear models for the differential analysis of count data and the Wald test with multiple correction (Benjamini–Hochberg method) for significance testing. The log2 (fold change) values were shrunken with the apeglm method to increase the signal-over-noise ratio of the effect size. d, ASCAs from preclinical (Pred_6y, n = 30) and at-diagnosis CD samples (Pred_Dx, n = 30; established CD, n = 16) can induce the surface expression of DC-SIGN on DCs (HC, n = 36). e, DCs display increased expression of dectin-2 after incubation with ASCAs from individuals with CD (Pred_Dx, n = 35; established CD, n = 15; HC, n = 43); no major alterations were found for Pred_6y (n = 31). f, DCs cultured with ASCAs from preclinical samples show increased expression of phospho-NF-κB (HC, n = 8; Pred_6y, n = 8; Pred_Dx, n = 8; established CD, n = 5; independent replicates). g, ASCAs from preclinical individuals and individuals with established CD promoted the upregulation of NLRP3 expression in DCs (HC, n = 29; Pred_6y, n = 26; Pred_Dx, n = 30; established CD, n = 11). h, Similar profiles were found for CARD9 expression (HC, n = 29; Pred_6y, n = 23; Pred_Dx, n = 29; established CD, n = 9). Data are presented as mean ± s.d. and were analyzed comparing each condition to the control (HC). Data presented in f were analyzed by paired one-way ANOVA with uncorrected Fisher’s least significant difference test compared to HC and are shown as mean ± s.d.; data on the remaining graphs were analyzed by a Kruskal–Wallis test with an uncorrected Dunn’s test. P values are shown in the graphs. Each data point represents the data from a single individual (biological replicates). Source data
Fig. 4
Fig. 4. Antibodies to mannan impose an increased susceptibility to colitis in mice.
a, WT mice were inoculated subcutaneously with mannan to promote the generation of antibodies to mannan (ASCA-like). Control mice were injected with PBS. Total IgGs were collected from both groups, and recipient mice were inoculated twice with 100 µg of total IgGs (ASCA enriched or from PBS-injected mice (control)), while colitis was chemically induced by administration of 2% DSS in drinking water; i.p., intraperitoneal. b, Mice inoculated with ASCA IgGs (n = 6) display increased susceptibility to colitis by showing increased DAI compared to PBS IgG-inoculated mice (n = 6). Data are presented as mean ± s.e.m. c, ASCA IgG-inoculated mice (n = 6) also display shortening of the colon compared to control animals (n = 5). d, ASCA-inoculated mice (n = 6) display increased frequencies of MHC class II+ cells in the colonic tissue after the induction of colitis compared to control animals (n = 6). e, BMDCs from WT mice were cocultured with mannan-specific IgGs (mouse ASCA IgGs; n = 4) or nonspecific IgGs (mouse PBS IgGs; n = 4), and MHC class II expression (activation) was assessed by fluorescence-activated cell sorting (FACS). f, FcγR-KO mice inoculated with ASCA IgGs (n = 4) showed decreased susceptibility to colitis compared to WT mice (n = 4). Data are presented as mean ± s.e.m. g, FcγR-KO mice (n = 4) displayed decreased levels of IL-1β in the supernatants of colonic explants compared to WT mice (n = 3). Scatter dot plots are presented as mean ± s.d. Data presented in b and f were analyzed by two-way ANOVA with a Šídák’s post-test, data presented in c were analyzed by two-tailed Mann–Whitney test, and data in the remaining graphs were analyzed by two-tailed unpaired t-test. P values are shown in the graphs. In e, each data point represents a technical replicate. For the remaining figures, each data point represents the data from a single individual (biological replicates). Source data
Fig. 5
Fig. 5. ASCA agalactosylation precedes CD development, contributing to the initial steps of intestinal inflammation.
Alterations in IgG Fc glycosylation were found up to 6 years before CD diagnosis. This altered glycosignature (IgG2 H3N4F1; G0F) was identified as significantly associated with antimicrobial antibodies, in particular ASCAs. These antibodies to mannan, even those from years before diagnosis, also contribute to intestinal inflammation by shaping the profile of immune cells toward proinflammation. ASCAs were also demonstrated to modulate the expression of glycan-binding proteins (GBP) on the surface of DCs. Moreover, these antimicrobial antibodies found 6 years before diagnosis induced phosphorylation of NF-κB, as well as the expression of NLRP3 and CARD9. This work identified a new biomarker for CD prediction, as this altered glycoform of IgG Fc is detected in the circulation many years before disease diagnosis. Additionally, we detailed an axis mediated by ASCA IgG glycoforms that mechanistically is able to trigger an inflammatory event.

Similar articles

Cited by

References

    1. Torres, J. et al. Systematic review of effects of withdrawal of immunomodulators or biologic agents from patients with inflammatory bowel disease. Gastroenterology149, 1716–1730 (2015). - PubMed
    1. Xavier, R. J. & Podolsky, D. K. Unravelling the pathogenesis of inflammatory bowel disease. Nature448, 427–434 (2007). - PubMed
    1. Morão, B. & Torres, J. Preclinical disease and preventive strategies in IBD. Curr. Opin. Pharmacol.55, 110–115 (2020). - PubMed
    1. Torres, J., Burisch, J., Riddle, M., Dubinsky, M. & Colombel, J.-F. Preclinical disease and preventive strategies in IBD: perspectives, challenges and opportunities. Gut65, 1061–1069 (2016). - PubMed
    1. Sendid, B. et al. Specific antibody response to oligomannosidic epitopes in Crohn’s disease. Clin. Diagn. Lab. Immunol.3, 219–226 (1996). - PMC - PubMed

MeSH terms

LinkOut - more resources