. 2024 Aug;10(8):1246-1257.
doi: 10.1038/s41477-024-01741-9. Epub 2024 Jul 30.

Enhancers associated with unstable RNAs are rare in plants

Affiliations

Enhancers associated with unstable RNAs are rare in plants

Bayley R McDonald et al. Nat Plants. 2024 Aug.

Abstract

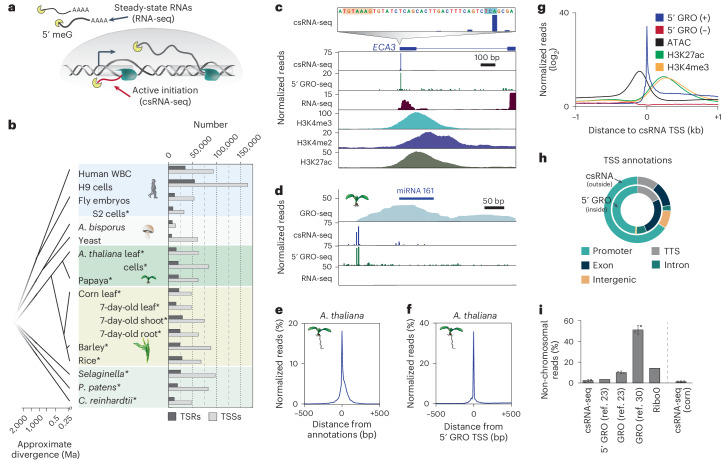
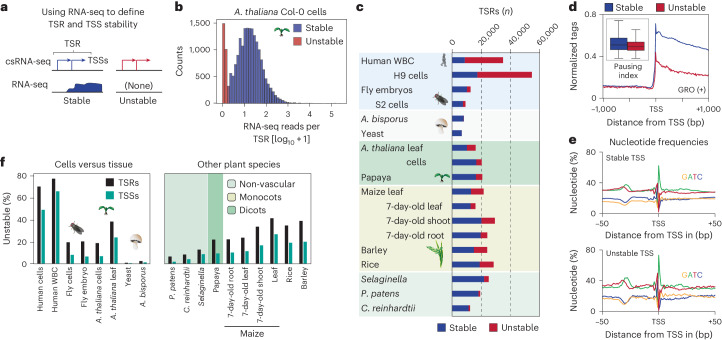
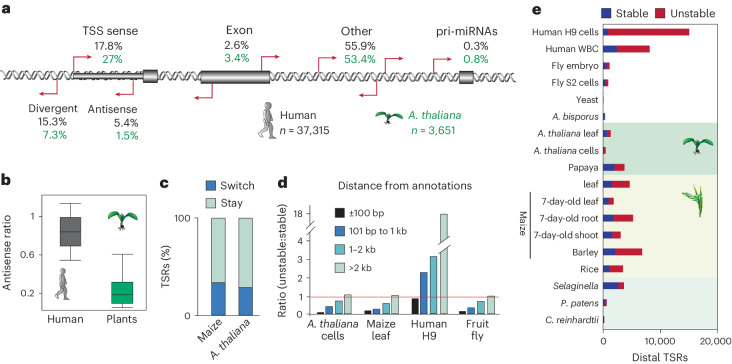
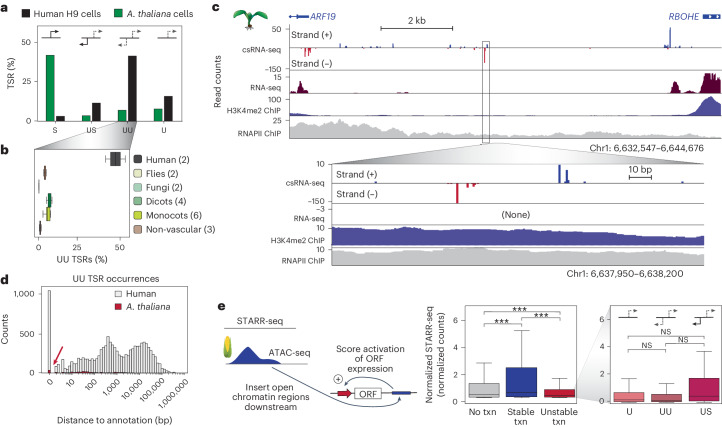
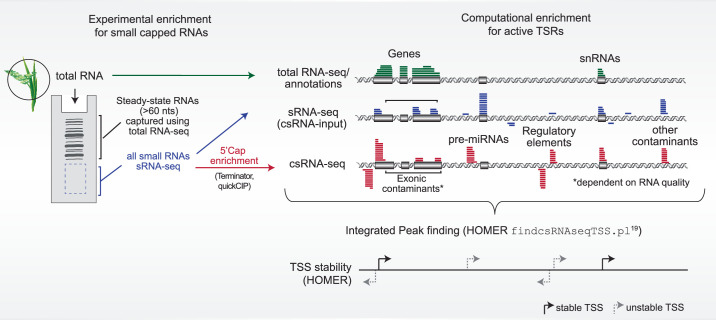
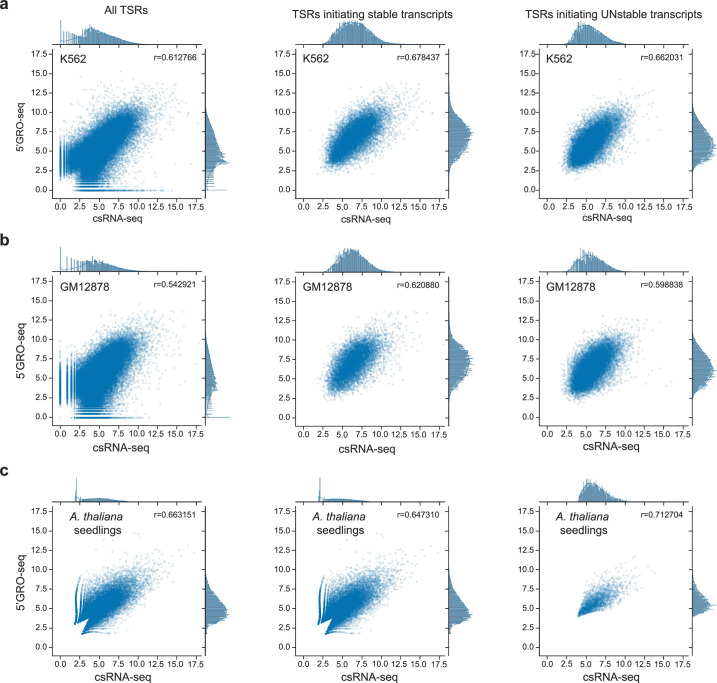
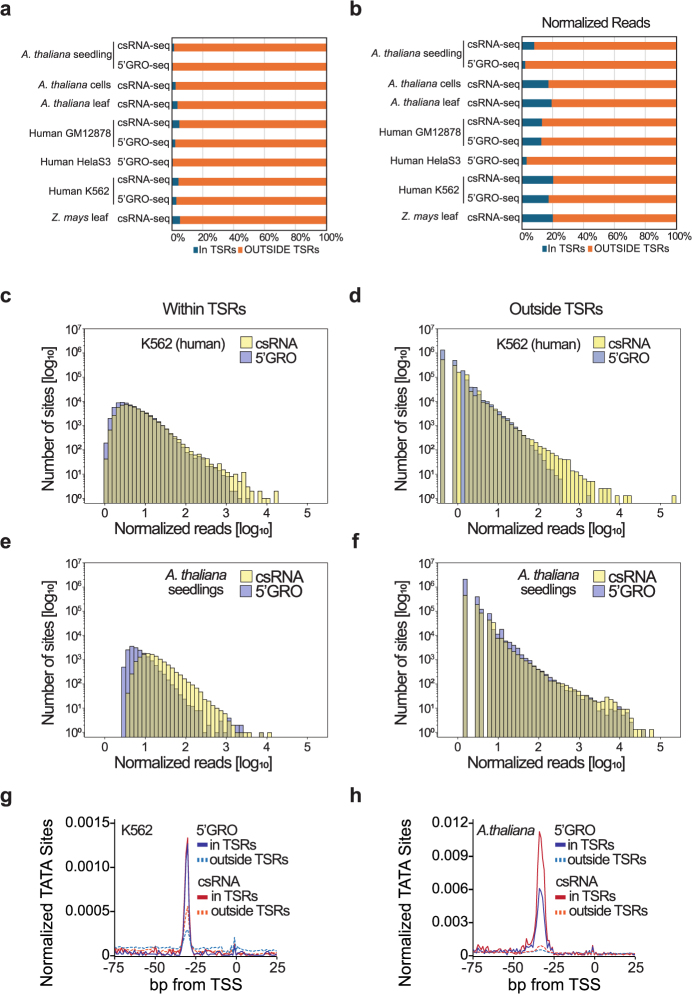
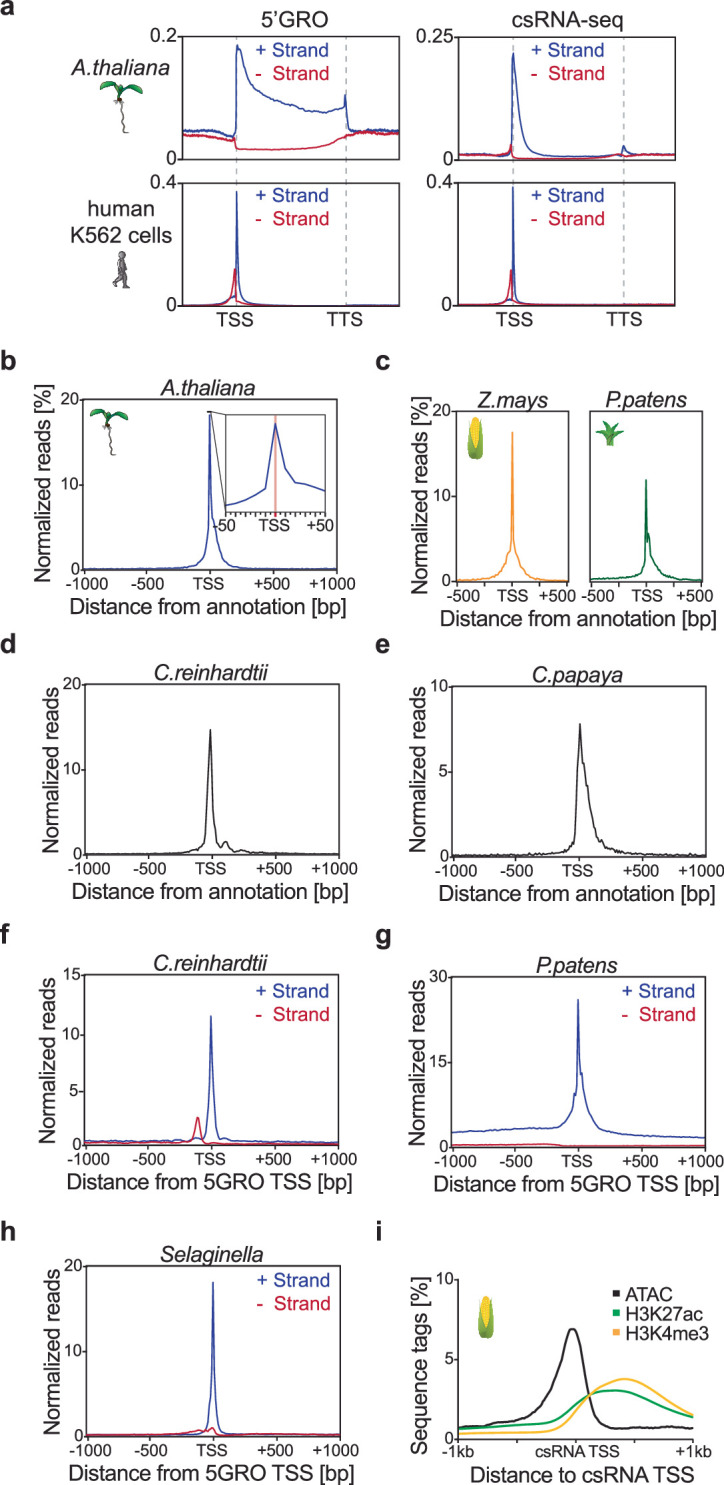
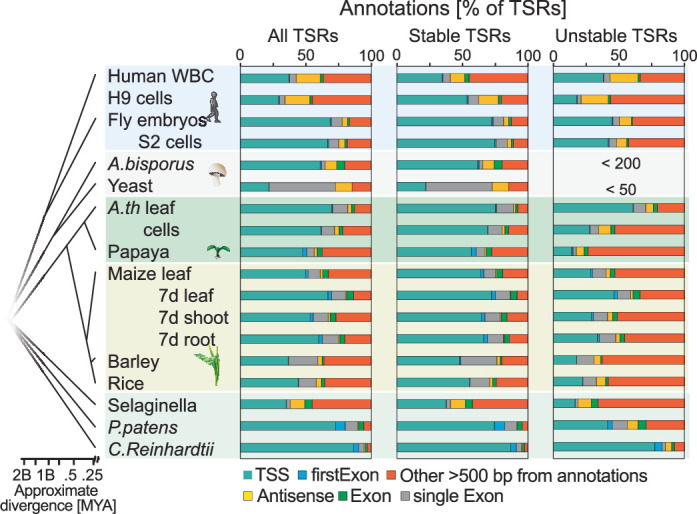
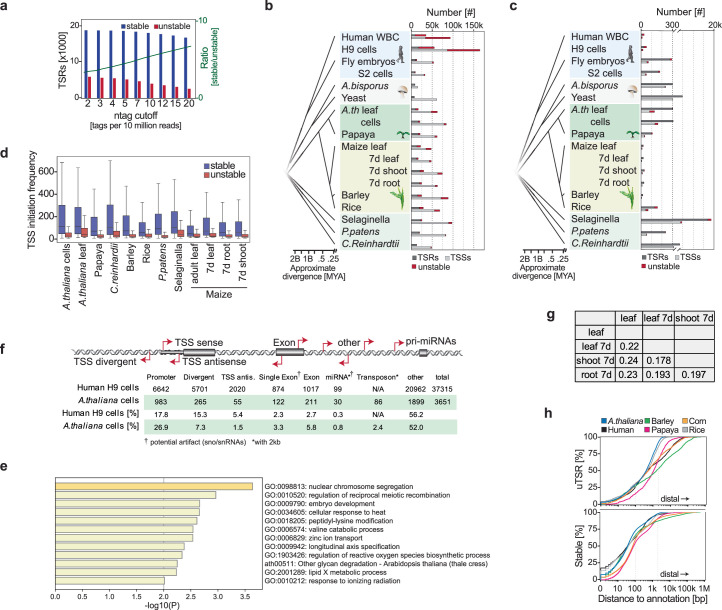
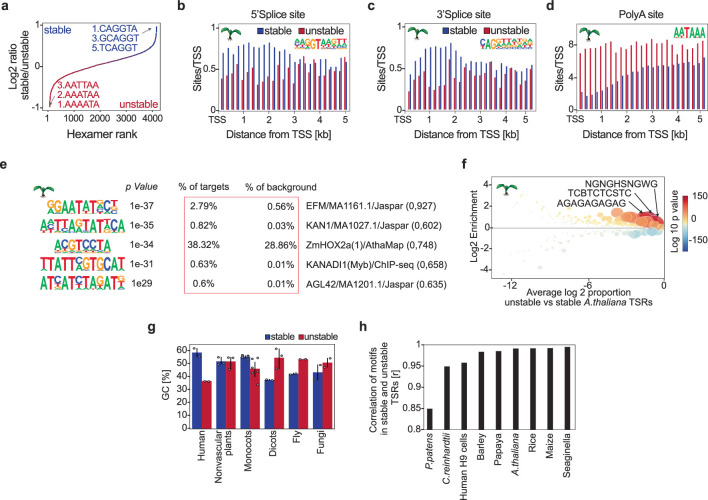
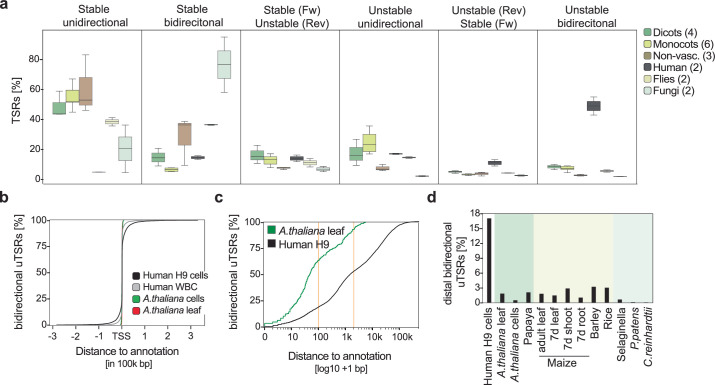
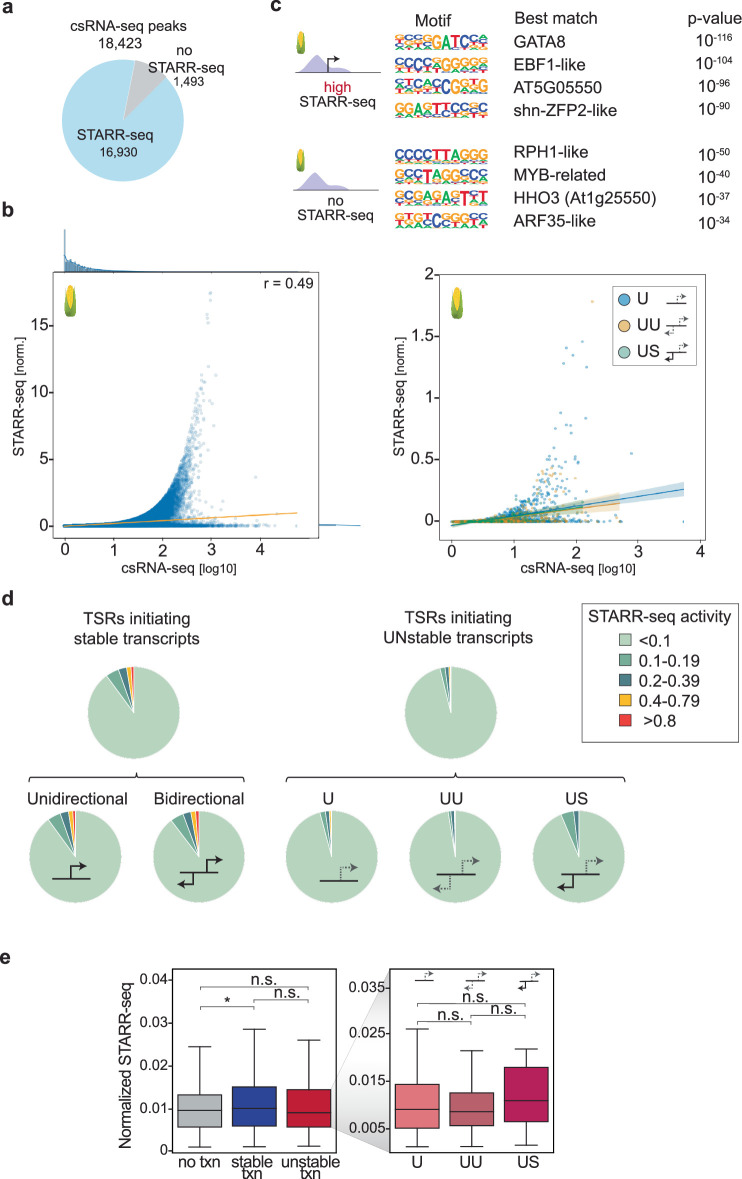
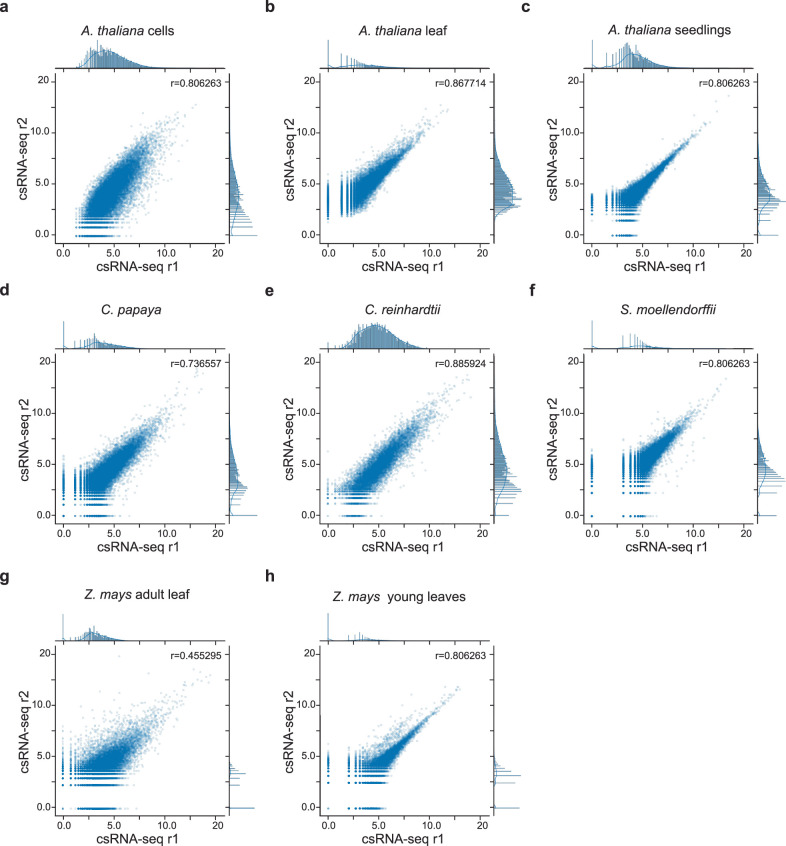
Unstable transcripts have emerged as markers of active enhancers in vertebrates and shown to be involved in many cellular processes and medical disorders. However, their prevalence and role in plants is largely unexplored. Here, we comprehensively captured all actively initiating (nascent) transcripts across diverse crops and other plants using capped small (cs)RNA sequencing. We discovered that unstable transcripts are rare in plants, unlike in vertebrates, and when present, often originate from promoters. In addition, many 'distal' elements in plants initiate tissue-specific stable transcripts and are likely bona fide promoters of as-yet-unannotated genes or non-coding RNAs, cautioning against using reference genome annotations to infer putative enhancer sites. To investigate enhancer function, we integrated data from self-transcribing active regulatory region (STARR) sequencing. We found that annotated promoters and other regions that initiate stable transcripts, but not those marked by unstable or bidirectional unstable transcripts, showed stronger enhancer activity in this assay. Our findings underscore the blurred line between promoters and enhancers and suggest that cis-regulatory elements can encompass diverse structures and mechanisms in eukaryotes, including humans.


Conflict of interest statement

The authors declare no competing interests.

Figures

Fig. 1
Fig. 1. A comprehensive atlas of nascent plant transcription initiation.
a, Schematic of steady-state RNA, as captured by RNA-seq, and actively initiating or nascent transcripts, captured by csRNA-seq. b, Overview of samples studied with the numbers of captured transcription start regions (TSRs), which include promoters and enhancers, and of TSSs. Samples generated in this study are marked with an asterisk (*). c, A. thaliana ECA3 loci with csRNA-seq at single-nucleotide resolution and zoomed out, 5′ GRO-seq and histone ChIP-seq data. d, A. thaliana miRNA 161 cluster. e, Normalized distribution of A. thaliana csRNA-seq data from leaves relative to TAIR10 TSS annotations. All reads under the graph amount to 100%. f, Normalized distribution of csRNA-seq TSSs from A. thaliana leaves relative to 5′ GRO-seq TSSs mapped in 6-day-old seedlings. g, Distribution of 5′ GRO-seq reads, open chromatin (ATAC-seq) and histone H3 lysine 4 trimethylation (H3K4me3) and H3 lysine 27 acetylation (H3K27ac) relative to csRNA-seq TSSs in A. thaliana. h, Comparison of annotations of TSSs mapped by 5′ GRO-seq and csRNA-seq in A. thaliana. i, Percentage of non-chromosomal RNA reads captured by csRNA-seq (0.031% and 0,014%; n = 2), GRO-seq (0.109% and 0.09%; n = 2), GRO-seq (0.54% and 0.48%; n = 2), 5′ GRO-seq (0.034%; n = 1), or total RNA-seq (Ribo0, 0.147%; n = 1) in A. thaliana and maize (csRNA-seq only, 0.009% and 0.01%; n = 2). These RNAs are not synthesized by RNA polymerase II or other eukaryotic RNA polymerases. Graphs present the mean with s.d. Ma, million years ago; TTS, transcription termination site; WBC, white blood cells; 5′ meG, 5′ methylguanine.
Fig. 2
Fig. 2. Unstable RNAs are infrequent in plants.
a, Schema of how transcript stability was determined by integrating total RNA-seq read counts from −100 bp to +500 bp with respect to the major TSSs within TSRs identified by csRNA-seq. b, Distribution of RNA-seq reads per million within −100 bp to +500 bp relative to the main TSS of each TSR, plotted as [log10 + 1]. c, Summary of the number of stable and unstable TSRs in each sample analysed. d, GRO-seq signal (positive strand only) in A. thaliana, in proximity to the TSS of stable and unstable transcripts. Inset: calculated pausing index (reads within −100 bp to +300 bp of the TSS divided by the reads from +301 bp to +3,000 bp; see Methods). Box plots show median values and the interquartile range. Whiskers show minimum and maximum values, excluding outliers. e, Metaplot of nucleotide frequency with respect to the +1 TSS as defined by csRNA-seq for stable and unstable transcripts in A. thaliana. f, Percentage of TSRs and TSSs initiating unstable transcripts across all species and tissues assayed.
Fig. 3
Fig. 3. Distinct origins of stable and unstable transcripts in humans, plants and other species.
a, Classification of TSRs producing unstable transcript genomic sites in human H9 cells and A. thaliana Col-0 cells, relative to current annotations (Araport11 or gencode.42). TSS = ±275 bp of 5′ gene annotation in sense direction; TSS antisense, within the TSS region but antisense; TSS divergent, initiating from −1 bp to −275 bp to the TSS. b, Ratio of promoter-proximal antisense transcription reveals most plant but not human unstable transcripts to initiate in the sense direction. Ratio of TSRs in antisense to genome-annotated gene 5′ ends (−275 bp to +275 bp relative to the annotated TSS) divided by the number of total TSRs that mapped to annotated TSS. Boxes show median values and the interquartile range. Whiskers show minimum and maximum values, excluding outliers. c, Percentage of TSRs that switch between initiating stable and unstable transcripts among A. thaliana Col-0 cells and leaves, maize adult leaves, and 7-day-old leaves, shoot and roots. d, Number of TSRs initiating unstable divided by stable transcripts relative to distance to genome annotations by regions (1) ±100 bp, (2) 101–1,000 bp, (3) 1,001–2,000 bp and (4) >2,000 bp for A. thaliana, fruit fly S2, human cells and maize leaves. e, Number of TSRs >2,000 bp from annotations that initiate stable or unstable transcripts. pri-miRNAs, primary miRNAs.
Fig. 4
Fig. 4. Vertebrate-like enhancers are rare in plants and have less enhancer activity than promoters.
a, Overview of TSR directionality and type in human H9 cells and A. thaliana Col-0 cells. Initiation styles are defined as follows: S, TSR is stable and unidirectional; US, TSR produces an unstable sense transcript and a stable antisense transcript; UU, TSR produces unstable sense and antisense transcripts; and U, TSR is unstable and unidirectional. b, Average percentage of bidirectional unstable transcription in samples from humans (H9 cells and WBC), fruit flies (embryos and S2 cells), fungi (S. cerevisiae and A. bisporus), dicots (A. thaliana cells and leaf and papaya), monocots (maize, rice and barley) and non-vascular plants (Selaginella, P. patens, and C. reinhardtii). Boxes show median values and the interquartile range. Whiskers show minimum and maximum values, excluding outliers. Numbers in parentheses indicate number of samples in the group. c, Example of 1 of 72 distal TSRs in A. thaliana leaves initiating unstable bidirectional transcription. d, Distribution of distance to nearest genome annotations for all TSRs initiating unstable bidirectional transcription; annotations in human H9 and A. thaliana Col-0 cells. e, Overview of the STARR-seq assay (left) that measures the ability of DNA regions, here all open chromatin regions in maize captured by ATAC-seq, cloned downstream of a minimal promoter to enhance its transcription. Enhancer function, as measured by STARR-seq promoter activity (scaled by 100), was subgrouped by csRNA-seq in tissue-defined TSR type (no, stable or unstable transcription initiation). Regions initiating unstable transcription were further subgrouped by their initiation styles (U, UU, US). Boxes show median values and interquartile range, with whiskers showing minimum and maximum values (excluding outliers). One-way ANOVA and Tukey’s honestly significant difference (HSD) test were used. ***P < 0.0005, adjusted P value calculated by Tukey’s HSD. Left box plot: no transcription (txn) versus stable (adjusted P = 2.665 × 10−14), no txn versus unstable (adjusted P = 1.356 × 10−5) and stable versus unstable (adjusted P = 3.486 × 10−14). Right box plot: U versus UU (adjusted P = 0.1802), U versus US (adjusted P = 0.8886), and UU versus US (adjusted P = 0.5130). Chr1, chromosome 1; NS, not significant; ORF, open reading frame; RNAPII, RNA polymerase II.
Extended Data Fig. 1
Extended Data Fig. 1. Overview of capped small (cs)RNA-seq.
Schematic of experimental and in silico steps performed to enrich actively initiated RNA polymerase II transcripts, which are marked by a 5’cap, from total RNA.
Extended Data Fig. 2
Extended Data Fig. 2. csRNA-seq captures transcription initiation independent of RNA stability.
Scatterplots comparing similarity between 5’GRO-seq and csRNA-seq rlog tag normalization for all TSRs, TSRs resulting in stable transcripts, and TSRs resulting in UNstable transcripts for a, Homo sapiens K562 cells, b, Homo sapiens GM12878 cells, and c, Arabidopsis thaliana 6-day-old seedlings.
Extended Data Fig. 3
Extended Data Fig. 3. Fine-scale comparison of 5’ ends captured by csRNA-seq and 5’GRO-seq.
a, Comparison of the percentage of unique positions captured that fell inside or outside of a TSR following peak calling for each library. On average, a higher percentage of tags fell within TSRs for csRNA-seq compared to 5’GRO. b, Comparison of the percentage of normalized total read counts captured that fell inside or outside of a TSR following peak calling for each library. c-f, Comparison of the number of unique sites (y-axis) versus intensity (normalized reads, x-axis) for csRNA-seq and 5’GRO positions from human K562 cells (c,d) and A. thaliana 6-day-old seedlings (e,f). c,e, Sites that mapped within TSRs, d,f, Sites that mapped outside TSRs. Overall, for these data 5’GRO exhibited enrichment for low signal noise, whereas csRNA-seq showed high signal contaminations, often resulting from small nuclear and small nucleolar RNAs. These abundant steady-state small RNAs are not considered csRNA-seq TSRs due to lack of enrichment over the small RNA-seq utilized as csRNA-seq input. g,h Frequency analysis of the TATA box motif relative to each unique sequence tag (‘0’) as a biological proxy to measure of noise, as this core promoter element is constrained to the −28 region relative to the TSSs. Data for human K562 cells (g) and A. thaliana 6-day-old seedlings (h).
Extended Data Fig. 4
Extended Data Fig. 4. csRNA-seq accurately captures transcription initiation sites (TSSs) across diverse plant species.
a, Metaplots of 5’GRO-seq or csRNA-seq reads relative to gene annotation start sites (TSS) and ends (Transcription Termination Sites, TTS). b-e, Distribution of csRNA-seq TSSs, relative to genome annotations, in A. thaliana (b), maize and P. patens (c), C. reinhardtii (d) and papaya leaves (e). f-h, Distribution of csRNA-seq TSSs relative to 5’GRO-seq TSSs in C. reinhardtii (f), P. patens (g) and Selaginella (h). i, Distribution of open chromatin (ATAC-seq) and histone marks H3K4me3 and H3K27ac from relative to csRNA-seq TSSs in maize leaves.
Extended Data Fig. 5
Extended Data Fig. 5. Annotation and features of plant transcription start regions.
Annotations of TSRs captured across diverse samples.
Extended Data Fig. 6
Extended Data Fig. 6. Features of TSRs initiating unstable transcripts.
a, Titration of TSRs passing the respective ntag threshold (reads per 10 M) as well as separation thereof by initiating transcript stability for A.thaliana leaves. b, Number of TSSs and TSRs that initiate stable or unstable transcription per species and tissue. c, Number of TSSs and TSRs that initiate stable or unstable transcription per species and tissue normalized by total genome size. Note: genome size does not equate to accessible chromatin. d, Average RNA polymerase II initiation frequency of TSRs initiating transcripts that are stable or unstable. Boxes show median values and the interquartile range. Whiskers show minimum and maximum values, excluding outliers. e, Enrichment analysis on gene sets (gene ontology) of unstable TSRs in A. thaliana that annotated to promoters. f, Comparison of TSR locations relative to annotations in human H9 cells (gencode.42) and A. thaliana Col-0 cells (Araport11). TSS = ± 275 bp of 5’ gene annotation in sense direction; TSS antisense, within the TSS region but antisense; TSS divergent, initiating from −1 to −275bp to the TSS. g, Pairwise percent comparison of TSRs that switch between initiating stable and unstable transcripts among maize adult leaves and 7d-old leaves, shoot, and roots. h, Number of TSRs initiating stable or unstable transcripts in % relative to genome annotations.
Extended Data Fig. 7
Extended Data Fig. 7. DNA sequence motifs and features of TSRs initiating stable or unstable RNAs.
a, Rank of all 4096 hexamers by log 2 enrichment relative to transcripts stability within 1 kb downstream of TSSs. b, Occurrences of a 5’ splice site downstream of A. thaliana TSSs of stable and unstable transcripts. c, Occurrences of a 3’ splice site downstream of A. thaliana TSSs of stable and unstable transcripts. d, Occurrences of a polyadenylation site downstream of A. thaliana TSSs of stable and unstable transcripts. e, De novo motif analysis using HOMER of A. thaliana cell TSRs regulating unstable transcripts using stable TSRs as background. f, Differential motif enrichment analysis of TSRs initiating stable or unstable transcription using CiiiDER. g, Average GC content of TSRs in different groups of species. GC content of individual replicates is displayed as dots. Graphs present the mean with SD. h, Correlation of DNA sequence motif enrichment scores among TSRs initiating stable and unstable transcription (r-value).
Extended Data Fig. 8
Extended Data Fig. 8. Annotation and abundance of TSRs regulating the initiation of unstable transcripts across species.
a, TSR types and their relative abundance across diverse species groups. Boxes show median values and the interquartile range. Whiskers show minimum and maximum values, excluding outliers. b, Location of bidirectional TSRs initiating unstable transcripts relative to genome annotations in humans (gencode.42) and A. thaliana (Araport 11) and c, log scale thereof. d, Percentage of distal (>2000 bp from annotations) bidirectional TSRs initiating unstable transcription across species and tissues.
Extended Data Fig. 9
Extended Data Fig. 9. Transcription initiation and STARR-seq enhancer function.
a, Number or TSRs covered by the STARR-seq input library. b, Scatterplot of the STARR-seq activity of all regions in Ricci et al. maize library with csRNA-seq signal for all loci (left) and TSRs initiating unstable transcription (right). c, De novo motifs enriched in regions with high STARR-seq activity vs. none, calculated using HOMER. d, STARR-seq enhancer activity of diverse TSR types. e, STARR-seq activity of A. thaliana genome fragments assayed from Tan et al. in leaf-derived protoplasts compared to combined A. thaliana adult leaf and cell line csRNA-seq TSRs. However, caution needs to be taken with the interpretation of this analysis as the datasets are not tissue-matched and the majority of loci assayed by STARR-seq are in closed chromatin, and thus not assayed by csRNA-seq. Boxes show median values and interquartile range, with whiskers showing minimum and maximum values (excluding outliers). One-way ANOVA and Tukey’s HSD were used; * indicates an adjusted p-value < 0.05 calculated by Tukey’s HSD. Left boxplot: no txn vs stable (adjusted p-value = 0.0442), no txn vs unstable (adjusted p-value = 0.9084), and stable vs unstable (adjusted p-value = 0.4255). Right boxplot: U vs UU (adjusted p-value = 0.6019850), U vs US (adjusted p-value = 0.1535811), and UU vs US (adjusted p-value = 0.0606304).
Extended Data Fig. 10
Extended Data Fig. 10. Variance of biological csRNA-seq replicates.
Scatterplots comparing rlog tag normalization similarity between biological replicates for a, A. thaliana cells, b, A, thaliana leaf, c, A. thaliana seedlings (6 days), d, C. papaya, e, C. reinhardtii, f, S. moellendorffii, g, Z. mays adult leaf and, h, Z. mays young leaves (7 days).

Update of

Similar articles

Cited by

References

    1. Kim, T.-K. et al. Widespread transcription at neuronal activity-regulated enhancers. Nature465, 182 (2010). 10.1038/nature09033 - DOI - PMC - PubMed
    1. De Santa, F. et al. A large fraction of extragenic RNA Pol II transcription sites overlap enhancers. PLoS Biol.8, e1000384 (2010). 10.1371/journal.pbio.1000384 - DOI - PMC - PubMed
    1. Yamada, T. & Akimitsu, N. Contributions of regulated transcription and mRNA decay to the dynamics of gene expression. Wiley Interdiscip. Rev. RNA10, e1508 (2019). 10.1002/wrna.1508 - DOI - PubMed
    1. Wissink, E. M., Vihervaara, A., Tippens, N. D. & Lis, J. T. Nascent RNA analyses: tracking transcription and its regulation. Nat. Rev. Genet.20, 705–723 (2019). 10.1038/s41576-019-0159-6 - DOI - PMC - PubMed
    1. Palazzo, A. F. & Lee, E. S. Non-coding RNA: what is functional and what is junk? Front. Genet.6, 2 (2015). 10.3389/fgene.2015.00002 - DOI - PMC - PubMed

Publication types

MeSH terms