. 2024 Jul 30;24(1):922.
doi: 10.1186/s12885-024-12680-1.

Lenvatinib targets STAT-1 to enhance the M1 polarization of TAMs during hepatocellular carcinoma progression

Affiliations

Lenvatinib targets STAT-1 to enhance the M1 polarization of TAMs during hepatocellular carcinoma progression

Peng Sun et al. BMC Cancer. .

Abstract

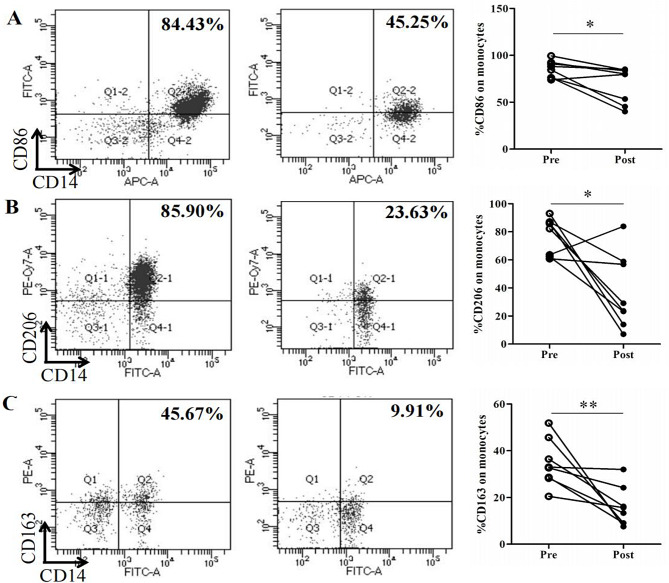
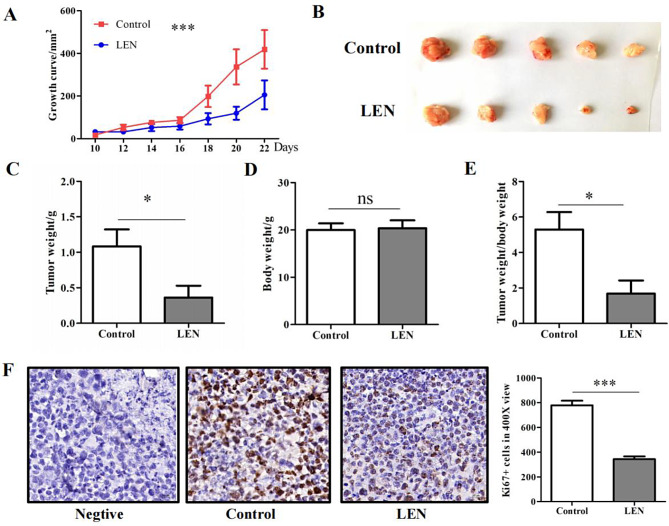
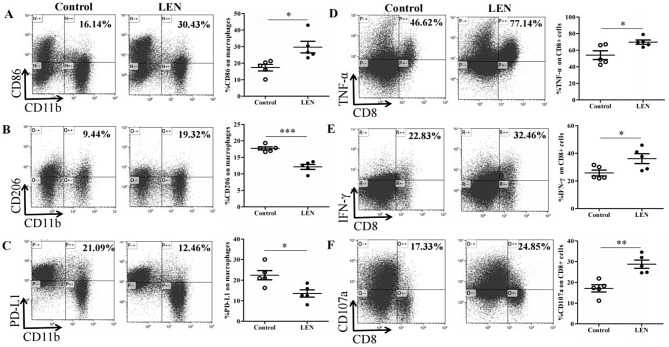
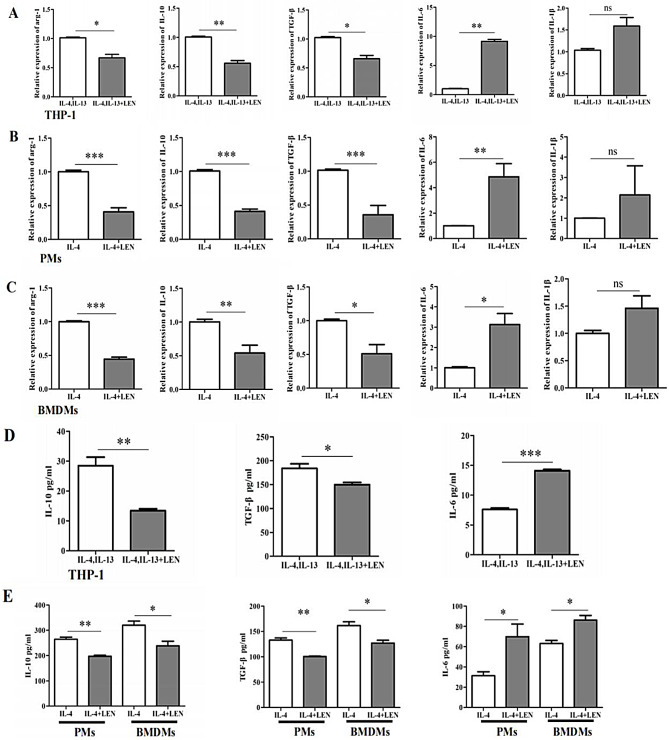
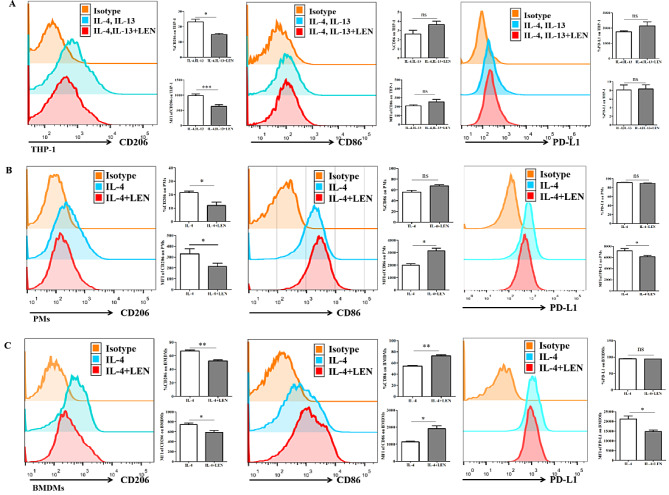
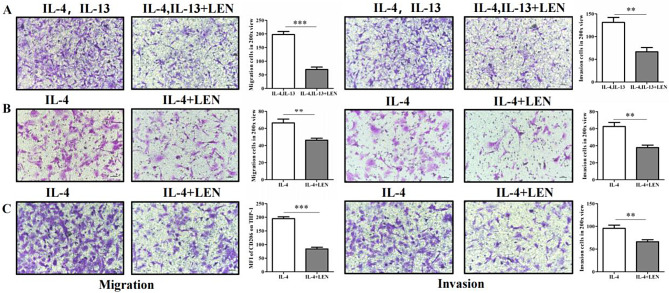
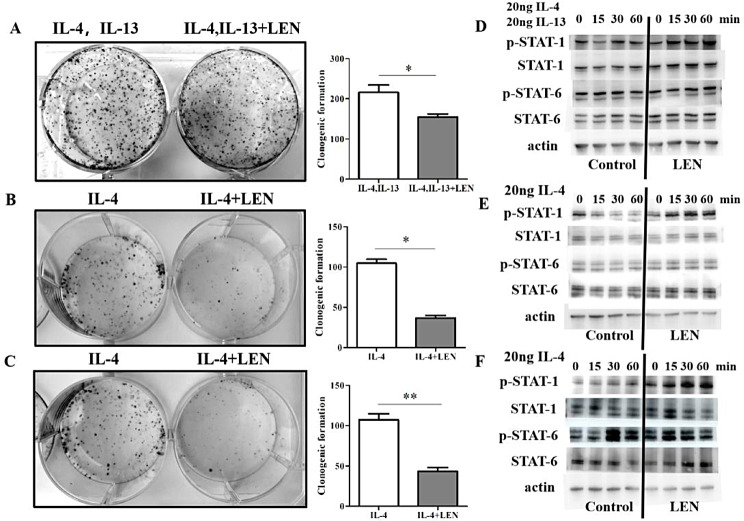
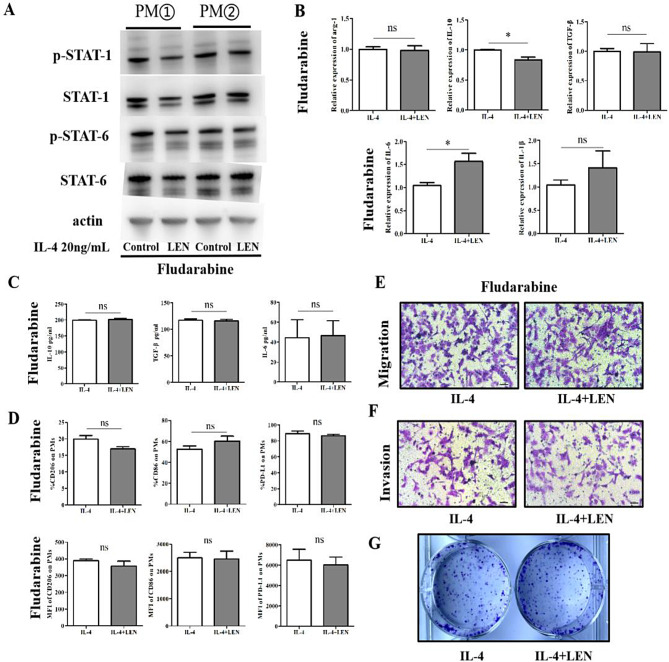
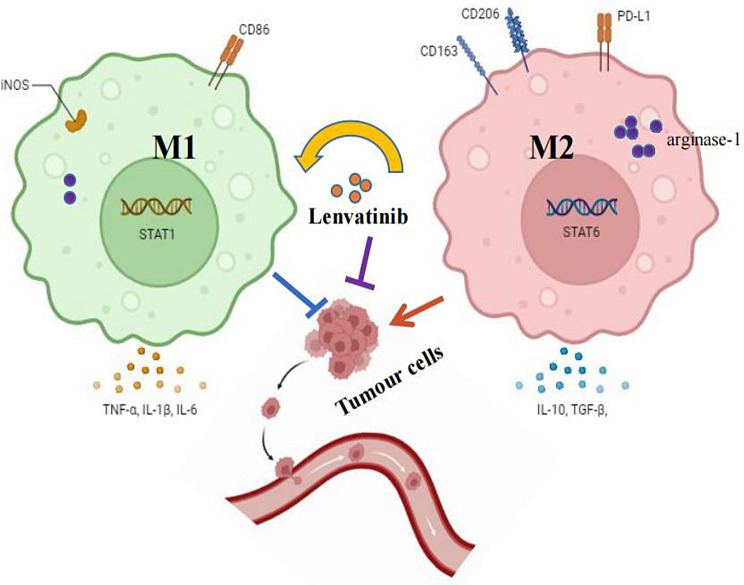
Lenvatinib, a multitarget kinase inhibitor, has been proven to be effective in the treatment of advanced hepatocellular carcinoma. It has been previously demonstrated that tumour associated macrophages (TAMs) in tumour tissues can promote HCC growth, invasion and metastasis. Furthermore, lenvatinib has certain immunomodulatory effects on the treatment of HCC. However, the role of lenvatinib in macrophage polarization during HCC treatment has not been fully explored. In this study, we used a variety of experimental methods both in vitro and in vivo to investigate the effect of lenvatinib on TAMs during HCC progression. This study is the first to show that lenvatinib can alter macrophage polarization in both humans and mice. Moreover, macrophages treated with lenvatinib in vitro displayed enhanced classically activated macrophages (M1) activity and suppressed liver cancer cell proliferation, invasion, and migration. Furthermore, during the progression of M1 macrophage polarization induced by lenvatinib, STAT-1 was the main target transcription factor, and inhibiting STAT-1 activity reversed the effect of lenvatinib. Overall, the present study provides a theoretical basis for the immunomodulatory function of lenvatinib in the treatment of HCC.

Keywords: HCC; Lenvatinib; STAT-1; TAMs.


Conflict of interest statement

The authors declare no competing interests.

Figures

Fig. 1
Fig. 1
The polarization state of monocytes in HCC patients. We collected monocytes from the peripheral blood of HCC patients before and after the administration of LEN (n = 8). CD86, CD206, and CD163 on monocytes labelled with CD14 were detected by flow cytometry (FCM). A representative graph is shown on the left, and a statistical graph is shown on the right. (A) The percentage of CD86 + CD14 + monocytes was determined by FCM before (85.21%±3.25%) and after (68.98%±6.81%) LEN treatment. (B) The percentage of CD206 + CD14 + monocytes was determined by FCM before (77.67%±4.66%) and after (37.08%±9.38%) LEN treatment. (C) The percentage of CD163 + CD14 + monocytes was determined by FCM before (34.61%±3.55%) and after (15.87%±2.98%) LEN treatment. The data are presented as the means ± SEMs. *p < 0.05, **p < 0.01
Fig. 2
Fig. 2
The effect of LEN on HCC growth. A mouse HCC model (n = 5) was established with H22 cells, a mouse hepatocellular carcinoma cell line. Then, the mice were given LEN (10 mg/kg/day) or control starch by gavage every day for 10 days. (A) The tumour growth curve, which was measured via tumour size, is shown. (B) The tumour images of the two groups are presented at the time of sacrifice. (C) The tumour weights of the two groups were measured (control, 1.08 g ± 0.24 g; LEN, 0.36 g ± 0.17 g). (D) The body weights of the two groups were measured (control, 19.99 g ± 1.41 g; LEN, 20.36 g ± 1.68 g). (E) The ratio of tumour weight to body weight is presented (control, 5.29 ± 0.98; LEN, 1.68 ± 0.74). (F) Immunohistochemical staining for Ki67 was performed to evaluate the proliferation of HCC cells. A typical graph is shown on the left, and a statistical graph is shown on the right. (Control, 778.80 ± 37.80; LEN, 343.80 ± 22.46). The data are presented as the means ± SEMs. *p < 0.05, ***p < 0.001, ns indicates no significance
Fig. 3
Fig. 3
The status of macrophages and CD8 + T cells in the tumour microenvironment. The tumour tissues collected from the mice at the time of sacrifice are presented in Fig. 2B. The tumour tissues from the control and LEN groups were digested, ground and separated to obtain immune cells. FCM analysis was performed to detect the status of macrophages and CD8 + T cells. Typical images are presented in the left panel, while summary data are presented in the right panel. (A) The percentage of CD86 + macrophages labelled with CD11b is shown (control, 17.31%±2.00%; LEN, 29.75%±3.51%). (B) The percentage of CD206 + macrophages is shown (control, 17.71%±0.46%; LEN, 12.13%±0.75%). (C) The percentage of PD-L1 + macrophages is shown (control, 22.41%±2.26%; LEN, 13.52%±1.77%). The antitumour activity of CD8 + T cells was analysed by FCM after stimulation with PMA (50 ng/mL) and ionomycin (1 µg/mL) and blocking with BFA (10 µg/mL). (D) The percentage of TNF-α-positive CD8 + T cells labelled with CD3 + CD8 + cells is shown (control, 54.05%±5.24%; LEN, 69.80%±2.55%). (E) The percentage of IFN-γ + CD8 + T cells is shown (control, 25.76%±2.08%; LEN, 36.17%±3.54%). (F) The percentage of CD107a + CD8 + T cells is shown (control, 17.10%±1.72%; LEN, 28.77%±1.97%). The data are presented as the means ± SEMs. *p < 0.05, **p < 0.01, ***p < 0.001
Fig. 4
Fig. 4
M1 macrophage polarization induced by LEN was confirmed. The THP-1, PMs, BMDMs were induced to M2 cells and then treated with LEN. Reverse transcription-quantitative PCR was performed to determine the relative expression of arginase-1, IL-10, TGF-β, IL-6, and IL-1β. (A) The expression of arginase-1, IL-10, TGF-β, IL-6, and IL-1β in THP-1 treated with or without LEN was analysed by RT‒PCR. (B) The expression of arginase-1, IL-10, TGF-β, IL-6, and IL-1β in PMs treated with or without LEN was analysed by RT‒PCR. (C) The expression of arginase-1, IL-10, TGF-β, IL-6, and IL-1β in BMDMs treated with or without LEN was analysed by RT‒PCR. Then the level of IL-10, TGF-β, IL-6 in these cell supernatants were also detected by ELISA. (D) The IL-10, TGF-β, IL-6 from THP-1 cells treated with or without LEN was detected by ELISA. (E) The IL-10, TGF-β, IL-6 from PMs treated with or without LEN were detected by ELISA. (F) The IL-10, TGF-β, IL-6 from BMDMs treated with or without LEN were detected by ELISA. Data are presented as the means ± SEMs. *p < 0.05, **p < 0.01, ***p < 0.001, ns indicates no significance
Fig. 5
Fig. 5
M1 macrophage polarization induced by LEN detected by FCM. The expression of CD206, CD86 and PD-L1 on the corresponding macrophages was detected by FCM. Typical images are presented in the left panel, while summary data for the percentage (up) and mean fluorescence intensity (down) are presented in the right panel. (A) CD206, CD86 and PD-L1 expression on human macrophages treated with or without LEN was analysed by FCM. (B) CD206, CD86 and PD-L1 expression on PMs treated with or without LEN was analysed by FCM. (C) CD206, CD86 and PD-L1 expression on BMDMs treated with or without LEN was analysed by FCM. The data are presented as the means ± SEMs. *p < 0.05, **p < 0.01, ***p < 0.001, ns indicates no significance
Fig. 6
Fig. 6
The effect of macrophages induced by LEN on the migration and invasion of HCC cells. The supernatants of corresponding macrophages treated with or without LEN were collected for migration and invasion assays. A typical graph is shown on the left, and a statistical graph is shown on the right. (A) The migration and invasion of HepG2 cells cocultured with the supernatants of THP-1 are shown. (B) The migration and invasion of Hepa1-6 cells cocultured with the supernatants of PMs are shown. (C) The migration and invasion of Hepa1-6 cells cocultured with the supernatants of BMDMs are shown. The data are presented as the means ± SEMs. **p < 0.01, ***p < 0.001
Fig. 7
Fig. 7
The effect of macrophages induced by LEN on the growth of HCC cells. The supernatants of the corresponding macrophages treated with or without LEN were collected for the colony formation assay. A typical graph is shown on the left, and a statistical graph is shown on the right. (A) The growth of HepG2 cells cocultured with the supernatants of THP-1 is shown. (B) The growth of Hepa1-6 cells cocultured with the supernatants of PMs is shown. (C) The growth of Hepa1-6 cells cocultured with the supernatants of BMDMs is shown. LEN affected macrophage polarization via STAT-1. The levels of p-STAT-1, STAT-1, p-STAT-6, and STAT-6 were explored by Western blotting (control on the left and LEN on the right). (D) The expression of p-STAT-1, STAT-1, p-STAT-6, and STAT-6 in THP-1 was evaluated by Western blotting. (E) The expression of p-STAT-1, STAT-1, p-STAT-6, and STAT-6 in PMs was evaluated by Western blotting. (F) The expression of p-STAT-1, STAT-1, p-STAT-6, and STAT-6 in BMDMs was evaluated by Western blotting. The data are presented as the means ± SEMs. *p < 0.05, **p < 0.01
Fig. 8
Fig. 8
Fludarabine reversed the M1 macrophage polarization induced by LEN. PMs that were pretreated with fludarabine and then LEN were prepared for subsequent experiments. (A) The levels of p-STAT-1, STAT-1, p-STAT-6, and STAT-6 were explored by Western blotting. (B) The expression of arginase-1, IL-10, TGF-β, IL-6, and IL-1β on PMs was analysed by RT‒PCR. (C) The level of IL-10, TGF-β, IL-6 from the supernatants of PMs above was detected by ELISA. (D) CD206, CD86 and PD-L1 expression on PMs was analysed by FCM. The summary data for the percentage (up) and mean fluorescence intensity (down) are presented. (E) Hepa1-6 cells were cocultured with the supernatants of PMs for the migration assay. (F) Hepa1-6 cells were cocultured with the supernatants of PMs for invasion assays. (G) Hepa1-6 cells were cocultured with the supernatants of PMs for the colony formation assay. The data are presented as the means ± SEMs. *p < 0.05, ns indicates no significance
Fig. 9
Fig. 9
LEN targets STAT-1 to enhance the M1 polarization of TAMs. On one hand, LEN could inhibit the tumour progression via acting directly on tumour cells. On the other hand, the LEN restrain tumour progression via enhancing TAMs M1 polarization (more CD86, IL-6, IL-1β) and inhibiting M2 polarization (less CD206, PD-L1, IL-10, TGF-β) through STAT-1

Similar articles

Cited by

References

    1. Giraud J, Chalopin D, Blanc JF, Saleh M. Hepatocellular Carcinoma Immune Landscape and the potential of immunotherapies. Front Immunol. 2021;12:655697. 10.3389/fimmu.2021.655697 - DOI - PMC - PubMed
    1. Asafo-Agyei KO. H. Samant. Hepatocellular Carcinoma. Treasure Island (FL); 2022.
    1. Roxburgh P, Evans TR. Systemic therapy of hepatocellular carcinoma: are we making progress. Adv Ther. 2008;25:1089–104. 10.1007/s12325-008-0113-z. 10.1007/s12325-008-0113-z - DOI - PubMed
    1. Yarchoan M, Agarwal P, Villanueva A, et al. Recent developments and therapeutic strategies against Hepatocellular Carcinoma. Cancer Res. 2019;79:4326–30. 10.1158/0008-5472.CAN-19-0803. 10.1158/0008-5472.CAN-19-0803 - DOI - PMC - PubMed
    1. Fu Y, Liu S, Zeng S, Shen H. From bench to bed: the tumor immune microenvironment and current immunotherapeutic strategies for hepatocellular carcinoma. J Exp Clin Cancer Res. 2019;38:396. 10.1186/s13046-019-1396-4. 10.1186/s13046-019-1396-4 - DOI - PMC - PubMed

MeSH terms