. 2024 Jul 30;21(1):186.
doi: 10.1186/s12974-024-03185-6.

Lactylation of histone by BRD4 regulates astrocyte polarization after experimental subarachnoid hemorrhage

Affiliations

Lactylation of histone by BRD4 regulates astrocyte polarization after experimental subarachnoid hemorrhage

Fan Zhang et al. J Neuroinflammation. .

Abstract

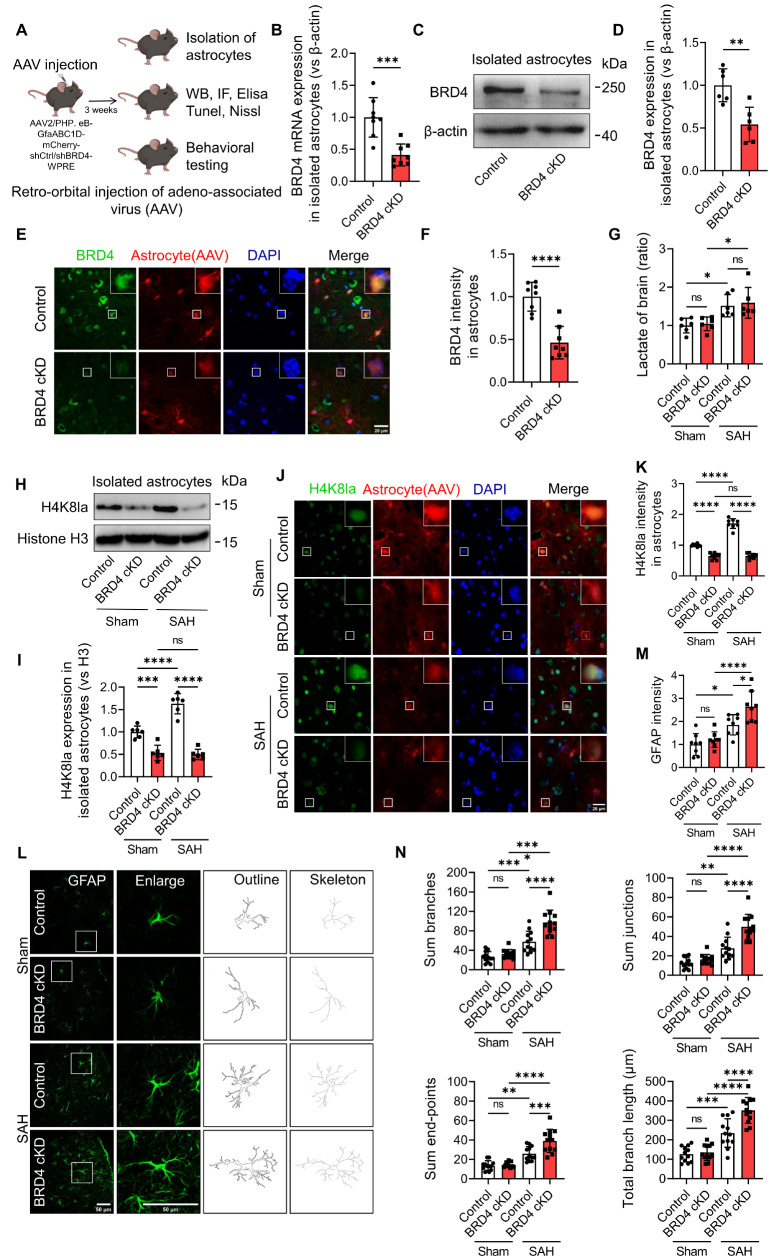
Under subarachnoid hemorrhage (SAH) conditions, astrocytes undergo a marked intensification of glycolytic activity, resulting in the generation of substantial amounts of lactate to maintain the energy demand for neurons and other brain cells. Lactate has garnered increasing attention in recent years because of its emerging role in critical biological processes such as inflammation regulation and neuroprotection, particularly through its histone lactylation. Bromodomain-containing protein 4 (BRD4) plays a crucial role in maintaining neural development and promoting memory formation in the central nervous system. Nonetheless, the function and regulatory mechanism of BRD4 and histone lactylation in astrocytes following SAH remain elusive. Our findings indicate that BRD4, a crucial epigenetic regulator, plays a definitive role in histone lactylation. Both in vitro and in vivo, these results demonstrated that targeted silencing of BRD4 in astrocytes can significantly reduce H4K8la lactylation, thereby aggravating the A1 polarization of astrocytes and ultimately affecting the recovery of neural function and prognosis in mice after SAH. In summary, BRD4 plays a pivotal role in modulating astrocyte polarization following SAH via histone lactylation. Targeting this mechanism might offer an efficient therapeutic strategy for SAH.

Keywords: Astrocytic polarization; Bromodomain-containing protein 4; Histone lactylation; Subarachnoid hemorrhage.


Conflict of interest statement

The authors declare no competing interests.

Figures

Fig. 1
Fig. 1
After 24 h of SAH, astrocytes undergo A1 polarization with elevated levels of BRD4 and lactylation. (A) Representative brain images of sham and SAH mice. (B) mRNA expression of A1 astrocyte markers (C3, Serping1, Gbp2, and Ugt1a1) and A2 astrocyte markers (S100a10, Tm4sf1, Clcf1, and B3gnt5) in mice subjected to sham and SAH conditions (n = 5 or 6). (C-D) Representative fluorescent images and quantification of BRD4 (green) in astrocytes (GFAP, red). Nuclei were counterstained with DAPI (blue, n = 9 fields from 3 mice per group). Scale bar, 50 μm. (E) Lactate levels in the brains of sham and SAH mice (n = 6). (F) Schematic diagram of astrocyte isolation. (G-J) Representative WB images and statistical results of lactylation levels (Indicated by Pan-Kla) in isolated astrocytes and other cells in sham and SAH mice (n = 10). All values are mean ± SD, *P < 0.05, **P < 0.01, ***P < 0.001, ****P < 0.0001, ns, no significant changes
Fig. 2
Fig. 2
OxyHb promotes A1 subtype astrocytes and increases BRD4 and lactylation. (A) mRNA expression of C3 and S100a10 in astrocytes of the Control and OxyHb groups (n = 6). (B-D) Representative WB images and quantification of C3 and S100a10 in astrocytes of Control and OxyHb groups (n = 6). (E) Lactate levels in astrocytes stimulated with OxyHb (n = 6). (F-H) Representative WB images and quantification of BRD4 and Pan-Kla in astrocytes of Control and OxyHb groups (n = 6). (I-K) Representative fluorescent images and quantification of Pan-Kla (green) and BRD4 (red) expression in astrocytes after OxyHb treatment. Nuclei were counterstained with DAPI (blue, n = 9). Scale bar, 20 μm. All values are mean ± SD, *P < 0.05, **P < 0.01, ***P < 0.001, ****P < 0.0001, ns, no significant changes
Fig. 3
Fig. 3
The A1 polarization of reactive astrocytes following OxyHb is regulated by lactylation. (A) mRNA expression of GFAP in astrocytes treated with OxyHb and various concentrations of 2-DG (n = 4). (B-E) Western blot and quantification of Pan-Kla, C3 and S100a10 levels in astrocytes treated with OxyHb and 4 mM 2-DG (n = 5). (F-H) Representative fluorescent images and quantification of C3 (green) and S100a10 (red) expression in astrocytes after OxyHb and 4 mM 2-DG treatment. Nuclei were counterstained with DAPI (blue, n = 6, scale bar, 100 μm). (I) mRNA expression of GFAP in astrocytes treated with OxyHb and varying concentrations of lactate (n = 4). (J-M) Western blot images and quantification of Pan-Kla, C3 and S100a10 levels after treatment with OxyHb and 20 mM lactate (n = 6). (N-P) Representative fluorescent images and quantification of C3 (green) and S100a10 (red) in astrocytes after OxyHb and 20 mM lactate treatment. Nuclei were counterstained with DAPI (blue, n = 6; scale bar, 100 μm). All values are mean ± SD, *P < 0.05, **P < 0.01, ***P < 0.001, ****P < 0.0001, ns, no significant changes
Fig. 4
Fig. 4
Knocking down BRD4 aggravates A1 polarization of astrocytes by reducing H4K8la levels. (A) BRD4 mRNA expression in shCtrl or shBRD4 cells (n = 6). (B, C and E) Western blot showing BRD4 (C) and Pan-Kla (E) expression in shCtrl or shBRD4 cells (n = 6). (D) Intracellular lactate levels in astrocytes expressing shCtrl or shBRD4 (n = 6). (F) Western blot showing H3K9la, H4K5la, H4K8la, and H4K12la levels in shCtrl or shBRD4 cells (n = 6). (G) BRD4 and H4K8la immunoprecipitation. (H) Intracellular lactate in astrocytes expressing shCtrl or shBRD4 when stimulated with OxyHb (n = 6). (I-L) Western blot showing H4K8la (J), C3 (K) and S100a10 (L) expression in astrocytes expressing shCtrl or shBRD4 when stimulated with OxyHb (n = 6). (M-O) The levels of IL-1β, TNF-α, and IL-6 in the ACM (n = 5). (P) Cell viability of neurons cultured with different ACM (n = 6). (Q-R) Representative fluorescent images and quantification of TUNEL+ neurons cultured with different ACM. Nuclei were counterstained with DAPI (blue, n = 6; scale bar = 50 μm). All values are means ± SDs, *P < 0.05, **P < 0.01, ***P < 0.001, ****P < 0.0001, ns, no significant changes
Fig. 5
Fig. 5
Knocking down BRD4 in mouse astrocytes reduces H4K8la, thereby enhancing astrocytic reactivity. (A) Astrocytic BRD4 conditional knockdown (BRD4 cKD) in C57BL/6J male mice was generated via retro-orbital injection of GfaABC1D-targeting adeno-associated virus. (B-F) BRD4 knockdown efficiency in isolated astrocytes was determined via RT-qPCR (B, n = 8), WB (C-D, n = 6) and immunofluorescence (E-F, n = 8 fields from 4 mice; scale bar = 20 μm). (G) Brain lactate concentrations were measured in Control and BRD4 cKD mice following SAH (n = 6). (H-I) Representative WB images and quantification of H4K8la levels in Control and BRD4 cKD mice following SAH (n = 6). (J-K) Representative fluorescent images and quantification of H4K8la levels in Control and BRD4 cKD mice following SAH (n = 8 fields from 4 mice; scale bar = 20 μm). (L-N) Representative fluorescent images and quantification of GFAP intensity (M, n = 8 fields from 4 mice; scale bar = 50 μm), sum branches, sum junctions, sum endpoints and total branch length (N, n = 12 astrocytes from 4 mice; scale bar = 50 μm) of astrocytes in Control and BRD4 cKD mice following SAH. All values are means ± SDs, *P < 0.05, **P < 0.01, ***P < 0.001, ****P < 0.0001, ns, no significant changes
Fig. 6
Fig. 6
Specific knocking of BRD4 in astrocytes boosts A1 astrocyte polarization, triggering inflammatory responses and neuronal death. (A-C) Western blot showing C3 (B) and S100a10 (C) expression of Control and BRD4 cKD mice after SAH (n = 6). (D-F) mRNA levels of IL-1β, TNF-α, and IL-6 in Control and BRD4 cKD mice after SAH (n = 5 or 6). (G-I) Protein levels of IL-1β, TNF-α, and IL-6 in Control and BRD4 cKD mice after SAH (n = 6). (J-K) Representative fluorescent images and quantification of TUNEL+ neurons of Control and BRD4 cKD mice after SAH. Nuclei were counterstained with DAPI (blue, n = 4; scale bar = 50 μm). (L-M) Short-term neurological function by Modified Garcia score (L) and Beam Balance test (M), n = 10. All values are the mean ± SD, *P < 0.05, **P < 0.01, ***P < 0.001, ****P < 0.0001, ns, no significant changes
Fig. 7
Fig. 7
BRD4 knockdown impairs neurological recovery in mice during the chronic phase following SAH. (A-C) Rotarod test was used to assess the falling latency (A), speed to fall (B), and distance to fall (C) of Control and BRD4 cKD mice after SAH (n = 6). (D-E) Representative trajectory maps and statistical results from the Open field test (n = 6). (F-G) Representative trajectory maps and platform crossovers from the Morris Water Maze test (n = 6). All values are mean ± SD, *P < 0.05, **P < 0.01, ***P < 0.001, ****P < 0.0001, ns, no significant changes
Fig. 8
Fig. 8
BRD4-mediated histone lactylation regulates astrocyte polarization after experimental SAH. After SAH, astrocytes undergo polarization toward the neurotoxic A1 phenotype. BRD4 mitigates the A1 polarization of astrocytes via H4K8la. However, when BRD4 is knocked down, H4K8la levels are significantly reduced, subsequently leading to the exacerbation of A1 polarization in astrocytes. This, in turn, enhances the marked release of proinflammatory factors, including IL-6, IL-1β, and TNF-α, ultimately resulting in neuronal death

References

    1. Etminan N, Chang HS, Hackenberg K, et al. Worldwide Incidence of Aneurysmal Subarachnoid Hemorrhage according to Region, Time Period, blood pressure, and Smoking Prevalence in the Population: a systematic review and Meta-analysis. JAMA Neurol. 2019;76(5):588–97. 10.1001/jamaneurol.2019.0006 - DOI - PMC - PubMed
    1. Claassen J, Park S. Spontaneous subarachnoid haemorrhage. Lancet. 2022;400(10355):846–62. 10.1016/S0140-6736(22)00938-2 - DOI - PMC - PubMed
    1. Chen X, Giles J, Yao Y, et al. The path to healthy ageing in China: a Peking University-Lancet Commission. Lancet. 2022;400(10367):1967–2006. 10.1016/S0140-6736(22)01546-X - DOI - PMC - PubMed
    1. Bonvento G, Bolanos JP. Astrocyte-neuron metabolic cooperation shapes brain activity. Cell Metab. 2021;33(8):1546–64. 10.1016/j.cmet.2021.07.006 - DOI - PubMed
    1. Allen NJ, Lyons DA. Glia as architects of central nervous system formation and function. Science. 2018;362(6411):181–5. 10.1126/science.aat0473 - DOI - PMC - PubMed

LinkOut - more resources