. 2024 Jul 30;22(1):706.
doi: 10.1186/s12967-024-05513-z.

tRNA-derived fragment 3'tRF-AlaAGC modulates cell chemoresistance and M2 macrophage polarization via binding to TRADD in breast cancer

Affiliations

tRNA-derived fragment 3'tRF-AlaAGC modulates cell chemoresistance and M2 macrophage polarization via binding to TRADD in breast cancer

Dongping Mo et al. J Transl Med. .

Abstract

Background: Drug resistance, including Adriamycin-based therapeutic resistance, remains a challenge in breast cancer (BC) treatment. Studies have revealed that macrophages could play a pivotal role in mediating the chemoresistance of cancer cells. Accumulating evidence suggests that tRNA-Derived small RNAs (tDRs) are associated the physiological and pathological processes in multiple cancers. However, the underlying mechanisms of tDRs on chemoresistance of BC in tumor-associated macrophages remain largely unknown.

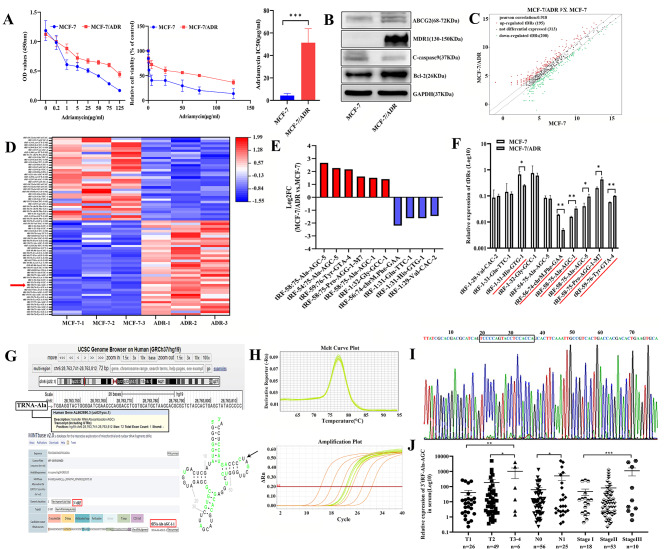
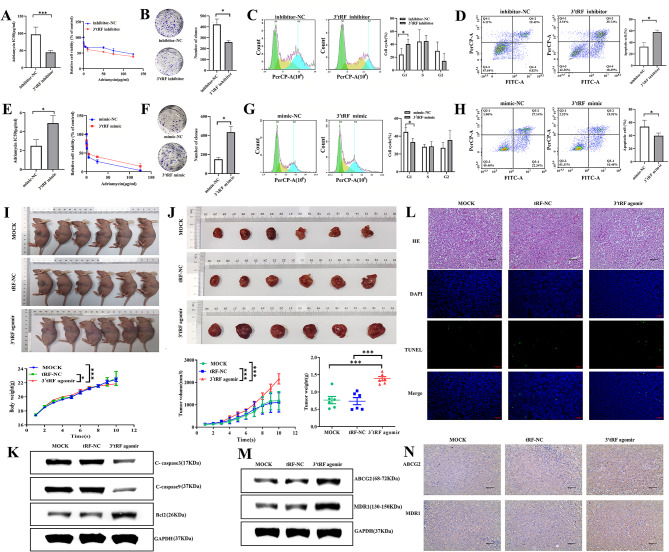
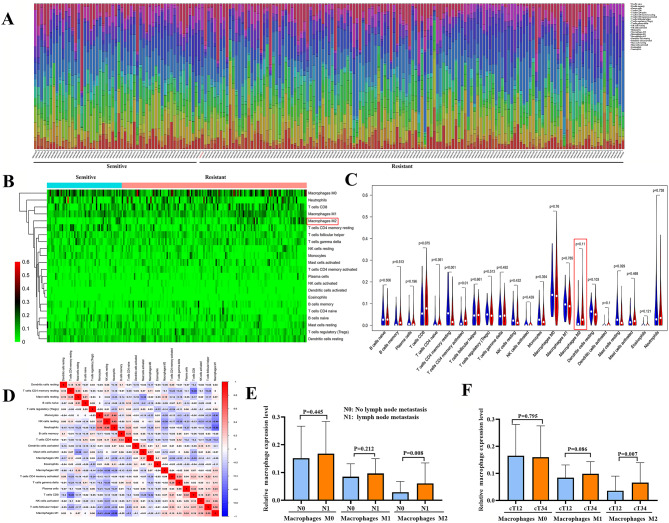
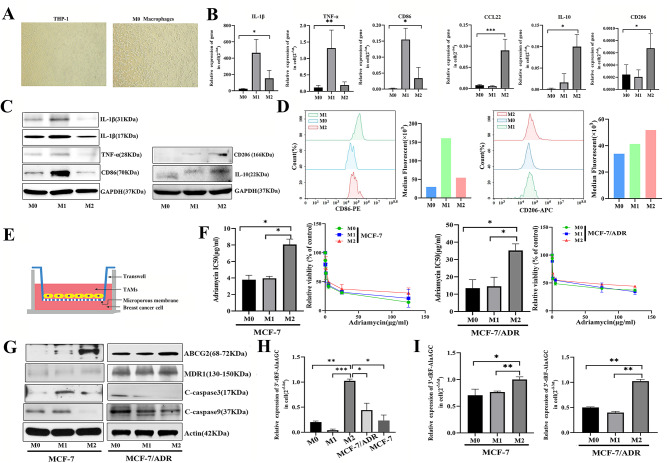
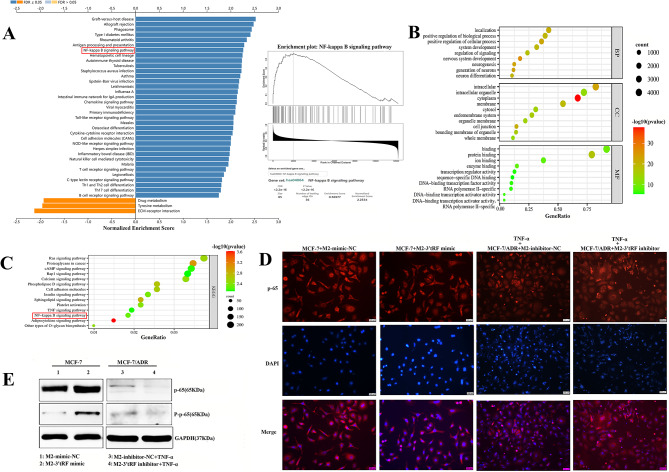
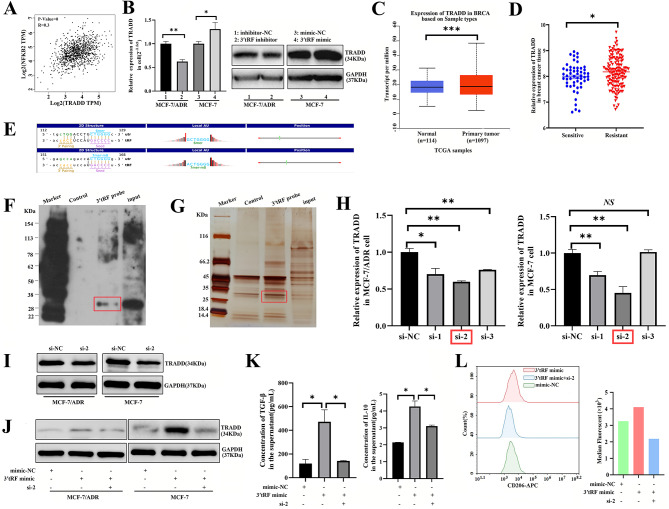
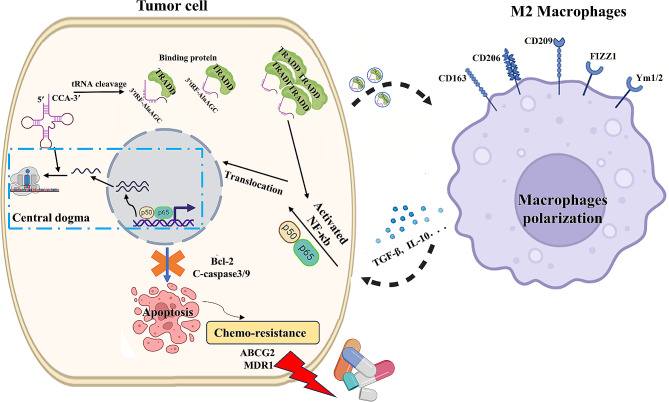
Methods: The high-throughput sequencing technique was used to screen tDRs expression profile in BC cells. Gain- and loss-of-function experiments and xenograft models were performed to verify the biological function of 3'tRF-Ala-AGC in BC cells. The CIBERSORT algorithm was used to investigate immune cell infiltration in BC tissues. To explore the role of 3'tRF-Ala-AGC in macrophages, M2 macrophages transfected with 3'tRF-Ala-AGC mimic or inhibitor were co-cultured with BC cells. Effects on Nuclear factor-κb (NF-κb) pathway were investigated by NF-κb nuclear translocation assay and western blot analysis. RNA pull-down assay was performed to identify 3'tRF-Ala-AGC interacting proteins.

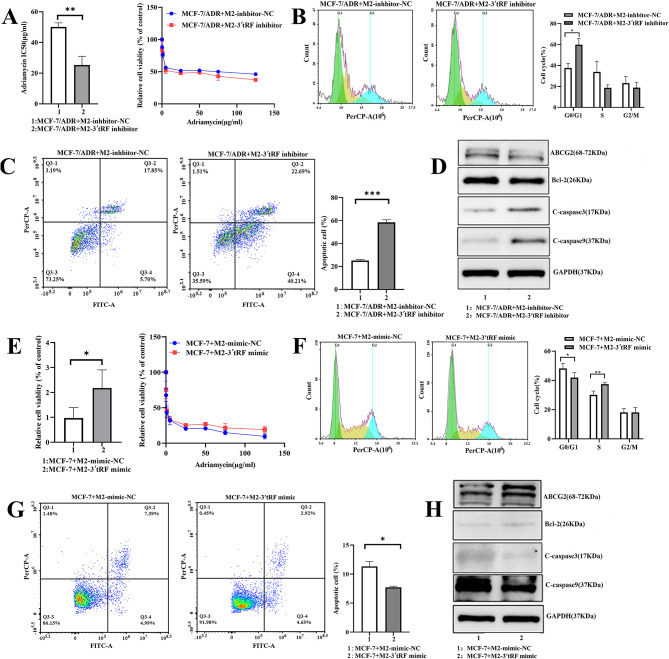
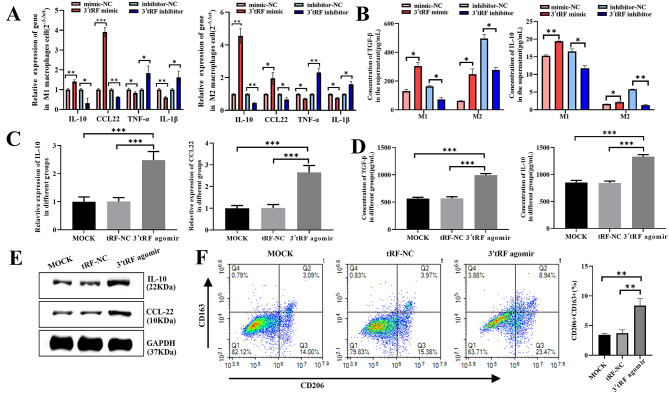
Results: A 3'tRF fragment of 3'tRF-AlaAGC was screened, which is significantly overexpressed in BC specimens and Adriamycin-resistant cells. 3'tRF-AlaAGC could promote cell malignant activity and facilitate M2 polarization of macrophages in vitro and in vivo. Higher expression of M2 macrophages were more likely to have lymph node metastasis and deeper invasion in BC patients. Mechanistically, 3'tRF-AlaAGC binds Type 1-associated death domain protein (TRADD) in BC cells, and suppression of TRADD partially abolished the enhanced effect of 3'tRF-AlaAGC mimic on phenotype of M2. The NF-κb signaling pathway was activated in BC cells co-cultured with M2 macrophages transfected with 3'tRF-AlaAGC mimic.

Conclusions: 3'tRF-AlaAGC might modulate macrophage polarization via binding to TRADD and increase the effect of M2 on promoting the chemoresistance in BC cells through NF-κb signaling pathway.

Keywords: 3′tRF-AlaAGC; Breast cancer; Chemoresistance; Macrophages polarization; NF-κb signaling pathway; TRADD.


Conflict of interest statement

The authors declare no potential conflicts of interest.

Figures

Fig. 1
Fig. 1
tDRs are associated with Adriamycin resistance in breast cancer. A The CCK-8 toxicity confirming the IC50 value in MCF-7 and MCF-7/ADR cells. B Western blot analysis for ABCG2, MDR1, cleaved caspase-9 and Bcl-2 in breast cancer cells. C The scatter plot between two groups for tDRs. D The heatmap of 73 candidate tumor-related differential tDRs. E Ten tDRs between the two groups, of which 6 were up-regulated and 4 were down-regulated in MCF-7/ADR cells. F RT-PCR was used to verify 10 different tDRs in two cell lines. G The biological characteristics of tRF-58-75-Ala-AGC-1 in UCSC and MINTbase database. H Dissolution curve and amplification curve of tRF-58-75-Ala-AGC-1. I The product of qRT-PCR was confirmed by Sanger sequencing. J Scatter plot representation of tRF-58-75-Ala-AGC-1 level in serum of breast cancer patients. *P < 0.05, **P < 0.01
Fig. 2
Fig. 2
3′tRF-AlaAGC suppressed chemosensitivity of breast cancer. A The CCK-8 toxicity confirming the IC50 value in MCF-7/ADR cells transfected 3′tRF-AlaAGC inhibitor. B Colony formation assays in cells transfected 3′tRF-AlaAGC inhibitor. C, D The flow cytometry assays were performed to detected the cell cycle and cell apoptosis ability. E-H The cell function assays in MCF-7 cells transfected 3′tRF-AlaAGC mimic. I Images of MCF-7/ADR xenografts in vivo and quantification of bodyweight of nude mice. J Images of excised tumors from mice after the 10th injection of the reagent and quantification of xenografts tumor volume and weight. K The western blot assay detected the level of cleaved caspase-3, cleaved caspase-9 and Bcl-2. L Tumor tissue slices were stained with hematoxylin-eosin and TUNEL assay in the three groups. M, N Western blot analysis and immunohistochemistry demonstrated the level of ABCG2 and MDR1. *P < 0.05, **P < 0.01, ***P < 0.001. 3′ tRF: 3′ tRF-AlaAGC
Fig. 3
Fig. 3
The landscape of immune infiltration in breast cancer tissues. A The histogram shows the relative expression of 22 subpopulations of immune cells in each tissue sample. B The heatmap reveals the differential expression of different immune cells in sensitive and resistant tissues. C Violin diagram was used to analyze the expression difference of 22 subpopulations of immune cells in the two groups. D Correlation heat map shows the correlation analysis of immune cells. E The relationship between the relative expression of macrophages with different phenotypes and lymph node metastasis of breast cancer. F The relationship between the relative expression of macrophages and the clinical stage of breast cancer
Fig. 4
Fig. 4
M2 macrophages promoted the chemoresistance of breast cancer. A Representative image (200×) of morphology in THP-1 cells and macrophages. B RT-PCR detection of IL-1β, TNF-α, CD86, CCL22, IL-10 and CD206 mRNA expression in M0, M1 and M2 macrophages. C Western blot assay analyzed the protein level of IL-1β, TNF-α, CD86, CD206 and IL-10 in macrophages. D Flow cytometry detected the markers of M1 macrophages (CD86) and M2 macrophages (CD206). E Schematic diagram of co-culture of breast cancer cells and macrophages. F CCK8 assay was used to detect the viability of MCF-7 and MCF-7/ADR cells co-culture with macrophages. G The protein levels of ABCG2, MDR1, cleaved caspase-3 and cleaved caspase-9 in MCF-7 and MCF-7/ADR cells co-cultured with macrophages. H The expression level of 3′tRF-AlaAGC in macrophages and breast cancer cells. I The expression level of 3′tRF-AlaAGC in MCF-7 and MCF-7/ADR cells co-cultured with macrophages. *P < 0.05, **P < 0.01, ***P < 0.001. TAM: Tumor associated macrophages, M0: M0 macrophages, M1: M1 macrophages, M2: M2 macrophages
Fig. 5
Fig. 5
M2 macrophages treated with 3′tRF-AlaAGC regulated chemoresistance of breast cancer cells. A The CCK-8 toxicity confirming the IC50 value in MCF-7/ADR cells co-cultured with M2 macrophages transfected with 3′tRF-AlaAGC inhibitor. B, C The flow cytometry assays were performed to detected the cell cycle and cell apoptosis ability in MCF-7/ADR cells co-cultured with M2 macrophages transfected with 3′tRF-AlaAGC inhibitor. D Western blot assay analyzed the protein level. E-H The cell function assays in MCF-7 cells co-cultured with M2 macrophages transfected with 3′tRF-AlaAGC mimic. *P < 0.05, **P < 0.01, ***P < 0.001. 3′ tRF: 3′ tRF-Ala-AGC, M2: M2 macrophages
Fig. 6
Fig. 6
3′ tRF induced M2 polarization of macrophages A Real-time PCR detection of IL-10, CCL22, TNF-α and IL-1β expression in M1 and M2 macrophages transfected with 3′tRF-Ala-AGC mimic or inhibitor, U6 were used as the control. B The concentration of TGF-β and IL-10 in supernatants of M1 and M2 transfected with 3′tRF-AlaAGC mimic or inhibitor. C The mRNA levels of IL-10 and CCL22 in the subcutaneous tumor tissue of mice. D The concentration of TGF-β and IL-10 in mice serum. E The protein levels of IL-10 and CCL22 in the subcutaneous tumor tissue of mice. F Flow cytometry was used to quantify the expression of CD206 and CD163. *P < 0.05, **P < 0.01, ***P < 0.001. 3′ tRF: 3′ tRF-Ala-AGC, M1: M1 macrophages, M2: M2 macrophages
Fig. 7
Fig. 7
M2 macrophages treated with 3′tRF-AlaAGC regulated chemoresistance of breast cancer cells through NF-κb signaling. A GSEA Analysis of differential Expression of NF-κb pathway signal in drug resistant and sensitive breast cancer tissues. B GO analysis of the DEGs-3′-tRF-AlaAGC target genes. C KEGG pathway analysis showed that the 14 related pathways changed significant in breast cancer cells. D Effects on NF-κb pathway was detected using the NF-κb Activation Nuclear Translocation Assay Kit. E Western blot assay analyzed the protein level of p-65 and P-p-65. 3′ tRF: 3′ tRF-AlaAGC, M2: M2 macrophages
Fig. 8
Fig. 8
3′tRF-AlaAGC regulated M2 polarization of macrophages in a TRADD-mediated manner. A The expression correlation of TRADD and NF-κb in clinical breast cancer specimens. B The mRNA and protein expression level of TRADD in cells transfected with 3′tRF-AlaAGC inhibitor or mimic. C The levels of TRADD between cancer and normal samples in TCGA database. D The levels of TRADD between chemo-sensitive and chemo-resistant tissues. E The 3′UTR area of TRADD combined with 3′tRF-AlaAGC. F Western blot analysis of products from RNA pull-down assays using the 3′tRF-AlaAGC probe suggested TRADD in MCF-7/ADR cells. G Silver SDS-PAGE gel image shows proteins immunoprecipitated by the 3′tRF-AlaAGC probe in MCF-7/ADR cells. H The mRNA expression levels of TRADD in cells transfected with TRADD siRNA. I Protein levels in cells transfected with si-TRADD and negative control. J Western blot analysis was used to detect TRADD expression in cells transfected with 3′tRF-AlaAGC, si-TARDD or negative control. K The amounts of TGF-β and IL-10 in the supernatants of 3′tRF-AlaAGC mimic and si-TRADD co-transfected M2 macrophages determined by ELISA. L The level of CD206 was detected by flow cytometry. *P < 0.05, **P < 0.01, ***P < 0.001. 3′ tRF: 3′ tRF-AlaAGC, si-2: si-TRADD-2
Fig. 9
Fig. 9
Proposed working model 3′tRF-AlaAGC might modulate macrophage polarization via binding to TRADD and increase the effect of M2 macrophage on promoting the chemoresistance of BC cells through NF-κb signaling pathway

References

    1. Sung H, Ferlay J, Siegel RL et al. Global Cancer Statistics. 2020: GLOBOCAN Estimates of Incidence and Mortality Worldwide for 36 Cancers in 185 Countries. CA: a cancer journal for clinicians 2021, 71(3):209–249. - PubMed
    1. Christowitz C, Davis T, Isaacs A, et al. Mechanisms of doxorubicin-induced drug resistance and drug resistant tumour growth in a murine breast tumour model. BMC Cancer. 2019;19(1):757. 10.1186/s12885-019-5939-z - DOI - PMC - PubMed
    1. Mattioli R, Ilari A, Colotti B, et al. Doxorubicin and other anthracyclines in cancers: activity, chemoresistance and its overcoming. Mol Aspects Med. 2023;93:101205. 10.1016/j.mam.2023.101205 - DOI - PubMed
    1. Jamialahmadi K, Zahedipour F, Karimi G. The role of microRNAs on doxorubicin drug resistance in breast cancer. J Pharm Pharmacol. 2021;73(8):997–1006. 10.1093/jpp/rgaa031 - DOI - PubMed
    1. Yao N, Fu Y, Chen L, et al. Long non-coding RNA NONHSAT101069 promotes epirubicin resistance, migration, and invasion of breast cancer cells through NONHSAT101069/miR-129-5p/Twist1 axis. Oncogene. 2019;38(47):7216–33. 10.1038/s41388-019-0904-5 - DOI - PubMed

LinkOut - more resources