Diversity, composition and potential roles of sedimentary microbial communities in different coastal substrates around subtropical Okinawa Island, Japan
- PMID: 39080706
- PMCID: PMC11290285
- DOI: 10.1186/s40793-024-00594-1
Diversity, composition and potential roles of sedimentary microbial communities in different coastal substrates around subtropical Okinawa Island, Japan
Abstract
Background: Marine benthic prokaryotic communities play crucial roles in material recycling within coastal environments, including coral reefs. Coastal sedimentary microbiomes are particularly important as potential reservoirs of symbiotic, beneficial, and pathogenic bacteria in coral reef environments, and therefore presumably play a core role in local ecosystem functioning. However, there is a lack of studies comparing different environments with multiple sites on the island scale, particularly studies focusing on prokaryotic communities, as previous investigations have focused mainly on a single site or on specific environmental conditions. In our study, we collected coastal sediments from seven sites around Okinawa Island, Japan, including three different benthic types; sandy bottoms, seagrass meadows, and hard substratum with living scleractinian corals. We then used metabarcoding to identify prokaryotic compositions and estimate enzymes encoded by genes to infer their functions.
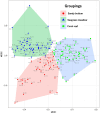
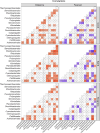
Results: The results showed that the three substrata had significantly different prokaryotic compositions. Seagrass meadow sites exhibited significantly higher prokaryotic alpha-diversity compared to sandy bottom sites. ANCOM analysis revealed that multiple bacterial orders were differentially abundant within each substratum. At coral reef sites, putative disease- and thermal stress-related opportunistic bacteria such as Rhodobacterales, Verrucomicrobiales, and Cytophagales were comparatively abundant, while seagrass meadow sites abundantly harbored Desulfobacterales, Steroidobacterales and Chromatiales, which are common bacterial orders in seagrass meadows. According to our gene-coded enzyme analyses the numbers of differentially abundant enzymes were highest in coral reef sites. Notably, superoxide dismutase, an important enzyme for anti-oxidative stress in coral tissue, was abundant at coral sites. Our results provide a list of prokaryotes to look into in each substrate, and further emphasize the importance of considering the microbiome, especially when focusing on environmental conservation.
Conclusion: Our findings prove that prokaryotic metabarcoding is capable of capturing compositional differences and the diversity of microbial communities in three different environments. Furthermore, several taxa were suggested to be differentially more abundant in specific environments, and gene-coded enzymic compositions also showed possible differences in ecological functions. Further study, in combination with field observations and temporal sampling, is key to achieving a better understanding of the interactions between the local microbiome and the surrounding benthic community.
Keywords: Bioindicator; Coral reefs; Prokaryotic community; Sandy bottoms; Seagrass meadows.
© 2024. The Author(s).
Conflict of interest statement
The authors declare no competing interests.
Figures


Similar articles
-
Hydroids (Cnidaria, Hydrozoa) from Mauritanian Coral Mounds.Zootaxa. 2020 Nov 16;4878(3):zootaxa.4878.3.2. doi: 10.11646/zootaxa.4878.3.2. Zootaxa. 2020. PMID: 33311142
-
Seagrasses and local environment control the bacterial community structure and carbon substrate utilization in brackish sediments.J Environ Manage. 2022 Jul 15;314:115013. doi: 10.1016/j.jenvman.2022.115013. Epub 2022 Apr 18. J Environ Manage. 2022. PMID: 35447445
-
Monitoring of coastal coral reefs near Dahab (Gulf of Aqaba, Red Sea) indicates local eutrophication as potential cause for change in benthic communities.Environ Monit Assess. 2015 Feb;187(2):44. doi: 10.1007/s10661-014-4257-9. Epub 2015 Jan 31. Environ Monit Assess. 2015. PMID: 25637388
-
Kenya.Mar Pollut Bull. 2001 Dec;42(12):1264-78. doi: 10.1016/s0025-326x(01)00241-7. Mar Pollut Bull. 2001. PMID: 11827110 Review.
-
Benthic N2 fixation in coral reefs and the potential effects of human-induced environmental change.Ecol Evol. 2014 May;4(9):1706-27. doi: 10.1002/ece3.1050. Epub 2014 Mar 31. Ecol Evol. 2014. PMID: 24967086 Free PMC article. Review.
Cited by
-
Environmental DNA analysis at multiple taxonomic levels highlights geographic variation in subtropical coastal marine communities.Sci Rep. 2025 Jul 1;15(1):20791. doi: 10.1038/s41598-025-05106-w. Sci Rep. 2025. PMID: 40594049 Free PMC article.
-
Identification of deposits from modern and ancient large tsunamis by means of environmental DNA.Sci Rep. 2025 Jan 2;15(1):242. doi: 10.1038/s41598-024-84245-y. Sci Rep. 2025. PMID: 39747516 Free PMC article.
References
Grants and funding
LinkOut - more resources
Full Text Sources
