. 2021 Jun 24;7(7):104.
doi: 10.3390/jimaging7070104.

Unsupervised Foreign Object Detection Based on Dual-Energy Absorptiometry in the Food Industry

Affiliations

Unsupervised Foreign Object Detection Based on Dual-Energy Absorptiometry in the Food Industry

Vladyslav Andriiashen et al. J Imaging. .

Abstract

X-ray imaging is a widely used technique for non-destructive inspection of agricultural food products. One application of X-ray imaging is the autonomous, in-line detection of foreign objects in food samples. Examples of such inclusions are bone fragments in meat products, plastic and metal debris in fish, and fruit infestations. This article presents a processing methodology for unsupervised foreign object detection based on dual-energy X-ray absorptiometry (DEXA). A novel thickness correction model is introduced as a pre-processing technique for DEXA data. The aim of the model is to homogenize regions in the image that belong to the food product and to enhance contrast where the foreign object is present. In this way, the segmentation of the foreign object is more robust to noise and lack of contrast. The proposed methodology was applied to a dataset of 488 samples of meat products acquired from a conveyor belt. Approximately 60% of the samples contain foreign objects of different types and sizes, while the rest of the samples are void of foreign objects. The results show that samples without foreign objects are correctly identified in 97% of cases and that the overall accuracy of foreign object detection reaches 95%.

Keywords: X-ray; absorptiometry; dual-energy; foreign object detection.


Conflict of interest statement

The authors declare no conflict of interest.

Figures

Figure 1
Figure 1
Diagram of the foreign object inspection procedure. The input is two projections of the sample acquired with different voltages of the tube. The blue curve on the images approximately shows the sample boundary. The segmentation image uses green color for pixels that were incorrectly classified as a defect, red for not detected foreign object pixels and yellow for detected pixels of the defect.
Figure 2
Figure 2
Correlation between the absorption of skeletal muscle for the X-ray tube voltages of 40 and 90 kV (a). The ratio between the attenuation rate is drawn as a function of thickness. The ratio is not constant due to a polychromatic spectrum (b).
Figure 3
Figure 3
Sample scan with low exposure (0.5 s per projection): combined image computed according to Equation (5) (a) and the dependency of its values on the single projection intensity (b).
Figure 4
Figure 4
Sample scan with high exposure (5 s per projection): combined image computed according to Equation (5) (a) and the dependency of its values on the single projection intensity (b).
Figure 5
Figure 5
Stages of the scan data pre-processing: R(x) computed according to Equation (5) (a), R(x) defined by Equation (7) (b), combined image after correction and normalization computed according to Equation (8) (c). The sample is a chicken fillet with a fan bone scanned with an exposure time of 0.5 s.
Figure 6
Figure 6
Different examples of the segmentation with different values of penalty weights applied to the N(x) image after pre-processing shown on Figure 5c. The panel (a) shows a segmentation with low values of penalty weights μ=1, ν=1, where many noisy outliers are marked as bone fragments. This effect can be reduced by changing the weights as shown on panel (b) corresponding to μ=5, ν=1. High values of penalties, such as μ=20, ν=5 on panel (c) might lead to a safe segmentation excluding a significant fraction of the bone.
Figure 7
Figure 7
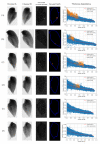
Different samples from the experimental dataset. For every object, two projections acquired with different voltages, the N(x) distribution, the segmented image, and the thickness dependency plot are shown. Sample (a) contains a fan bone, sample (b) has a large rib bone, cases (c,d) show small rib bones, and samples (e,f) do not contain defects. The boundaries of the samples are approximately drawn as blue curves, but they are not used during the inspection procedure. The defect location is marked in orange and corresponds to the ground truth images from the dataset. Ground truth in sample (d) is partially wrong and does not include the second part of the shattered bone.
Figure 8
Figure 8
Dependency of F1-score on length penalty μ and area penalty ν for different tasks: image segmentation (a) and foreign object detection (b). For segmentation, the F1-score is computed using a ground truth segmentation known for every sample and averaged over all images from the dataset containing a defect. For detection, the metric is calculated on a sample level for the entire dataset consisting of the objects with and without a bone.
Figure 9
Figure 9
Defect segmentation F1-score for every class of defect in the dataset: fan bone, large rib bone, and small rib bone. The F1 value is averaged over all samples with a corresponding defect type.

References

    1. Chen Z., Tao Y., Chen X. Multiresolution local contrast enhancement of X-ray images for poultry meat inspection. Appl. Opt. 2001;40:1195–1200. doi: 10.1364/AO.40.001195. - DOI - PubMed
    1. Kwon J.S., Lee J.M., Kim W.Y. Real-time detection of foreign objects using X-ray imaging for dry food manufacturing line; Proceedings of the 2008 IEEE International Symposium on Consumer Electronics; Vilamoura, Portugal. 14–16 April 2008; pp. 1–4.
    1. Kotwaliwale N., Singh K., Kalne A., Jha S.N., Seth N., Kar A. X-ray imaging methods for internal quality evaluation of agricultural produce. J. Food Sci. Technol. 2014;51:1–15. doi: 10.1007/s13197-011-0485-y. - DOI - PMC - PubMed
    1. van Dael M., Lebotsa S., Herremans E., Verboven P., Sijbers J., Opara U., Cronje P., Nicolaï B. A segmentation and classification algorithm for online detection of internal disorders in citrus using X-ray radiographs. Postharvest Biol. Technol. 2016;112:205–214. doi: 10.1016/j.postharvbio.2015.09.020. - DOI
    1. Chuang C.L., Ouyang C.S., Lin T.T., Yang M.M., Yang E.C., Huang T.W., Kuei C.F., Luke A., Jiang J.A. Automatic X-ray quarantine scanner and pest infestation detector for agricultural products. Comput. Electron. Agric. 2011;77:41–59. doi: 10.1016/j.compag.2011.03.007. - DOI

LinkOut - more resources