. 2024 Jul 16:15:1429909.
doi: 10.3389/fimmu.2024.1429909. eCollection 2024.

A viral vaccine design harnessing prior BCG immunization confers protection against Ebola virus

Affiliations

A viral vaccine design harnessing prior BCG immunization confers protection against Ebola virus

Tony W Ng et al. Front Immunol. .

Abstract

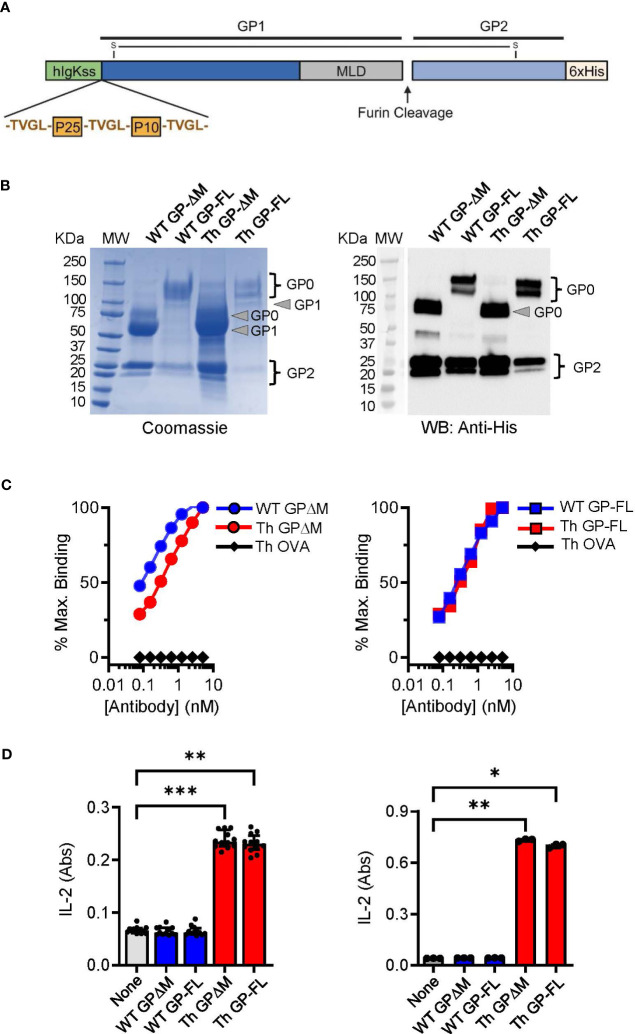
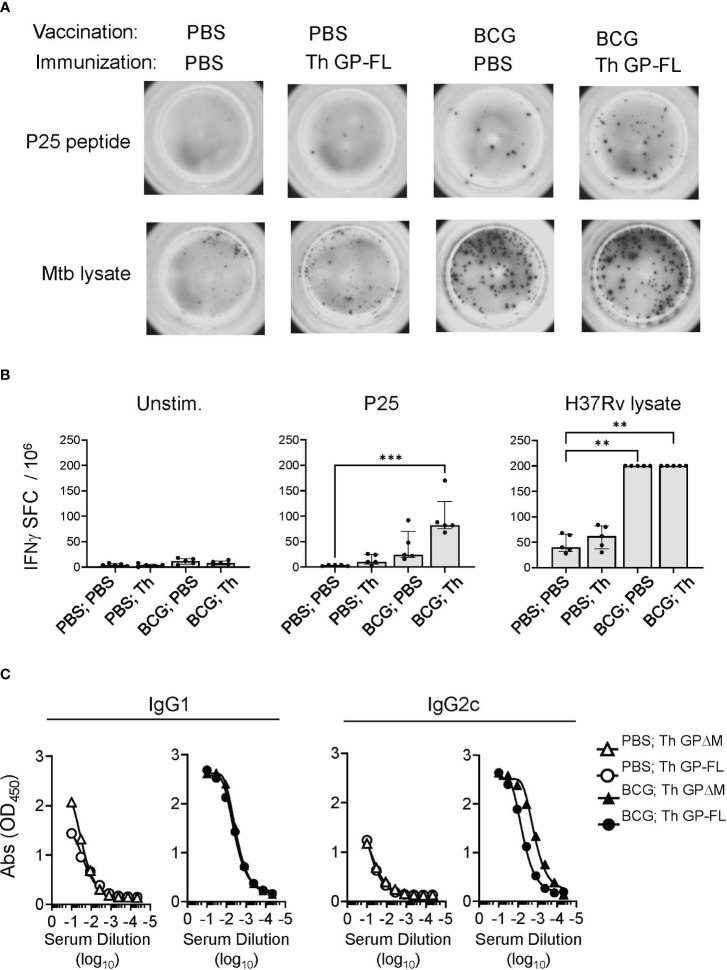
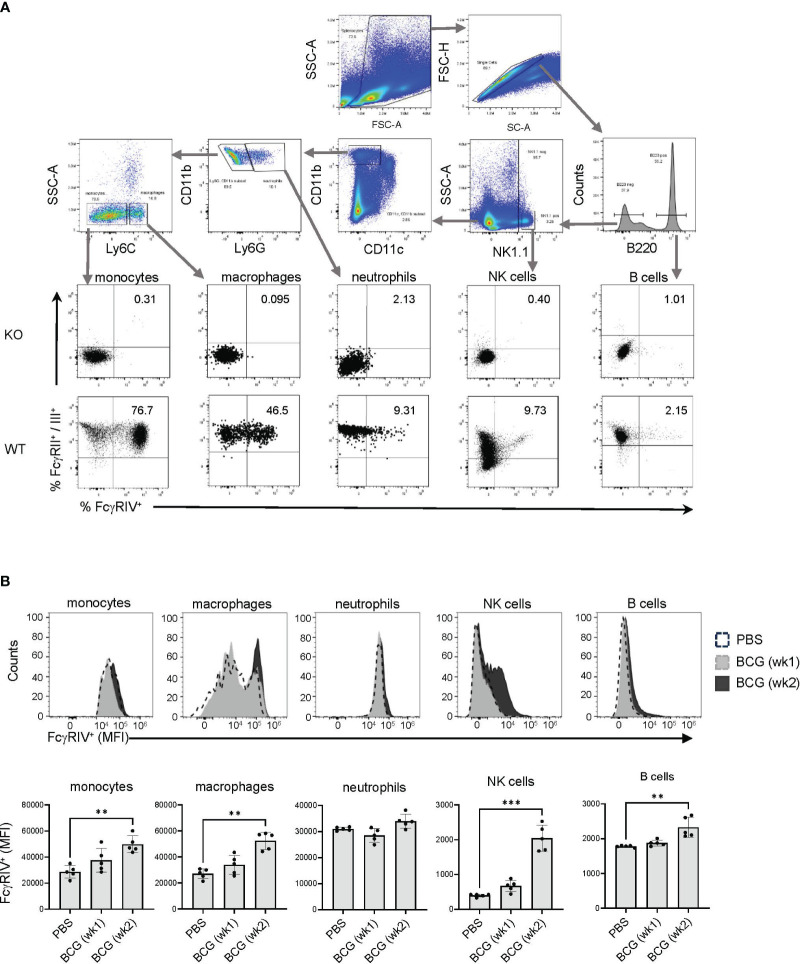
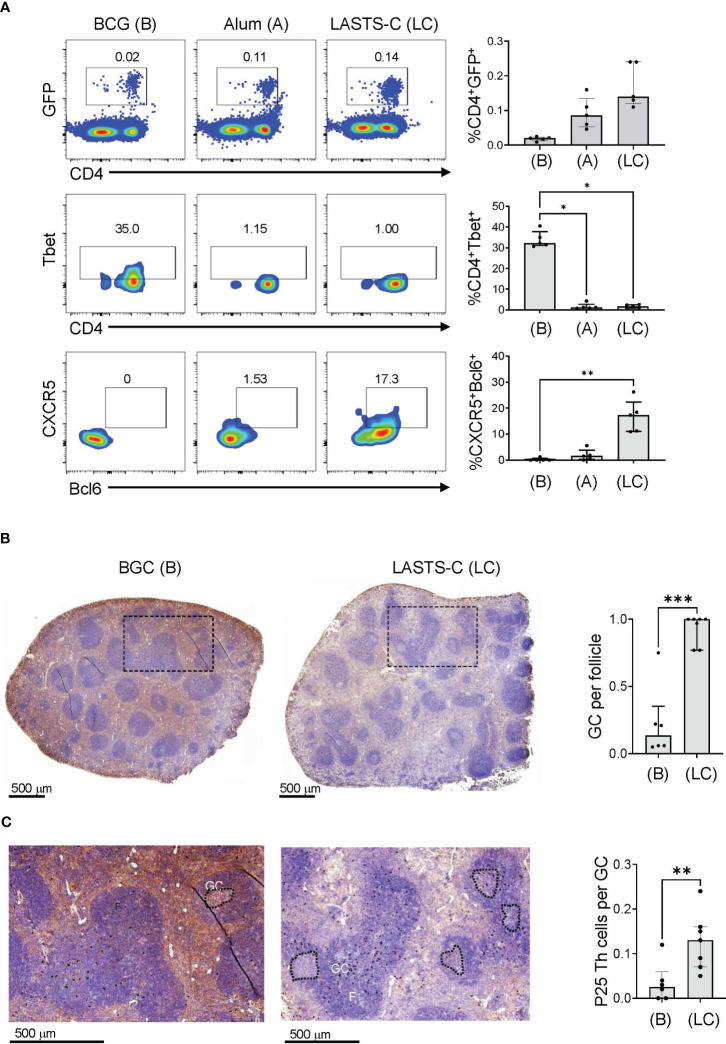
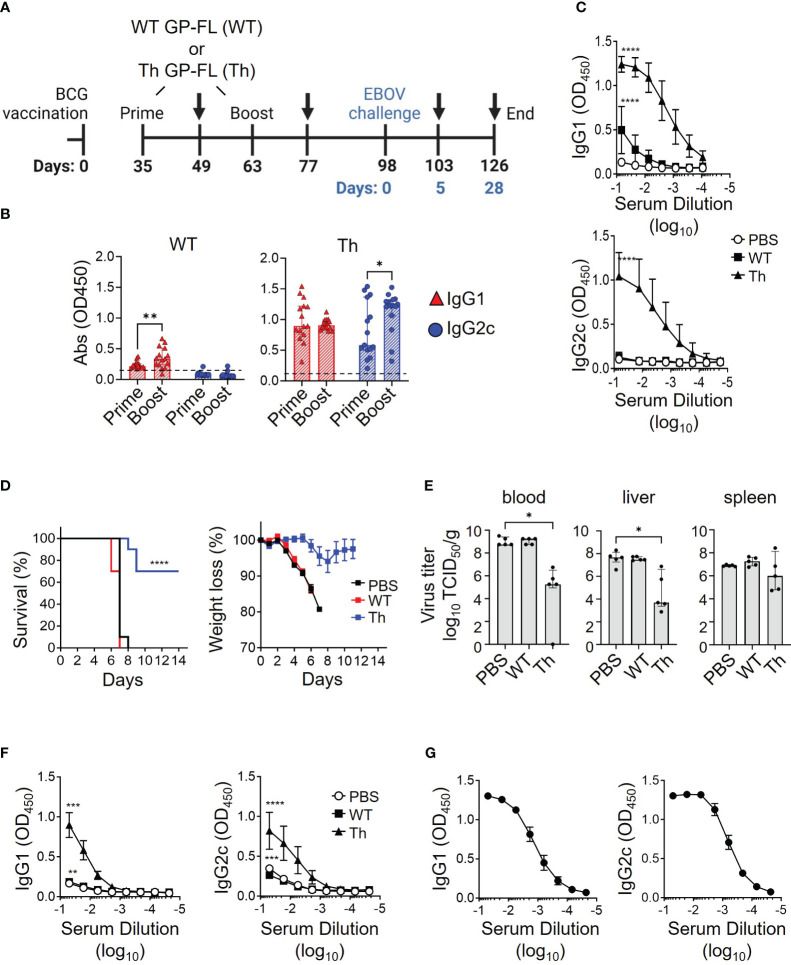
Previous studies have demonstrated the efficacy and feasibility of an anti-viral vaccine strategy that takes advantage of pre-existing CD4+ helper T (Th) cells induced by Mycobacterium bovis bacille Calmette-Guérin (BCG) vaccination. This strategy uses immunization with recombinant fusion proteins comprised of a cell surface expressed viral antigen, such as a viral envelope glycoprotein, engineered to contain well-defined BCG Th cell epitopes, thus rapidly recruiting Th cells induced by prior BCG vaccination to provide intrastructural help to virus-specific B cells. In the current study, we show that Th cells induced by BCG were localized predominantly outside of germinal centers and promoted antibody class switching to isotypes characterized by strong Fc receptor interactions and effector functions. Furthermore, BCG vaccination also upregulated FcγR expression to potentially maximize antibody-dependent effector activities. Using a mouse model of Ebola virus (EBOV) infection, this vaccine strategy provided sustained antibody levels with strong IgG2c bias and protection against lethal challenge. This general approach can be easily adapted to other viruses, and may be a rapid and effective method of immunization against emerging pandemics in populations that routinely receive BCG vaccination.

Keywords: CD4+ T cells; Ebola virus; Fc receptors; Mycobacterium bovis BCG; antibodies; intrastructural help; vaccines.


Conflict of interest statement

The authors declare that the research was conducted in the absence of any commercial or financial relationships that could be construed as a potential conflict of interest.

Figures

Figure 1
Figure 1
Characterization and comparison of EBOV GP vaccines. (A) Schematic of the Th GP-FL vaccine against EBOV. The Th vaccine consist of the N-terminal human Ig-kappa signal sequence (hIgKss), the BCG T helper epitopes (P25 and P10) which are flanked by the cathepsin B cleavage site (TVGL), GP1 which includes the mucin-like domain (MLD), the furin cleavage site, GP2, and the C-terminal hexahistadine tag (6xHis). GP1 and GP2 are held together by a disulfide bond. For the WT GP-FL version of the vaccine, the BCG T helper epitopes (P25 and P10) flanked by the cathepsin B cleavage sites are absent. The MLD deleted versions of these vaccines were also constructed (Th GPΔM and WT GPΔM). (B) SDS-PAGE under reducing conditions of purified EBOV GPs as shown by Coomassie gel staining and Western blotting with anti-His antibody. The GP1 and GP2 fragments, which are normally held together by disulfide bonds, were separately resolved under the reducing and denaturing conditions of the SDS-PAGE analysis. The expected size for GP2, which consists of the C terminal region of the EBOV GP after the MLD is 25 KDa. The expected size for the GP1 precursor is 120 KDa and 60 KDa for the full length and the MLD deleted version of the EBOV GP, respectively. The GP0 fragment in the full-length versions of the GP constructs was detected as two or more bands of ~120-145 KDa, consistent with glycosylation and disordered structure of the MLD. Purity of isolated GPs was ≥ 90% based on Coomassie blue staining of the gels, and protein yields were determined by BCA protein assay (WT GP-ΔM: 2060 μg/ml, WT GP-FL: 220 μg/ml, Th GP-ΔM: 2972 μg/ml, Th GP-FL: 80 μg/ml). (C) ELISA with antibody ADI-15878 specific for EBOV GP conformational epitope was used to probe purified EBOV GPs. The ovalbumin version of the Th vaccine (Th OVA) served as a negative control to show the specificity of ADI-15878 antibody against EBOV GP. (D) Processing and presentation of BCG Th epitopes was shown by incubating purified EBOV GPs for 16 hours with dendritic cells and in the presence of a CD4+ T cell hybridomas specific for P25 of Ag85B (left) or P10 of TB9.8 (right). Supernatants were analyzed by sandwich ELISA for IL-2 (indicated as absorbance (Abs) values for conversion of the assay substrate. Multiple columns were analyzed by Kruskal-Wallis one-way ANOVA, followed by Dunn’s multiple comparison test; (***p < 0.001, **p < 0.01, *p < 0.05).
Figure 2
Figure 2
Induction of cellular and humoral immune responses by Th vaccines. For analysis of cellular responses, groups of mice (n = 5) were vaccinated with BCG or received sham vaccination with PBS injection, rested for 17 weeks and then immunized with the Th GP-FL or sham immunized (PBS). Two weeks after the immunization, IFNγ ELISPOT assays were performed on unstimulated, peptide-25 (P25) or Mtb (H37Rv lysate) stimulated splenocytes. (A) Representative spot forming cell (SFC) images of selected animals for each group. (B) Plots showing individual animal counts and group medians with interquartile range. Multiple columns were analyzed by Kruskal-Wallis one-way ANOVA, followed by Dunn’s multiple comparison test; (***p < 0.001 and **p < 0.01). Note that values for H37Rv lysate stimulation of BCG vaccinated groups are all plotted at the upper limit for accurate quantitation in the assay. (C) Mice (n = 5) were vaccinated with BCG or received sham vaccination with PBS injection, rested for 5 weeks and then prime and boosted with the EBOV GP vaccines (Th GP-FL or Th GPΔM). Two weeks after the boost, sera were collected, and antibody titers against EBOV GP (WT FL) were determined using ELISA specific for IgG1 or IgG2c isotypes.
Figure 3
Figure 3
Expression of FcγRIV increases at week 2 after BCG vaccination. (A) Flow cytometry gating strategy using mice with compound genetic knock out of FcγRII, RIII and RIV α-chains (KO) and wildtype (WT) C57BL/6 mice to determine the gating for FcγRII/III and FcγRIV expression on immune cells. After singlet cell gating, the corresponding surface markers were used to stain splenocytes to identify the following immune cells: monocytes (CD11b+ Ly6Clow), macrophages (CD11b+ Ly6Chigh), neutrophils (CD11b+ Ly6G+), NK cells (NK1.1+), and B cells (B220+). (B) Mice (C57BL/6) were vaccinated with 107 BCG per mouse or received PBS injections as control. Spleens were harvested at week 1 after BCG vaccination (gray histogram), or at week 2 after PBS injection (white histogram) or BCG (black histogram) vaccination, and splenocytes were analyzed by FACS to determine the expression level of FcγRIV. Top panel shows representative histograms for an individual mouse from each group, and bottom panel shows median of MFI values for 5 mice in each group on each indicated cell type. Median with interquartile range for five replicates is shown and results were analyzed using Kruskal-Wallis one way ANOVA nonparametric test and Dunn’s multiple comparison test; (***p < 0.001, **p < 0.01).
Figure 4
Figure 4
BCG-induced FcγRIV expression was maintained after Th vaccination. Mice (n = 10) were sham vaccinated with PBS or with BCG at 107 CFU per mouse and rested for 17 weeks. Each group was further subdivided into 2 groups (n =5) and received either PBS or the Th GP-FL vaccine at 0.05 μg per mouse in alum, and splenocytes were harvested 2 weeks later to determine the level of FcγRIV expression by FACS. Singlet gating on splenocytes were stained for macrophages (CD11bhigh Ly6Chigh), neutrophils (CD11bhigh Ly6Ghigh), and NK cells (NK1.1high) for expression of FcγRIV (CD16.2) as shown in (A) for representative animals of sham vaccinated with PBS and with BCG alone, and quantified in (B) by MFI levels for the 5 animals in each group. The median with interquartile is shown and analyzed using Kruskal-Wallis one way ANOVA nonparametric test with and Dunn’s multiple comparison test; (**p < 0.01 and *p < 0.05).
Figure 5
Figure 5
Long lasting humoral immune response induced by the Th vaccine. (A) Serum samples from sham PBS (□) or BCG (●) vaccinated mice and subsequently immunized once with 5 μg of the Th GP-FL vaccine were analyzed by ELISA for anti-EBOV GP IgG1 (left panel) or IgG2c (right panel) antibodies throughout the time course of 39 weeks. Serum from a naïve mouse (⨂) collected at week 2 and 4 was used to measure the background level for the ELISA assay. (B) Splenocytes and bone marrow cell suspensions from these mice at 39 weeks were harvested and used for B cell ELISPOT assay to quantitate anti-EBOV GP IgG1 or IgG2c antibody secreting spot forming cells (SFCs). The median values with interquartile ranges are shown and analyzed using Kruskal-Wallis one way ANOVA nonparametric test with Dunn’s multiple comparison test; (*p < 0.05, **p < 0.01, ***p< 0.001).
Figure 6
Figure 6
BCG vaccination promotes predominantly Th1 responses. (A) Wildtype mice were adoptively transferred with 4 x 10⁴ T cells purified from P25 TCR-Tg GFP+ mice 16 hours prior to vaccination with BCG (B), or peptide-25 adjuvanted with either alum (A) or LASTS-C (LC). The mice were sacrificed 6 days after vaccination, and splenocytes (n=5) were analyzed by FACS for master transcription regulators and key markers for Th1 (Tbet) and Tfh (CXCR-5 and Bcl-6). Multiple comparisons were analyzed by Kruskal-Wallis one-way ANOVA (**p < 0.01, ***p < 0.001). (B) Wildtype mice were adoptively transferred with 4 x 10⁴ T cells purified from P25 TCR-Tg GFP+ mice 16 hours prior to vaccination with BCG or with the P25 peptide adjuvanted with LASTS-C. Formalin-fixed and paraffin-embedded spleens were cut into thin sections for immunocytochemistry with anti-GFP followed by hematoxylin and eosin counterstaining. (C) High magnification of boxed areas in (B) to visualize the P25 specific T cells as dark colored spots. Follicles (F), germinal centers (GC), and P25 Th cells were quantified manually by a blinded observer as the number of GC per follicle in (B), and the number of P25 Th cells per GC in (C). Medians with interquartile ranges for 6-7 sections derived from 3 mice from each group are plotted. Mann-Whitney test was used for pairwise comparison (*p < 0.05, **p < 0.01, ***p < 0.001).
Figure 7
Figure 7
Vaccine induced protection against lethal EBOV infection. (A) Timeline of the EBOV challenge experiment. C57BL/6NHsd mice (n = 15) were vaccinated with BCG, and subsequently primed and boosted with 0.05 μg of the indicated recombinant protein vaccine (WT GP-FL or the Th GP-FL) in alum as indicated in the schematic. MA-EBOV infection (i.p.) with 100 pfu per mouse was performed on day 98, which corresponds to day 0 (blue) of the challenge experiment. Arrows represent blood sample collections, and harvesting of blood, livers, and spleens at the last collection point after sacrifice. (B) Serum samples collected 2 weeks after administering WT GP-FL (WT) or the Th GP-FL (Th) vaccines for both priming and boosting time-points were analyzed by ELISA for anti-EBOV GP IgG1 (red) and IgG2c (blue) antibodies. (C) Endpoint titers of anti-EBOV GP antibodies following boosting with the WT or Th vaccines were also analyzed by ELISA in sera from mice primed and boosted with either PBS or 0.05 μg of the indicated recombinant protein vaccine. (D) Naïve mice (black) or mice that received the WT (red) or Th (blue) vaccines were challenged with MA-EBOV and the times to death (left panel) and body weight changes (right panel) for individual mice were recorded. The Mantel-Cox test was performed for comparison of the survival curves; (****p < 0.0001). (E) Five days after the challenge, mice (n = 5) were sacrificed to determine viral titers from the corresponding organs. The median with interquartile ranges is shown and analyzed using Kruskal-Wallis one way ANOVA nonparametric test with and Dunn’s multiple comparison test; (**p < 0.01, *p < 0.05). (F) The anti-EBOV GP IgG1 and IgG2c antibody titers were also measured from serum of these mice sacrificed at day 5 after challenge (****p < 0.0001, ***p < 0.001, **p < 0.01, *p < 0.05 two-way ANOVA test and Sidak’s multiple comparison test). (G) Twenty-eight days after the challenge, the surviving mice were sacrificed, and blood was collected to measure anti-EBOV GP IgG1 and IgG2c antibody titers.

Update of

References

    1. Jones KE, Patel NG, Levy MA, Storeygard A, Balk D, Gittleman JL. Global trends in emerging infectious diseases. Nature. (2008) 451:990–3. doi: 10.1038/nature06536 - DOI - PMC - PubMed
    1. Mohammed I, Nauman A, Paul P, Ganesan S, Chen KH, Jalil SMS, et al. . The efficacy and effectiveness of the COVID-19 vaccines in reducing infection, severity, hospitalization, and mortality: a systematic review. Hum Vaccin Immunother. (2022) 18:2027160. doi: 10.1080/21645515.2022.2027160 - DOI - PMC - PubMed
    1. Cohen YZ, Caskey M. Broadly neutralizing antibodies for treatment and prevention of HIV-1 infection. Curr Opin HIV AIDS. (2018) 13:366–73. doi: 10.1097/COH.0000000000000475 - DOI - PubMed
    1. Haynes BF, Mascola JR. The quest for an antibody-based HIV vaccine. Immunol Rev. (2017) 275:5–10. doi: 10.1111/imr.12517 - DOI - PMC - PubMed
    1. Nishimura Y, Martin MA. Of mice, macaques, and men: broadly neutralizing antibody immunotherapy for HIV-1. Cell Host Microbe. (2017) 22:207–16. doi: 10.1016/j.chom.2017.07.010 - DOI - PMC - PubMed

MeSH terms