. 2024 May 13;5(7):100989.
doi: 10.1016/j.patter.2024.100989. eCollection 2024 Jul 12.

MetaGate: Interactive analysis of high-dimensional cytometry data with metadata integration

Affiliations

MetaGate: Interactive analysis of high-dimensional cytometry data with metadata integration

Eivind Heggernes Ask et al. Patterns (N Y). .

Abstract

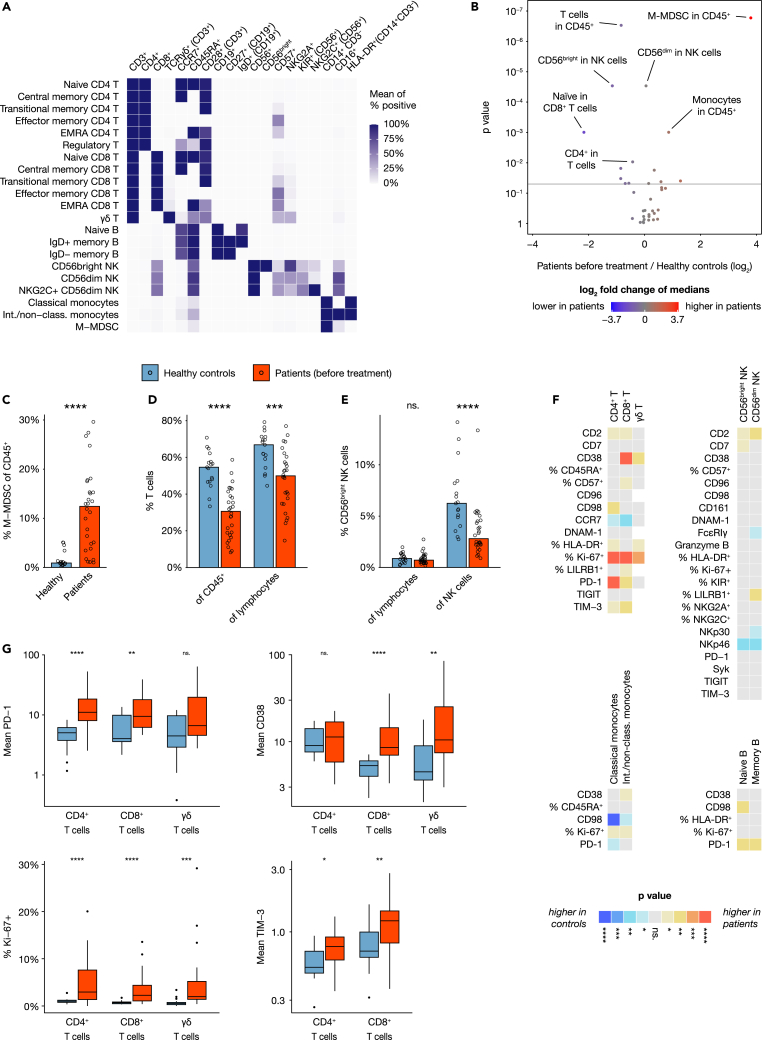
Flow cytometry is a powerful technology for high-throughput protein quantification at the single-cell level. Technical advances have substantially increased data complexity, but novel bioinformatical tools often show limitations in statistical testing, data sharing, cross-experiment comparability, or clinical data integration. We developed MetaGate as a platform for interactive statistical analysis and visualization of manually gated high-dimensional cytometry data with integration of metadata. MetaGate provides a data reduction algorithm based on a combinatorial gating system that produces a small, portable, and standardized data file. This is subsequently used to produce figures and statistical analyses through a fast web-based user interface. We demonstrate the utility of MetaGate through a comprehensive mass cytometry analysis of peripheral blood immune cells from 28 patients with diffuse large B cell lymphoma along with 17 healthy controls. Through MetaGate analysis, our study identifies key immune cell population changes associated with disease progression.

Keywords: data analysis; diffuse large B-cell lymphoma; flow cytometry; mass cytometry.


Conflict of interest statement

K-J.M. is a consultant at Fate Therapeutics and Vycellix and has research support from Oncopeptides for studies unrelated to this work.

Figures

None
Graphical abstract
Figure 1
Figure 1
MetaGate data analysis workflow (A) A biological sample, such as patient blood, is analyzed using a mass or flow cytometer, which produces FCS data files. Manual gating is performed in FlowJo or Cytobank, creating a data file with specifications of each gate. (B) Gate data and FCS files are imported into MetaGate, where a graphical user interface allows defining populations based on combinations of gates. Through a data reduction algorithm, a MetaGate data file is created, which contains marker expression and event frequencies of combinations of populations. (C) The self-containing MetaGate data file is opened in the MetaGate graphical user interface for interactive production of statistics and plots, such as heatmaps, volcano plots, and bar plots.
Figure 2
Figure 2
DLBCL immune characterization workflow (A) Peripheral blood was collected from healthy blood donors (n = 17) and from patients diagnosed with DLBCL (n = 28) before and after chemotherapy. (B) Blood samples were split and analyzed using two mass cytometry panels. Data from each panel were imported separately in MetaGate and later merged.
Figure 3
Figure 3
Peripheral blood immune cell composition in DLBCL (A) Heatmap showing expression of key markers in subsets of analyzed cell types, visualizing how subsets were defined for downstream analysis. (B) Volcano plot showing size differences of 36 key immune cell types between healthy donors and all patients before chemotherapy. (C–E) Bar plots showing median percentages of (C) M-MDSCs (defined as HLA-DR CD14+ CD19 CD3 CD56 cells), (D) T cells, and (E) CD56bright NK cells within various parent populations in healthy controls (n = 17) and all patients before therapy (n = 28). (F) Heatmap showing differences in marker expression between healthy controls (n = 17) and patients before therapy (n = 21–28) within multiple immune cell subsets, with colors indicating direction of difference and statistical significance from nonparametric tests without p value adjustment. Values are mean intensity values unless otherwise indicated. (G) Boxplots showing selected readouts from (F). All p values are calculated using the Mann–Whitney U test.
Figure 4
Figure 4
Effects of treatment on immune cell phenotypes (A) B cell frequencies as percentage of all CD45+ in healthy controls (n = 17) and all patients (n = 28) before and after treatment. Bar height represents median. (B) Volcano plot showing differences in absolute counts of 28 cell subsets before and after treatment (n = 28). (C and D) Selected comparisons from (B). Bar height represents median. (E) Heatmap showing median frequencies of key NK cell subsets as percentage of bulk NK cells in healthy controls (n = 17) and patients (n = 28) before and after therapy. (F) Heatmap showing differences in marker expression within multiple immune cell subsets between patients before and after treatment (n = 20–28), with colors indicating direction of difference and statistical significance from paired nonparametric tests without p value adjustment. (G) Boxplots showing mean CD38 expression in multiple NK cell subsets of healthy controls (n = 15–17) and patients (n = 25–28) before and after treatment. p values are calculated using the Dunn test (A and G) or Wilcoxon signed-rank test (B–D and F).
Figure 5
Figure 5
Immune cell repertoires stratified on patient characteristics (A–C and F) Volcano plots showing differences in 33 absolute cell counts in peripheral blood of patients before therapy, stratified on (A) age above 65 (n = 15) or below or equal to 65 (n = 13), (B) GCB (n = 13) or non-GCB (n = 11) subtype, (C) stage I/II (n = 10) or III/IV (n = 18), and (F) disease progression (n = 5) or remission (n = 23) within the follow-up time. (D, E, G, and H) Selected readouts from (C) and (F). Bar height represents median. All p values are calculated using the Mann–Whitney U test.

Update of

References

    1. Bendall S.C., Nolan G.P., Roederer M., Chattopadhyay P.K. A deep profiler's guide to cytometry. Trends Immunol. 2012;33:323–332. - PMC - PubMed
    1. Cheung M., Campbell J.J., Whitby L., Thomas R.J., Braybrook J., Petzing J. Current trends in flow cytometry automated data analysis software. Cytometry A. 2021;99:1007–1021. - PubMed
    1. Van der Maaten L., Hinton G. Visualizing data using t-SNE. Journal of machine learning research. 2008;9
    1. Levine J.H., Simonds E.F., Bendall S.C., Davis K.L., Amir E.a.D., Tadmor M.D., Litvin O., Fienberg H.G., Jager A., Zunder E.R., et al. Data-Driven Phenotypic Dissection of AML Reveals Progenitor-like Cells that Correlate with Prognosis. Cell. 2015;162:184–197. - PMC - PubMed
    1. Qiu P., Simonds E.F., Bendall S.C., Gibbs K.D., Jr., Bruggner R.V., Linderman M.D., Sachs K., Nolan G.P., Plevritis S.K. Extracting a cellular hierarchy from high-dimensional cytometry data with SPADE. Nat. Biotechnol. 2011;29:886–891. - PMC - PubMed

LinkOut - more resources