. 2024 Apr 15;9(7):2209-2226.
doi: 10.1016/j.ekir.2024.04.031. eCollection 2024 Jul.

A Novel Monoallelic ALG5 Variant Causing Late-Onset ADPKD and Tubulointerstitial Fibrosis

Affiliations

A Novel Monoallelic ALG5 Variant Causing Late-Onset ADPKD and Tubulointerstitial Fibrosis

Elhussein A E Elhassan et al. Kidney Int Rep. .

Abstract

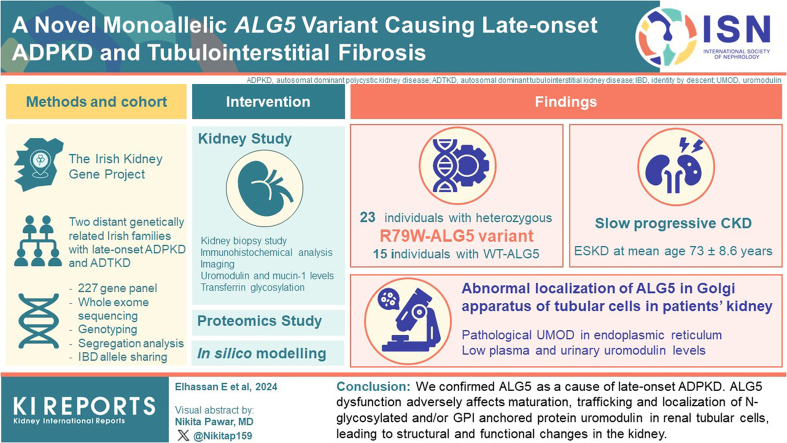
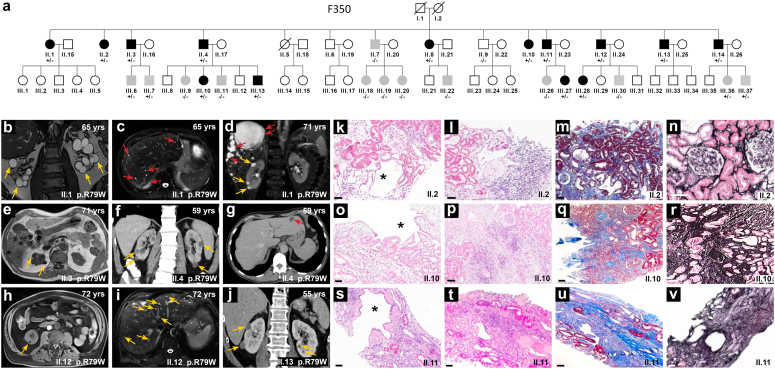
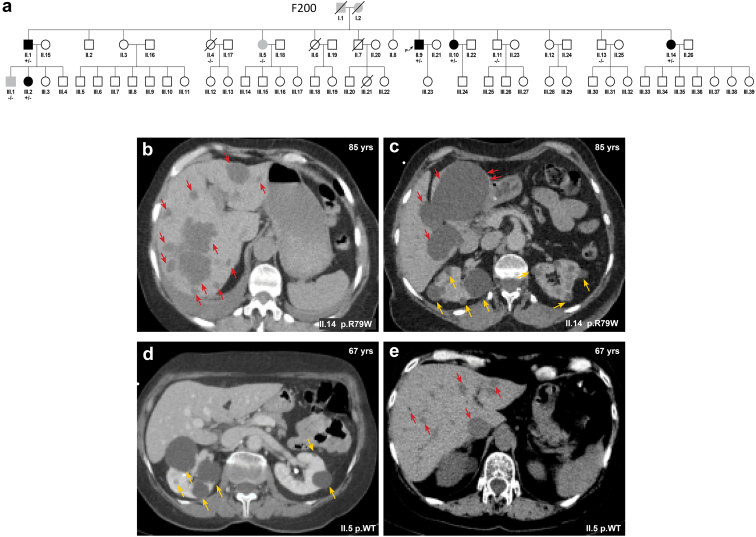
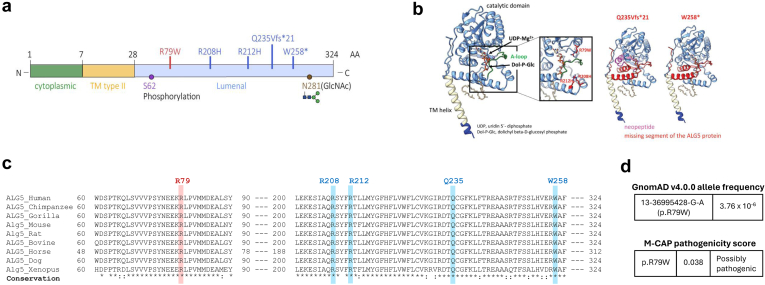
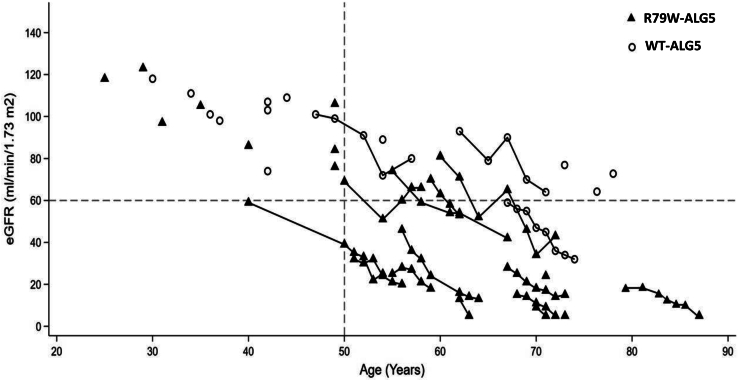
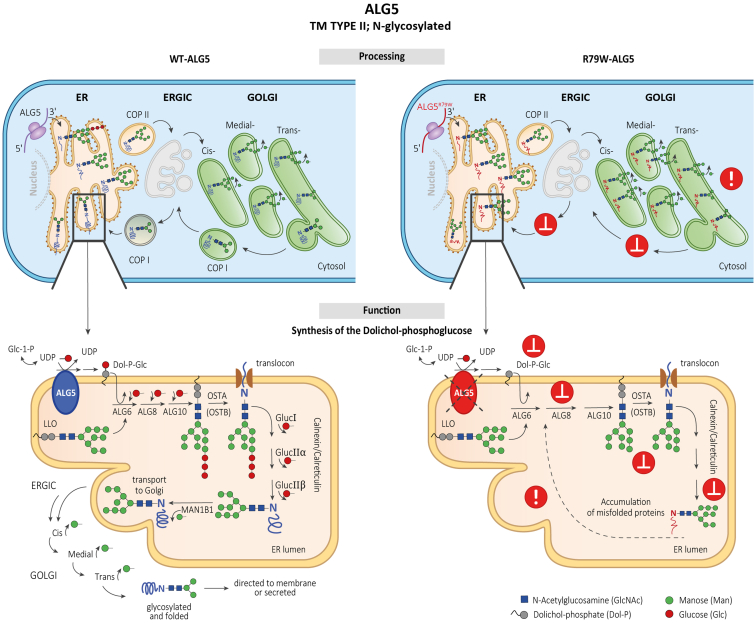
Introduction: Monoallelic variants in the ALG5 gene encoding asparagine-linked glycosylation protein 5 homolog (ALG5) have been recently shown to disrupt polycystin-1 (PC1) maturation and trafficking via underglycosylation, causing an autosomal dominant polycystic kidney disease-like (ADPKD-like) phenotype and interstitial fibrosis. In this report, we present clinical, genetic, histopathologic, and protein structure and functional correlates of a new ALG5 variant, p.R79W, that we identified in 2 distant genetically related Irish families displaying an atypical late-onset ADPKD phenotype combined with tubulointerstitial damage.

Methods: Whole exome and targeted sequencing were used for segregation analysis of available relatives. This was followed by immunohistochemistry examinations of kidney biopsies, and targeted (UMOD, MUC1) and untargeted plasma proteome and N-glycomic studies.

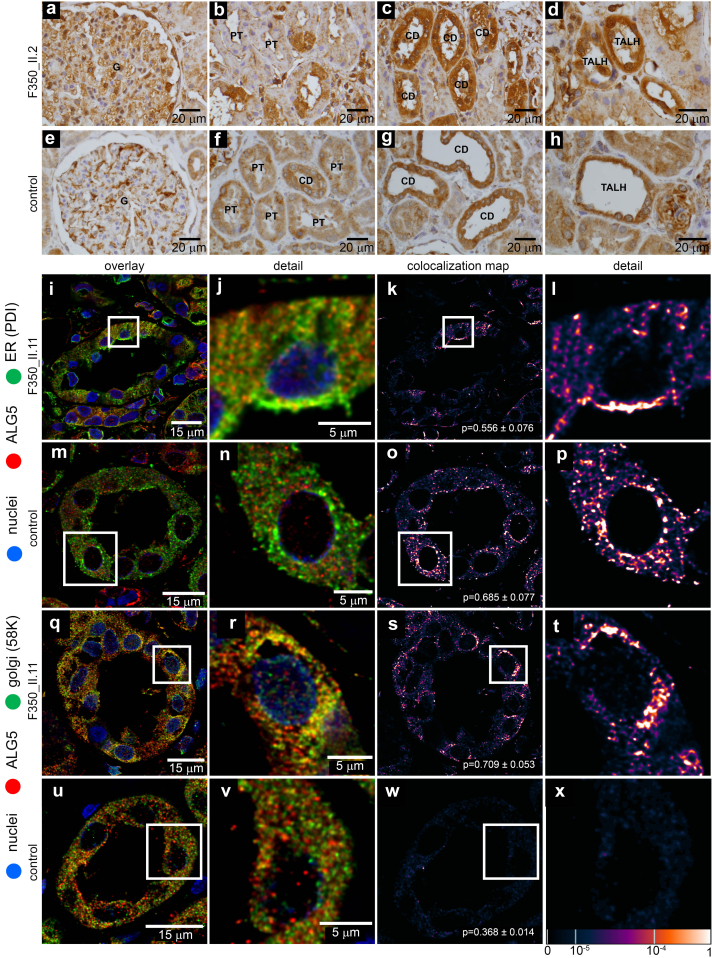
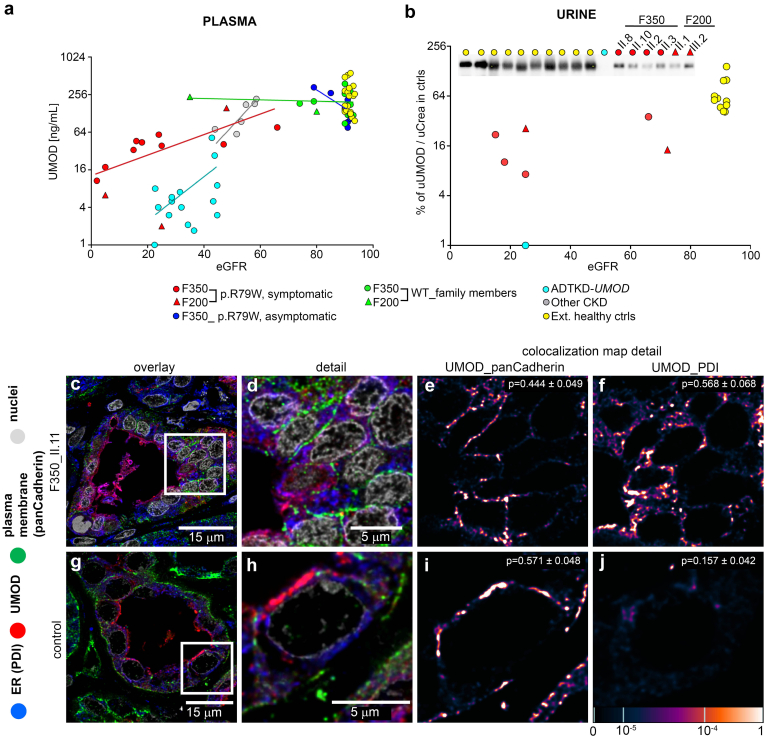
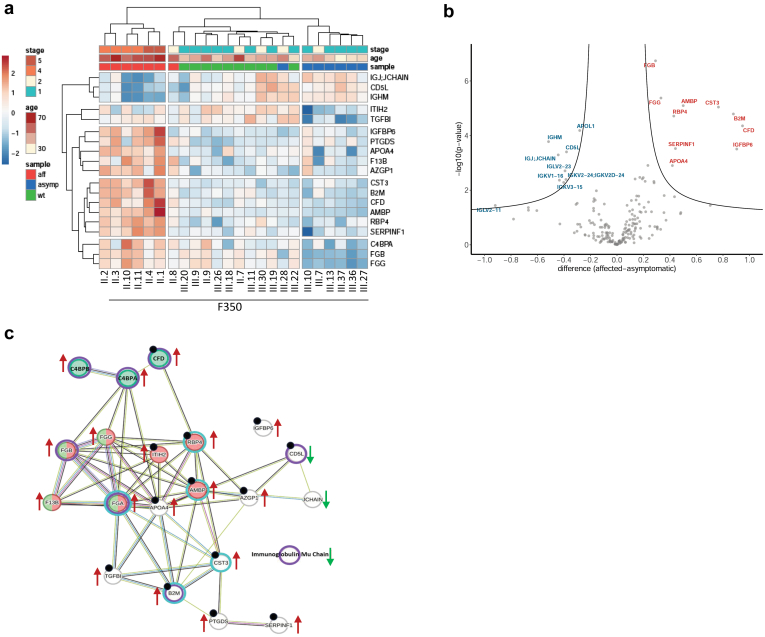
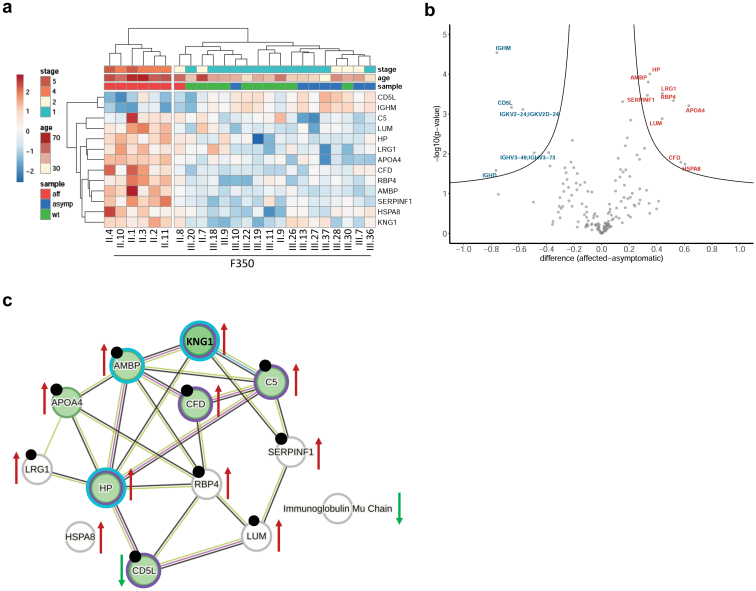
Results: We identified a monoallelic ALG5 variant [GRCh37 (NM_013338.5): g.37569565G>A, c.235C>T; p.R79W] that cosegregates in 23 individuals, of whom 18 were clinically affected. We detected abnormal localization of ALG5 in the Golgi apparatus of renal tubular cells in patients' kidney specimens. Further, we detected the pathological accumulation of uromodulin, an N-glycosylated glycosylphosphatidylinositol (GPI)-anchored protein, in the endoplasmic reticulum (ER), but not mucin-1, an O- and N-glycosylated protein. Biochemical investigation revealed decreased plasma and urinary uromodulin levels in clinically affected individuals. Proteomic and glycoproteomic profiling revealed the dysregulation of chronic kidney disease (CKD)-associated proteins.

Conclusion: ALG5 dysfunction adversely affects maturation and trafficking of N-glycosylated and GPI anchored protein uromodulin, leading to structural and functional changes in the kidney. Our findings confirm ALG5 as a cause of late-onset ADPKD and provide additional insight into the molecular mechanisms of ADPKD-ALG5.

Keywords: ALG5; Golgi apparatus; N-Linked protein glycosylation; UMOD; autosomal dominant tubulo-interstitial kidney disease; autosomal-dominant polycystic kidney disease.


Figures

None
Graphical abstract
Figure 1
Figure 1
Family F350. (a) The F350 pedigree shows a family with autosomal dominant atypical polycystic kidney disease and a slow decline in glomerular filtration rate (GFR). Clinically affected individuals (black symbols) had bilateral kidney cysts, reduced GFR below 60 ml/min per 1.73 m2 or nonenlarged kidneys with nephronophthisis-like histology. Gray indicates young carriers of the variant with no established clinical diagnosis yet. White indicates clinically unaffected individuals. Out of the 28 individuals evaluated in this family, 18 were determined as genetically affected individuals with the heterozygous missense variant R79W-ALG5 (+/−), whereas 10 individuals were genetically unaffected (−/−). A (+) sign indicates the presence of the R79W-ALG5 variant, and a (−) sign indicates the presence of the wild-type WT-ALG5 in a genotyped individual. (Bottom - Left) Radiologic imaging of genetically affected members of F350 (b–j). Yellow arrows denote kidney cysts, whereas red arrows indicate cysts in the liver. (b and c) T2-weighted magnetic resonance imaging (MRI) of 65-year-old patient II.1 demonstrates bilateral multiple scattered kidney and liver cysts. (d) At age 64, II.3 underwent an MRI scan that revealed nonenlarged cystic kidney and high-burden hepatic simple cysts (>20 cysts, with the largest measuring 11.6 cm in the right lobe - red arrows;). He underwent liver cysts fenestration at 70 years of age as the result of ongoing pain. An MRI of the liver performed at the age of 71 years (e) confirms the presence of severe polycystic liver disease. (f and g) A CT scan of II. 4's kidneys and liver at age 59 showed multiple subcentimeter-sized kidney cysts and a solitary liver cyst in segment 2. Similar to II.3, a 72-year-old MRI scan of II.12 reveals scattered kidney cysts (1 cyst is displayed in h) and (i) numerous liver cysts, whereas (j) a CT scan of II.13 reveals only a few kidney cysts. (Bottom - Right) (k, o, and s) Kidney biopsy slides staining of 3 genetically affected individuals from F350. At 52, 51, and 54 years of age, subjects II.2, II.10, and II.11, respectively, underwent clinically indicated kidney biopsies; their corresponding estimated glomerular filtration rate at the time of the biopsies were 37, 32, and 54 ml/min per 1.73 m2. Hematoxylin and eosin (H&E) stained section showing a central cystically dilated tubule in all patients marked with an asterisk (∗). (Images l, p, and t) Also, a variable degree of inflammatory infiltrate within the tubulointerstitial compartment has been identified–using H&E stain. (m, q, and u) Masson-Trichrome and (n, r, and v) Silver stained sections illustrating variable degrees of glomerulosclerosis, interstitial fibrosis, and tubular atrophy. All biopsies captured at 10× magnification with scale bars represent 100 μm. CT, computed tomography; MRI, magnetic resonance imaging.
Figure 2
Figure 2
Family F200. (a) The pedigree of F200 shows 5 clinically affected members (black symbols). Gray indicates clinically unclear individuals and white indicates clinically unaffected individuals. A (+/−) sign indicates the presence of the heterozygous missense variant R79W-ALG5 and a (−/−) sign indicates the presence of the wild-type WT-ALG5. A (+) sign indicates the presence of the R79W-ALG5 variant, and a (−) sign indicates the presence of the wild-type WT-ALG5 in a genotyped individual. Out of the 10 individuals evaluated in this family, 5 were determined as genetically affected individuals with a heterozygous missense variant R79W-ALG5 (+/−), whereas the remaining members were genetically unaffected (−/−). (b and c) CT scan of II.14 at the age of 86 years revealed nonenlarged cystic kidneys (yellow arrows) and severe polycystic liver disease (red arrows). (d and e) Subject II.5 at the age of 67 years, who does not harbor the ALG5 variant, has a few kidney and scattered liver cysts with estimated glomerular filtration rate 57 ml/min per 1.73 m2. Disease-causing variants in PKD1, PKD2, PRKCSH, ALG9, ALG8, DNAJB11, SEC63, and GANAB, among other monogenic kidney disorders, were analyzed and none were identified, using exome sequencing. Subjects II.4, II.11 and II.13 enjoy a preserved kidney function; eGFR 66 ml/min for subject II.4, 80 ml/min for subject II.11 and 69 ml/min for subject II.13 at age of 76, 77, and 73 years, respectively. None of the subjects had any kidney cysts: Subject II.4 (at age 76 years via CT scan with contrast with slice thickness of 1 mm), subject II.11 (at age 69 years via CT abdomen and pelvis imaging with contrast; slice thickness of 1.5 mm) and subject II.13 (at age 70 years via US abdomen). Subjects II.4 and II.11 have been found to have small simple liver cysts, estimated to be less than approximately 5 to 10 in count. CT, computed tomography; US, ultrasound.
Figure 3
Figure 3
In Silico structural mapping of missense variants in ALG5. (a) Diagram of the ALG5 sequence. Novel pathogenic variant identified in this study is shown in red. Previously reported dominant pathogenic variants associated with late-onset ADPKD are shown in blue. (b) Computational structural model of human dolichyl-phosphate beta-glucosyltransferase activity generated by AlphaFold (AF-Q9Y673-F1). Reaction products, dolichyl-phosphate (Dol-P) and Uridine 5'-diphospho (UDP)-alpha-D-glucose (UDP-Glc), are placed at the enzyme active site according to data from the crystal structure of archeal dolichyl-phosphate mannose synthase (see methods). Flexible region of the A-loop governing a dolichyl-phosphate beta-glucosyltransferase activity is highlighted in green. Mutated arginine residues previously reported (R208H, R212H) and the variant from this study (R79W) are shown as red sticks. The last 2 models represent mutants carrying premature stop codons. Missing parts of ALG5 protein and neopeptide in Gln235Valfs∗21 are highlighted by red and magenta, respectively. (c) Amino acid conservation across mutated segments of ALG5 in mammals. Asterisks (∗) indicate amino acid residues that are absolutely conserved and a colon (:) indicates residues with strong conservation across species. (d) Population allele frequency of R79W-ALG5 variant in GnomAD v4.0.0 database and computational prediction by Mendelian Clinically Applicable Pathogenicity Score (M-CAP) of the pathogenicity of missense R79W-ALG5 variant. ADPKD, autosomal dominant polycystic kidney disease.
Figure 4
Figure 4
Kidney function in genetically affected individuals. The most recent estimated glomerular filtration rate (eGFR) (ml/min per 1.73 m2) versus age in individuals affected with the missense mutation p.R79W in ALG5. Solid triangles indicate genetically affected individuals. Hollow circles indicate genetically unaffected individuals; none of whom developed chronic kidney disease, except on individual F200-II.9 (individual with a history of multiple comorbidities, namely atrial fibrillation, osteoarthritis, recurrent cystitis, microscopic hematuria, and active tobacco use; please refer to the manuscript for details). Most affected individuals developed chronic kidney disease stage 3 (horizontal line) after the age of 50 years (vertical line). Five individuals of varying ages had reached end-stage kidney disease, as indicated by an eGFR value of 5 ml/min per 1.73 m2 (Y-axis).
Figure 5
Figure 5
Detection of ALG5 in kidney biopsy. (a–d) ALG5 staining in genetically affected individual F350_II.2 with the missense variant p.R79W in ALG5 and (e–h) in a control subject. ALG5 protein was detected in all segments of nephron-glomerulus (G), proximal tubules (PT), distal tubules (DT), collecting ducts (CD), and thick ascending loop of Henle cells (TALH). In the affected subject was observed the coarsely granular intracytoplasmic staining of ALG5 compared to the finely granular and less intense staining in the control subject. (i–x) Intracellular localization of ALG5 in kidney biopsy. In affected kidney biopsy, parallel staining of ALG5 with Protein disulfide isomerase (PDI) (i in detail j), a marker of endoplasmic reticulum (ER), and with 58K Golgi-protein (q in detail r) demonstrate expected albeit less intense localization of the ALG5 in the ER (k in detail l) and pathologic localization in the Golgi (s in detail s). In the control kidney, parallel staining with PDI (m in detail n) and 58K Golgi protein (u in detail v) demonstrated localization of ALG5 in ER (o in detail p) but not in the Golgi (w in detail x). In the lower right corner of each image (5K, 5O, 5S, 5W) is Pearson coefficient ± SEM to show mean degree of colocalization between individual compartment markers and ALG5 in all analyzed tubules. The degree of ALG5 colocalization with selected markers is presented as the fluorescent signal overlap coefficient values that range from 0 to 1. The corresponding lookup table displays the resulting overlap coefficient values as the pseudo-color scale.
Figure 6
Figure 6
Uromodulin (UMOD) investigations. (a) Plasma concentration of UMOD decreases with reduced estimated glomerular filtration rate (ml/min per 1.73 m2) in individuals affected with the missense variant p.R79W in ALG5, individuals with UMOD pathogenic variants and individuals with unspecified CKD. The decrease in UMOD concentration is slower and less expressive in cases with the ALG5 variant than in cases with UMOD mutations. A best-fit line is included for each group (b) Semiquantitative and qualitative detection of urinary UMOD. Western blot of spot urine samples from 10 healthy controls, 1 patient with a canonical variant in UMOD (ADTKD-UMOD), and 6 genetically affected individuals from family F350 and family F200 showed a reduced amount of urinary UMOD in all investigated patients compared to healthy controls. No abnormality in electrophoretic mobility of residual UMOD suggestive of abnormal N-linked glycosylation was observed in patients. The sample volume was normalized to urinary creatinine level. Intracellular localization of UMOD in patients and control kidney biopsy. To elucidate the cause of the reduction of urinary excretion and the plasma level of UMOD, we analyzed its intracellular localization in kidney biopsy from the patient and control. In affected kidney biopsy, parallel staining of uromodulin (UMOD) with Protein disulfide isomerase (PDI), a marker of endoplasmic reticulum (ER), and with pan-Cadherin, (c in detail d a marker of the plasma membrane (PM)) demonstrate localization of the uromodulin in both, (d) partly in the ER (34%) and (f) partly on PM (66%). In the control kidney, (g in detail h) parallel staining of UMOD with PDI and pan-Cadherin demonstrated (i) localization of UMOD on PM (92%) (j) but not in the ER. In the upper right corner of each image (6K, 6F, 6I, 6J) is the Pearson coefficient ± SEM to show mean degree of colocalization between individual compartment markers and ALG5 in all analyzed tubules. The degree of UMOD colocalization with selected markers is demonstrated by the fluorescent signal overlap coefficient values ranging from 0 to 1. The resulting overlap coefficient values are presented as the pseudo-color, which scale is shown in the corresponding lookup table.
Figure 7
Figure 7
Proteomic analysis of plasma. (a) Unsupervised hierarchical clustering of 19 proteins identified by mass spectrometry and analysis of variance with significantly different abundance between samples of genetically affected individuals with CKD (aff), genetically affected individuals with normal kidney function CKD (asymp) and genetically unaffected family members (wt) from F350. Values are shown as Z-scores, and together with CKD stage and age of participants, are presented as the color codes, which scale is shown in the corresponding lookup tables. (b) Volcano plot demonstrating differences in plasma proteins abundancies identified by mass spectrometry between genetically affected individuals with CKD (aff) and genetically affected individuals with normal kidney function CKD (asymp). The X-axis shows the difference as a log2 value of a ratio of Z-scores of individual proteins; the Y-axis shows the statistical significance of the difference. (c) Physical interactions of proteins with significantly different abundance between genetically affected individuals with CKD and genetically affected individuals with normal kidney function CKD visualized by STRING database. Color circles depict proteins associated with immune response (Violet - DISGENET database), proteins associated with kidney disease, kidney insufficiency or kidney injury (Turquoise - DISGENET database), proteins associated with hemostasis (Red - STRING database), proteins associated with complement and coagulation cascade (Green - STRING database), proteins which were not associated with any of the listed category in STRING or DISGENET database (Gray) and proteins associated with either stage of CKD or progression of CKD or ESKD from the literature (Black dots). Arrows indicate an increase or decrease in corresponding protein abundance in genetically affected individuals with CKD. CKD, chronic kidney disease.
Figure 8
Figure 8
Glycoproteomic analysis of plasma. (a) Unsupervised hierarchical clustering of 12 glycoproteins identified by mass spectrometry and analysis of variance with significantly different abundance between samples of genetically affected individuals with CKD (aff), genetically affected individuals with normal kidney function CKD (asymp) and genetically unaffected family members (wt) from F350. Values are shown as Z-scores, and together with CKD stage and age of participants, are presented as the color codes, which scale is shown in the corresponding lookup tables. (b) Volcano plot demonstrating differences in plasma proteins abundancies identified by mass spectrometry between genetically affected individuals with CKD (aff) and genetically affected individuals with normal kidney function CKD (asymp). The X-axis shows the difference as a log2 value of a ratio of Z-scores of individual proteins; the Y-axis shows the statistical significance of the difference. (c) Physical interactions of proteins with significantly different abundance between genetically affected individuals with CKD and genetically affected individuals with normal kidney function CKD visualized by STRING database. Color circles depict proteins associated with immune response (Violet - DISGENET database), proteins associated with kidney disease, kidney insufficiency or kidney injury (Turquoise - DISGENET database), proteins associated with hemostasis (Red - STRING database), proteins associated with complement and coagulation cascade (Green – STRING database), proteins which were not associated with any of the listed category in STRING or DISGENET database (Gray) and proteins associated with either stage of CKD or progression of CKD or ESKD from the literature (Black dots). Arrows indicate an increase or decrease in corresponding protein abundance in genetically affected individuals with CKD. CKD, chronic kidney disease.
Figure 9
Figure 9
Hypothetical pathogenetic mechanisms of monoallelic ALG5 variants. Upper left cartoon: ALG5 is an N-glycosylated protein that localizes in the endoplasmic reticulum (ER) membrane. Its biosynthesis proceeds through cotranslational translocation into ER and posttranslational modifications, including sequential maturation of N-linked oligosaccharides and folding in the ER, ERGIC, and Golgi apparatus. Fully maturated and properly folded ALG5 is finally retrieved back to the ER. Lower left cartoon: ALG5 catalyzes on the cytoplasmic face of ER membrane synthesis of dolichyl beta-D-glucosyl phosphate (Dol-P-Glc) from dolichyl phosphate and Uridine 5'-diphospho (UDP)-alpha-D-glucose. Dol-P-Glc is subsequently translocated by flippase into the ER lumen, where it provides glucose (Glc) residues for the sequential building of the growing lipid linked-oligosaccharides (LLO) by ALG6, ALG8, and ALG10. The resulting oligosaccharide glycan core consists typically of Man9Glc3GlcNAc2; The Man9Glc3GlcNAc2 oligosaccharide is transferred to the asparagine (N) residue of the polypeptide chain by an oligosaccharyltransferase complex OSTA that glycosylates nascent polypeptides traversing the translocon or OSTB that glycosylates proteins in the ER lumen. Then, folding of N-linked glycoproteins proceeds via subsequent removal of 3 Glc residues by glucosidases (Gluc I, Gluc IIα, and Gluc IIβ) and one mannose (Man) residue by ER mannosidase (MAN1B1) with assistance of chaperones (calnexin, calreticulin). Properly folded and Man8GlcNAc2 modified glycoproteins then traverse via COP II coated vesicles through ER-Golgi intermediate compartment (ERGIC) to the Golgi for final processing and sorting for transport to their eventual destinations. Upper right cartoon: the p.R79W variant affects the maturation, folding, and trafficking of the ALG5, leading to aberrant protein deposition within the Golgi apparatus and disturbance of Golgi homeostasis. Lower right cartoon: the p.R79W variant and ALG5 haploinsufficiency affects synthesis and structure of the LLO oligosaccharides with negative consequences on maturation, trafficking, and intracellular localization of other N-glycosylated proteins.

References

    1. Bergmann C., Guay-Woodford L.M., Harris P.C., Horie S., Peters D.J.M., Torres V.E. Polycystic kidney disease. Nat Rev Dis Primers. 2018;4:50. doi: 10.1038/s41572-018-0047-y. - DOI - PMC - PubMed
    1. Benson K.A., Murray S.L., Senum S.R., et al. The genetic landscape of polycystic kidney disease in Ireland. Eur J Hum Genet. 2021;29:827–838. doi: 10.1038/s41431-020-00806-5. - DOI - PMC - PubMed
    1. Cornec-Le Gall E., Alam A., Perrone R.D. Autosomal dominant polycystic kidney disease. Lancet. 2019;393:919–935. doi: 10.1016/S0140-6736(18)32782-X. - DOI - PubMed
    1. Heyer C.M., Sundsbak J.L., Abebe K.Z., et al. Predicted mutation strength of nontruncating PKD1 mutations Aids genotype-phenotype correlations in autosomal dominant polycystic kidney disease. J Am Soc Nephrol. 2016;27:2872–2884. doi: 10.1681/ASN.2015050583. - DOI - PMC - PubMed
    1. Senum S.R., Li Y.S.M., Benson K.A., et al. Monoallelic IFT140 pathogenic variants are an important cause of the autosomal dominant polycystic kidney-spectrum phenotype. Am J Hum Genet. 2022;109:136–156. doi: 10.1016/j.ajhg.2021.11.016. - DOI - PMC - PubMed