Comparison of lung volumes measured with computed tomography and whole-body plethysmography - a systematic review
- PMID: 39081799
- PMCID: PMC11288198
- DOI: 10.1080/20018525.2024.2381898
Comparison of lung volumes measured with computed tomography and whole-body plethysmography - a systematic review
Abstract
Introduction: Whole-body plethysmography is the preferred method for measuring the static lung volumes: total lung capacity (TLC), functional residual capacity (FRC) and residual volume (RV), as it also incorporates trapped gas - a common finding in chronic obstructive pulmonary disease (COPD). Quantitative computed tomography (CT) is a promising alternative to plethysmography, which can be challenging to perform for patients with severely impaired lung function. The present systematic review explores the agreement between lung volumes measured by plethysmography and CT, as well as the attempts being made to optimize alignment between these two methods.
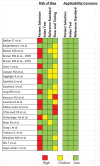
Methods: A literature search was performed on the PubMed database using the block search strategy. Articles were included if they provided both CT based and plethysmography based TLC. Risk of bias was evaluated using the Quality Assessment of Diagnostic Accuracy Studies 2 (QUADAS-2) checklist.
Results: 22 articles were included. On average, CT-derived TLC (CT-TLC) was 709 mL lower compared to plethysmography TLC (p-TLC) with a 12.1% deviation from the reference standard, p-TLC. This discrepancy (ΔTLC) appeared slightly larger in obstructive patients (obstructive: 781 mL, non-obstructive: 609 mL), whereas percent deviation was slightly smaller (obstructive: 11.4%, non-obstructive: 13.5%). CT-based RV analyses primarily based on COPD patients measured 603 mL higher than plethysmography (p-RV) with 17.8% deviation from p-RV. Studies utilizing spirometry-gating for CT acquisition reported good agreement between modalities (ΔTLC: 70-280 mL), and one study demonstrated noticeable improvements compared to conventional breath-hold instructions in an otherwise identical study setting.
Conclusion: CT quantifications routinely underestimate TLC and overestimate RV in comparison to plethysmography. Spirometry gating reduces the level of disagreement and can be of assistance when patients are already undergoing CT. However, further studies are needed to confirm these results.
Keywords: Systematic review; body box; computed tomography; functional residual capacity; residual volume; static lung volumes; total lung capacity; whole-body plethysmography.
© 2024 The Author(s). Published by Informa UK Limited, trading as Taylor & Francis Group.
Conflict of interest statement
No potential conflict of interest was reported by the author(s).
Figures


References
-
- West JB, Luks A.. West’s respiratory physiology : the essentials. 11th ed. Philadelphia: Wolters Kluwer; 2021.
Publication types
LinkOut - more resources
Full Text Sources
