

Twelve-year (2008-2019) trends in socioeconomic inequalities in cardiovascular risk factors in a Swiss representative survey of the general population
- PMID: 39081844
- PMCID: PMC11286997
- DOI: 10.1016/j.pmedr.2024.102823
Twelve-year (2008-2019) trends in socioeconomic inequalities in cardiovascular risk factors in a Swiss representative survey of the general population
Abstract
Objective: We assessed trends in socioeconomic inequalities in cardiovascular risk factors prevalence among Swiss adults from 2008 to 2019.
Methods: Using data from the Bus Santé study, an annual survey of adults living in Geneva, Switzerland, we calculated the prevalence per period and by demographic and socioeconomic indicators, assessing inequality trends using the relative index of inequality (RII) and the slope index of inequality (SII).
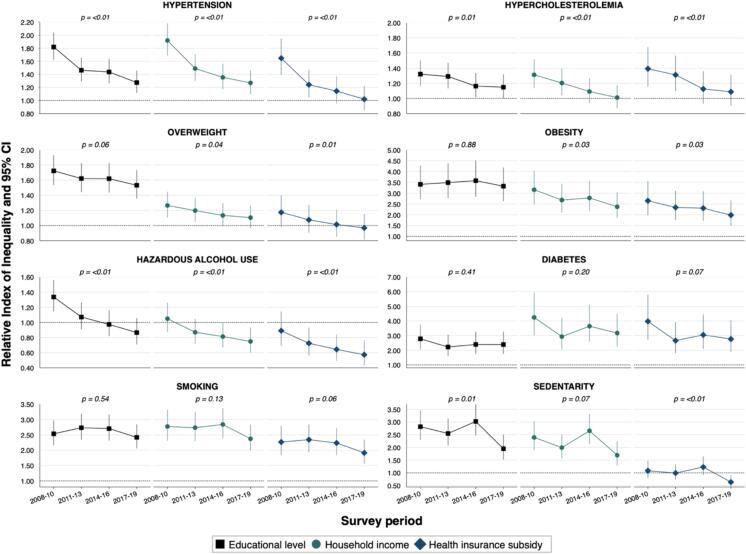
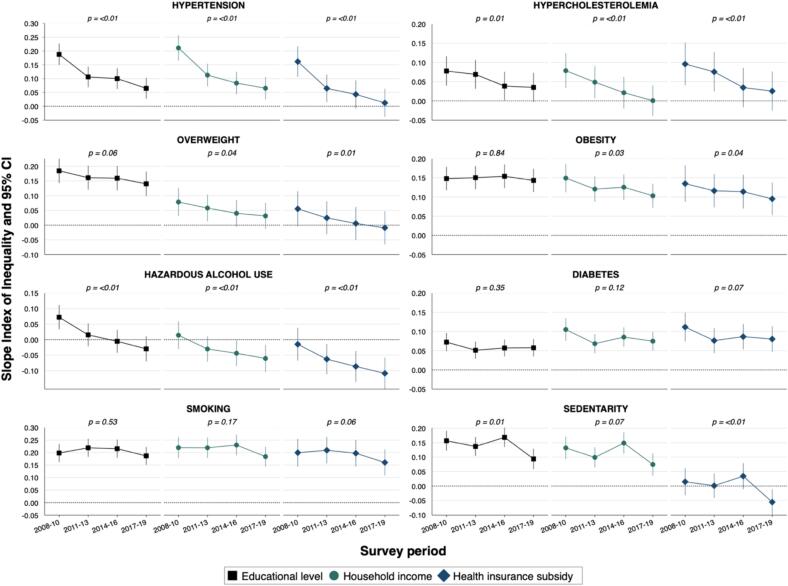
Results: Among 10,739 participants, most CVD risk factors decreased over time, while diabetes, obesity, and smoking prevalence remained steady. In 2017-2019, prevalence of most CVD risk factors was higher in socioeconomically disadvantaged groups. Relative and absolute inequalities decreased over time, but mostly remained, for hypertension [in 2017-2019, education-RII (95 % CI) = 1.27 (1.12-1.46), income-RII = 1.27 (1.10-1.47)], hypercholesterolemia [education-RII = 1.15 (1.00-1.32)], and sedentarity [education-RII = 1.95 (1.52-2.51), income-RII = 1.69 (1.28-2.23)], and appeared to have reversed for hazardous alcohol use [income-RII = 0.75 (0.60-0.93)]. Substantial and persistent relative and absolute inequalities in diabetes prevalence were observed [education-RII = 2.39 (1.75-3.27), income-RII = 3.18 (2.25-4.48), and subsidy-RII = 2.77 (1.89-4.05)]. Inequalities were also marked across all socioeconomic indicators for obesity prevalence [education-RII = 3.32 (2.63-4.19), income-RII = 2.37 (1.85-3.04), subsidy-RII = 1.98 (1.48-2.66)] and for smoking [education-RII = 2.42 (2.06-2.84), income-RII = 2.37 (1.99-2.84), subsidy-RII = 1.91 (1.56-2.35)].
Conclusions: Over 12 years in Geneva, Switzerland, socioeconomic inequalities in hypertension, hypercholesterolemia, hazardous alcohol use, and sedentarity decreased but persist, while substantial inequalities in diabetes, obesity, and smoking remained unchanged.
Keywords: Absolute inequalities; Cardiovascular risk factors; Diabetes; Hypercholesterolemia; Hypertension; Obesity; Population-based study; Relative inequalities; Sedentarity; Smoking; Trends in socioeconomic inequalities.
© 2024 The Author(s).
Conflict of interest statement
The authors declare that they have no known competing financial interests or personal relationships that could have appeared to influence the work reported in this paper.
Figures
Similar articles
-
Thirteen-year trends in the prevalence of diabetes according to socioeconomic condition and cardiovascular risk factors in a Swiss population.BMJ Open Diabetes Res Care. 2020 Jul;8(1):e001273. doi: 10.1136/bmjdrc-2020-001273. BMJ Open Diabetes Res Care. 2020. PMID: 32661192 Free PMC article.
-
Trends and Regional Variation in Prevalence of Cardiovascular Risk Factors and Association With Socioeconomic Status in Canada, 2005-2016.JAMA Netw Open. 2021 Aug 2;4(8):e2121443. doi: 10.1001/jamanetworkopen.2021.21443. JAMA Netw Open. 2021. PMID: 34410395 Free PMC article.
-
Educational and wealth inequalities in tobacco use among men and women in 54 low-income and middle-income countries.Tob Control. 2018 Jan;27(1):26-34. doi: 10.1136/tobaccocontrol-2016-053266. Epub 2016 Nov 24. Tob Control. 2018. PMID: 27885168
-
Inequalities in the prevalence of diabetes mellitus and its risk factors in Sri Lanka: a lower middle income country.Int J Equity Health. 2018 Apr 17;17(1):45. doi: 10.1186/s12939-018-0759-3. Int J Equity Health. 2018. PMID: 29665834 Free PMC article.
-
Cardiovascular risk factors-using repeated cross-sectional surveys to assess time trends in socioeconomic inequalities in neighbouring countries.BMJ Open. 2017 Apr 3;7(4):e013442. doi: 10.1136/bmjopen-2016-013442. BMJ Open. 2017. PMID: 28373251 Free PMC article.
Cited by
-
Twenty years population-based trends in prevalence, awareness, treatment, and control of hypertension in Geneva, Switzerland.Prev Med Rep. 2025 Apr 1;53:103055. doi: 10.1016/j.pmedr.2025.103055. eCollection 2025 May. Prev Med Rep. 2025. PMID: 40235578 Free PMC article.
References
-
- Appelman Y., van Rijn B.B., Ten Haaf M.E., Boersma E., Peters S.A.E. Sex differences in cardiovascular risk factors and disease prevention. Atherosclerosis. 2015;241:211–218. - PubMed
-
- Bann D., Wright L., Hughes A., Chaturvedi N. Socioeconomic inequalities in cardiovascular disease: a causal perspective. Nat Rev Cardiol. 2023:1–12. - PubMed
LinkOut - more resources
Full Text Sources
