

T cell proliferation-related subtypes, prognosis model and characterization of tumor microenvironment in head and neck squamous cell carcinoma
- PMID: 39082023
- PMCID: PMC11284379
- DOI: 10.1016/j.heliyon.2024.e34221
T cell proliferation-related subtypes, prognosis model and characterization of tumor microenvironment in head and neck squamous cell carcinoma
Abstract
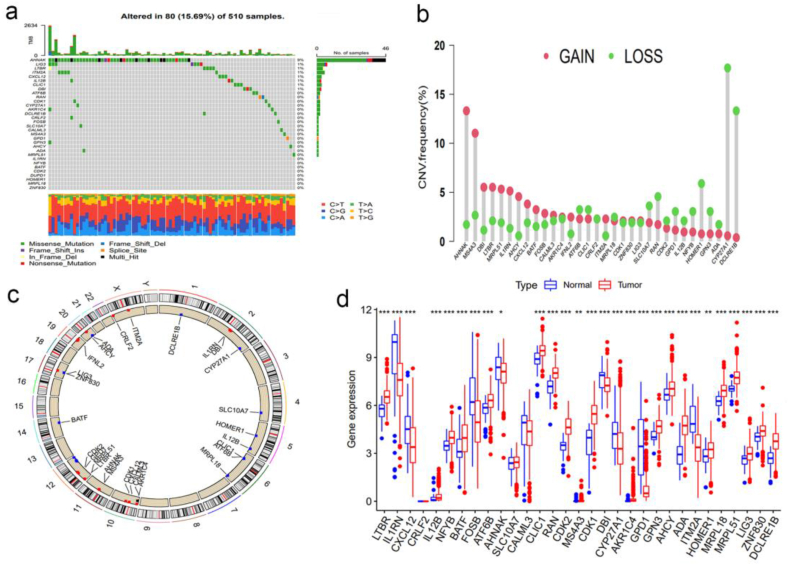
Background: Thirty-three synthetic driver genes of T-cell proliferation have recently been identified through genome-scale screening. However, the tumor microenvironment (TME) cell infiltration, prognosis, and response to immunotherapy mediated by multiple T cell proliferation-related genes (TRGs) in patients with head and neck squamous cell carcinoma (HNSC) remain unclear.
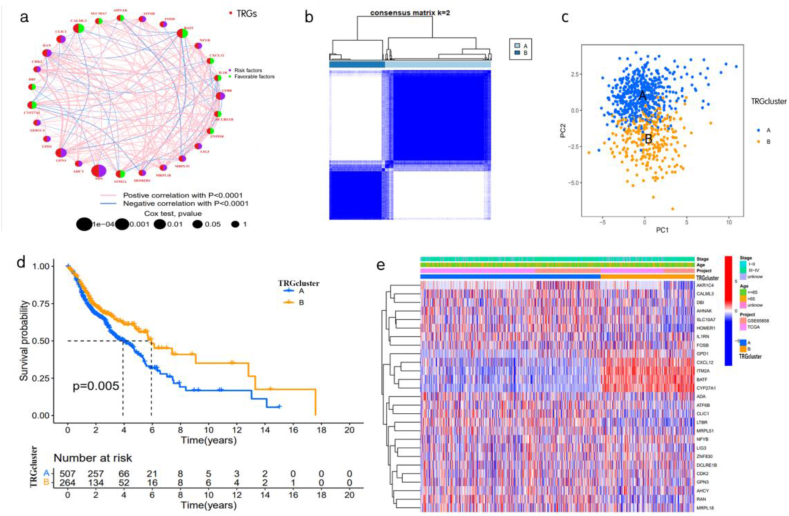
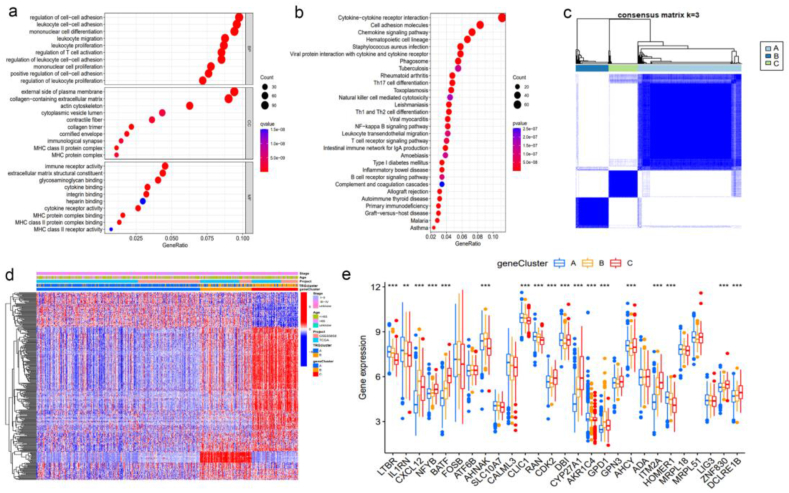
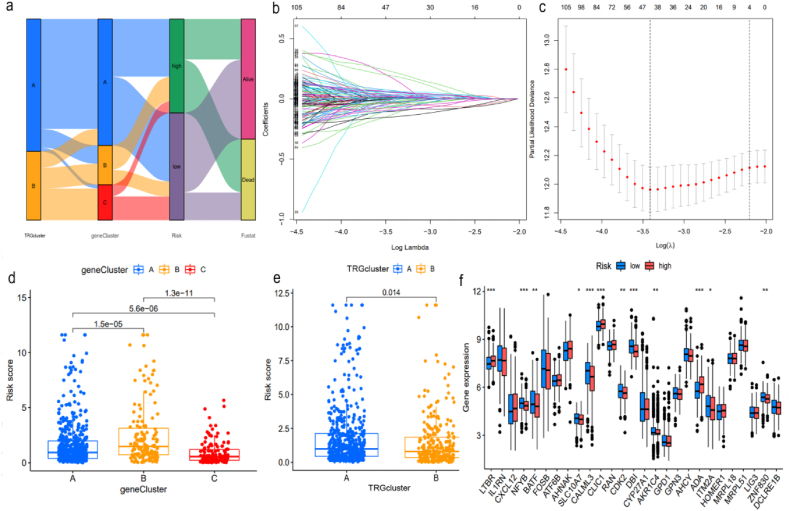
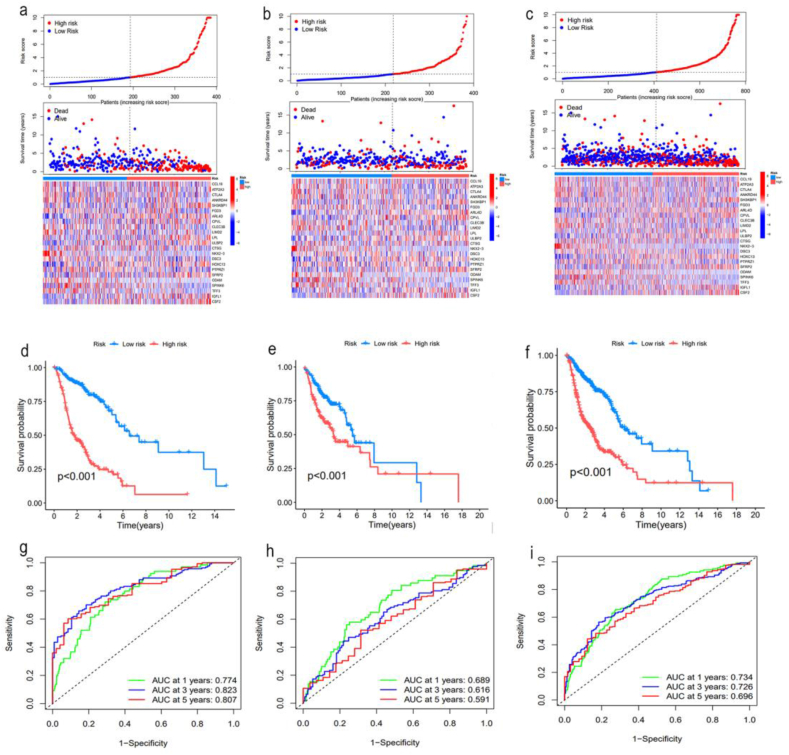
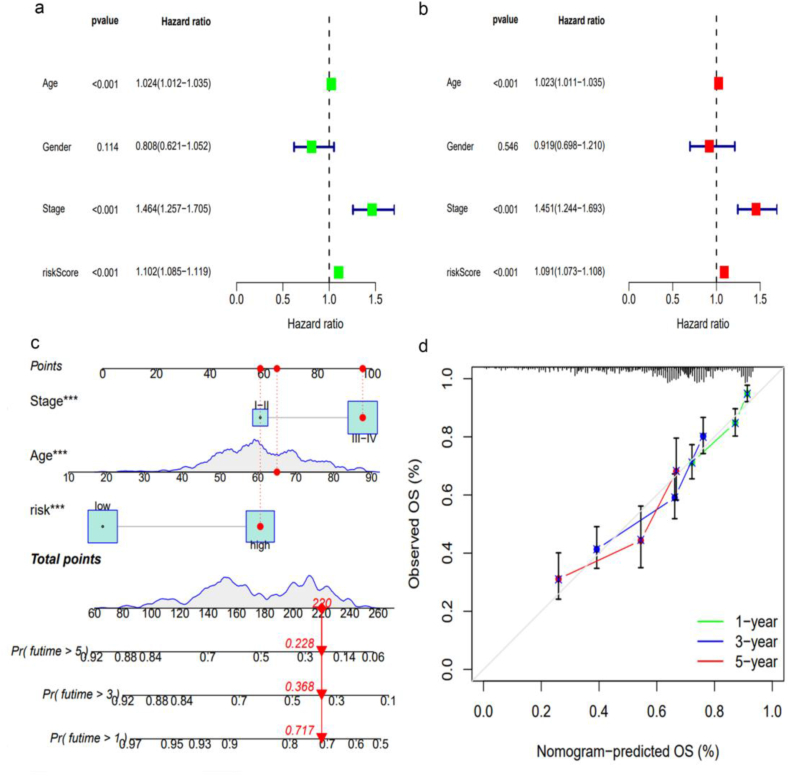
Methods: This study examined the genetic and transcriptional changes in 771 patients with HNSC by analyzing the TRGs from two independent datasets. Two different subtypes were analyzed to investigate their relationship with immune infiltrating cells in the TME and patient prognosis. The study also developed and validated a risk score to predict overall survival (OS). Furthermore, to enhance the clinical utility of the risk score, an accurate nomogram was constructed by combining the characteristics of this study.
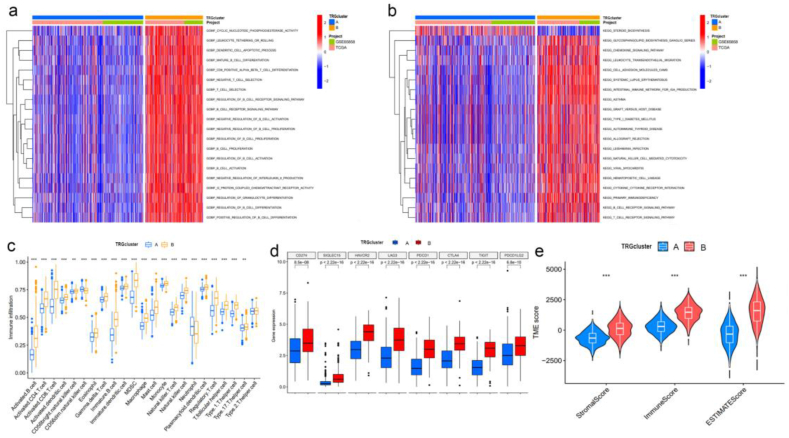
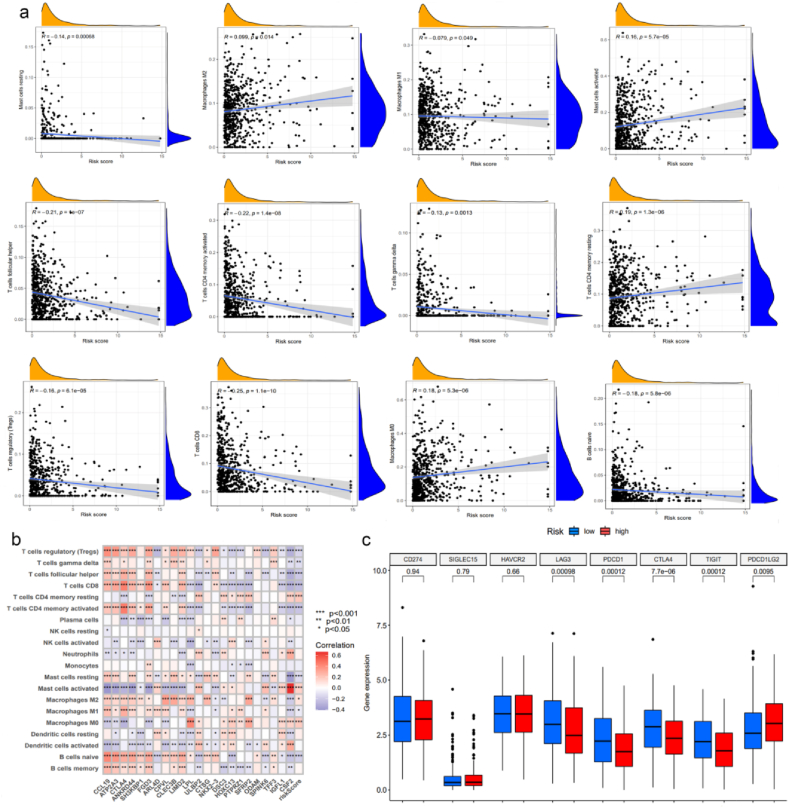
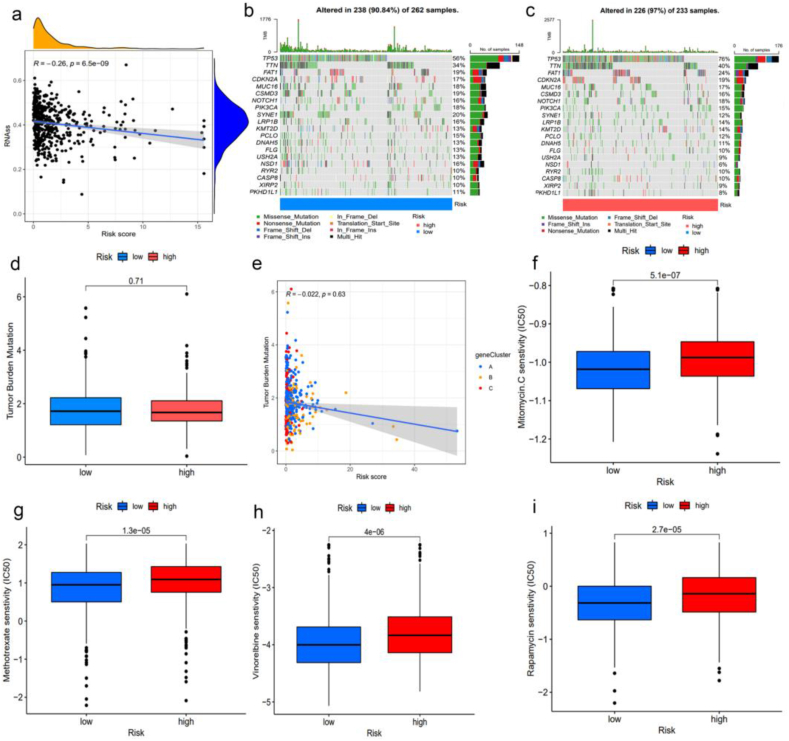
Results: The low-risk score observed in this study was associated with high levels of immune checkpoint expression and TME immune activation, indicating a favorable OS outcome. Additionally, various factors related to risk scores were depicted.
Conclusion: Through comprehensive analysis of TRGs in HNSC, our study has revealed the characteristics of the TME and prognosis, providing a basis for further investigation into TRGs and the development of more effective immunotherapy and targeted therapy strategies.
Keywords: Immunotherapy; Nomogram; Prognosis; T cell proliferation-related genes; Tumor microenvironment.
© 2024 The Authors.
Conflict of interest statement
The authors declare that they have no known competing financial interests or personal relationships that could have appeared to influence the work reported in this paper.
Figures
Similar articles
-
Identification of Hypoxia-Related Subtypes, Establishment of Prognostic Models, and Characteristics of Tumor Microenvironment Infiltration in Colon Cancer.Front Genet. 2022 Jun 17;13:919389. doi: 10.3389/fgene.2022.919389. eCollection 2022. Front Genet. 2022. PMID: 35783281 Free PMC article.
-
Prognostic impact of intra- and peritumoral immune cell subpopulations in head and neck squamous cell carcinomas - comprehensive analysis of the TCGA-HNSC cohort and immunohistochemical validation on 101 patients.Front Immunol. 2023 Jun 13;14:1172768. doi: 10.3389/fimmu.2023.1172768. eCollection 2023. Front Immunol. 2023. PMID: 37383237 Free PMC article.
-
Prognostic significance of senescence-related tumor microenvironment genes in head and neck squamous cell carcinoma.Aging (Albany NY). 2023 Dec 21;16(2):985-1001. doi: 10.18632/aging.205346. Epub 2023 Dec 21. Aging (Albany NY). 2023. PMID: 38154113 Free PMC article.
-
Cuproptosis combines immune landscape providing prognostic biomarker in head and neck squamous carcinoma.Heliyon. 2023 May 3;9(5):e15494. doi: 10.1016/j.heliyon.2023.e15494. eCollection 2023 May. Heliyon. 2023. PMID: 37215927 Free PMC article.
-
NT5E upregulation in head and neck squamous cell carcinoma: A novel biomarker on cancer-associated fibroblasts for predicting immunosuppressive tumor microenvironment.Front Immunol. 2022 Aug 26;13:975847. doi: 10.3389/fimmu.2022.975847. eCollection 2022. Front Immunol. 2022. PMID: 36091055 Free PMC article.
Cited by
-
Multicenter validation of an RNA-based assay to predict anti-PD-1 disease control in patients with recurrent or metastatic head and neck squamous cell carcinoma: the PREDAPT study.J Immunother Cancer. 2024 Nov 3;12(11):e009573. doi: 10.1136/jitc-2024-009573. J Immunother Cancer. 2024. PMID: 39489541 Free PMC article.
References
-
- Sung H., Ferlay J., Siegel R.L., Laversanne M., Soerjomataram I., Jemal A., et al. Global cancer statistics 2020: GLOBOCAN estimates of incidence and mortality worldwide for 36 cancers in 185 countries. CA Cancer J Clin. 2021;71(3):209–249. - PubMed
-
- Leemans C.R., Snijders P.J.F., Brakenhoff R.H. The molecular landscape of head and neck cancer. Nat. Rev. Cancer. 2018;18(5):269–282. - PubMed
-
- Cramer J.D., Burtness B., Le Q.T., Ferris R.L. The changing therapeutic landscape of head and neck cancer. Nat. Rev. Clin. Oncol. 2019;16(11):669–683. - PubMed
LinkOut - more resources
Full Text Sources
