. 2024 Sep 9;52(16):9417-9430.
doi: 10.1093/nar/gkae669.

CoPixie, a novel algorithm for single-particle track colocalization, enables efficient quantification of telomerase dynamics at telomeres

Affiliations

CoPixie, a novel algorithm for single-particle track colocalization, enables efficient quantification of telomerase dynamics at telomeres

Samuel Prince et al. Nucleic Acids Res. .

Abstract

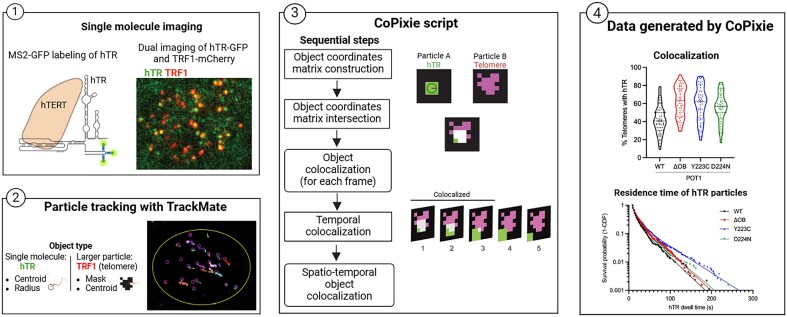
Single-particle imaging and tracking can be combined with colocalization analysis to study the dynamic interactions between macromolecules in living cells. Indeed, single-particle tracking has been extensively used to study protein-DNA interactions and dynamics. Still, unbiased identification and quantification of binding events at specific genomic loci remains challenging. Herein, we describe CoPixie, a new software that identifies colocalization events between a theoretically unlimited number of imaging channels, including single-particle movies. CoPixie is an object-based colocalization algorithm that relies on both pixel and trajectory overlap to determine colocalization between molecules. We employed CoPixie with live-cell single-molecule imaging of telomerase and telomeres, to test the model that cancer-associated POT1 mutations facilitate telomere accessibility. We show that POT1 mutants Y223C, D224N or K90E increase telomere accessibility for telomerase interaction. However, unlike the POT1-D224N mutant, the POT1-Y223C and POT1-K90E mutations also increase the duration of long-lasting telomerase interactions at telomeres. Our data reveal that telomere elongation in cells expressing cancer-associated POT1 mutants arises from the dual impact of these mutations on telomere accessibility and telomerase retention at telomeres. CoPixie can be used to explore a variety of questions involving macromolecular interactions in living cells, including between proteins and nucleic acids, from multicolor single-particle tracks.


Figures

Graphical Abstract
Graphical Abstract
Figure 1.
Figure 1.
Description of CoPixie and the hTR–telomerase interaction pipeline. (A) The object types used by CoPixie: (i) a centroid plus radius for single molecules; (ii) a mask plus a centroid for larger particles; and (iii) a single mask plus an x, y position for slow-moving structures. (B) Schema summarizing the sequential steps of the CoPixie script. (C) Description of the pipeline for the analysis of colocalization events between hTR and telomeres using ImageJ and CoPixie.
Figure 2.
Figure 2.
Validation of CoPixie. (A) Tracks from fluorescent beads imaged by dual cameras and analyzed with TrackMate. Overlay of tracks from the two channels of the same movie, matching (left), and tracks from different movies, non-matching (right). (B) Percentage of track colocalizations for matching and non-matching movies as measured by CoPixie. ****P< 0.001. (C) Particles of hTR are detected (circles) and tracked using TrackMate. Overlay of a single image of hTR (MCP-sfGFP) and telomeres (mCherry-TRF1). Scale bars: 5 μm. (D) Data from Laprade et al. (23) were re-analyzed using the CoPixie pipeline. N = 29 cells expressing POT1-ΔOB and 28 cells expressing POT1-WT (wild-type). **P< 0.01; ns: not significant.
Figure 3.
Figure 3.
The K90E mutation in POT1 increases telomerase access to telomeres. (A) Western blot analysis to assess the expression level of myc-tagged POT1-WT, POT1-ΔOB and POT1-K90E in HeLa hTR5′MS2 cells. β-Tubulin was used as a loading control. Empty: cells infected with empty vector. (B) Immunofluorescence on myc-tagged POT1-WT, POT1-ΔOB and POT1-K90E in HeLa hTR5′MS2 cells. Immunostaining was performed with anti-myc antibody and telomeres were detected with mCherry-TRF1. Empty: cells infected with empty vector. DAPI: nuclear DNA. Scale bars: 5 μm. (C) Percentage of telomeres colocalized with hTR in hTR5′MS2 + hTERT cells expressing empty vector, POT1-WT, POT1-ΔOB or POT1-K90E. *P< 0.05; ****P< 0.001. N = 58–65 cells. (D) Survival probability analysis of individual hTR particles at telomeres in hTR5′MS2 + hTERT cells expressing the empty vector, POT1-WT, POT1-ΔOB or POT1-K90E. Each curve represents data merged from 58 to 65 cells from three to four independent replicates. (E) Survival probability analysis of the cumulative dwell time of hTR particles at individual telomeres in hTR5′MS2 + hTERT cells expressing the empty vector, POT1-WT, POT1-ΔOB or POT1-K90E. Each curve represents data merged from 700 to 1020 tracks from 58 to 65 cells. Statistical difference between groups was determined using the log-rank test: empty versus WT: P< 0.0001; WT versus ΔOB: P= 0.005; WT versus K90E: P= 0.0023.
Figure 4.
Figure 4.
Expression of POT1-K90E increases the long-lasting interactions of hTR with telomeres. (A) Percentage of telomeres colocalized with hTR particles in hTR5′MS2 + hTERT cells expressing the empty vector, POT1-WT, POT1-ΔOB or POT1-K90E. ****P< 0.001; ns: not significant. N = 52–62 cells. (B) Survival probability analysis of individual hTR particles at telomeres in hTR5′MS2 + hTERT cells expressing the empty vector, POT1-WT, POT1-ΔOB or POT1-K90E. Each curve represents data merged from 36 to 41 cells from three independent replicates. (C) Residence time of slow hTR particles at telomeres from survival probability analysis of individual biological replicates from hTR5′MS2 + hTERT cells expressing the empty vector, POT1-WT, POT1-ΔOB or POT1-K90E. *P< 0.05; ns: not significant. (D) Survival probability analysis of the cumulative dwell time of hTR particles at individual telomeres in hTR5′MS2 + hTERT cells expressing the empty vector, POT1-WT, POT1-ΔOB or POT1-K90E. Each curve represents data merged from 700 to 900 tracks from 52 to 62 cells. Statistical difference between groups was determined using the log-rank test: empty versus WT: P= 0.0268; WT versus ΔOB: P= 0.0199; WT versus K90E: P< 0.0001.
Figure 5.
Figure 5.
POT1 mutations Y223C and D224N increase telomerase access at telomeres. (A) Western blot analysis to monitor expression level of myc-tagged POT1-WT, POT1-ΔOB, POT1-Y223C and POT1-D224N in HeLa hTR5′MS2 cells. α-Tubulin was used as a loading control. CTL: negative control; *: nonspecific band. (B) Immunofluorescence on myc-tagged POT1-WT and mutants in HeLa hTR5′MS2 cells. Immunostaining was performed with anti-myc antibody and telomeres were detected with mCherry-TRF1. DAPI: nuclear DNA. Scale bars: 8 μm. (C) Percentage of telomeres colocalized with hTR in hTR5′MS2 + hTERT cells expressing POT1-WT, POT1-ΔOB, POT1-Y223C or POT1-D224N. ****P< 0.001. N = 85–95 cells. (D) Survival probability analysis of individual hTR particles at telomeres in hTR5′MS2 + hTERT cells expressing POT1-WT, POT1-ΔOB, POT1-Y223C or POT1-D224N. Each curve represents data merged from 85 to 95 cells from three independent replicates. (E) Survival probability analysis of the cumulative dwell time of hTR particles at individual telomeres in hTR5′MS2 + hTERT cells expressing POT1-WT, POT1-ΔOB, POT1-Y223C or POT1-D224N. Each curve represents data merged from 1270 to 1460 tracks from 85 to 95 cells. Statistical differences between groups were determined using the log-rank test: WT versus ΔOB: P< 0.0001; WT versus Y223C: P= 0.0112; WT versus D224N: P< 0.0001.
Figure 6.
Figure 6.
Long-term residence time of hTR at telomeres is increased in the POT1-Y223C mutant. (A) Percentage of telomeres colocalized with hTR in hTR5′MS2 + hTERT cells expressing POT1-WT, POT1-ΔOB, POT1-Y223C or POT1-D224N. ****P< 0.001. N = 55–66 cells. (B) Survival probability analysis of individual hTR particles at telomeres in hTR5′MS2 + hTERT cells expressing POT1-WT, POT1-ΔOB, POT1-Y223C or POT1-D224N. Each curve represents data merged from 55 to 66 cells from three to four independent replicates. (C) Residence time of slow hTR particles at telomeres from survival probability analysis of individual biological replicates from hTR5′MS2 + hTERT cells expressing POT1-WT, POT1-ΔOB, POT1-Y223C or POT1-D224N. *P< 0.05. (D) Survival probability analysis of the cumulative dwell time of hTR particles at individual telomeres in hTR5′MS2 + hTERT cells expressing POT1-WT, POT1-ΔOB, POT1-Y223C or POT1-D224N. Each curve represents data merged from 500 to 700 tracks from 55 to 66 cells. Statistical difference between groups was determined using the log-rank test: WT versus ΔOB: P< 0.0001; WT versus Y223C: P< 0.0001; WT versus D224N: P= 0.0002.

References

    1. Lagache T., Sauvonnet N., Danglot L., Olivo-Marin J.-C.. Statistical analysis of molecule colocalization in bioimaging. Cytometry A. 2015; 87:568–579. - PubMed
    1. Vega-Lugo J., da Rocha-Azevedo B., Dasgupta A., Jaqaman K.. Analysis of conditional colocalization relationships and hierarchies in three-color microscopy images. J. Cell Biol. 2022; 221:e202106129. - PMC - PubMed
    1. Luo F., Qin G., Xia T., Fang X.. Single-molecule imaging of protein interactions and dynamics. Annu. Rev. Anal. Chem. 2020; 13:337–361. - PubMed
    1. Pageon S.V., Nicovich P.R., Mollazade M., Tabarin T., Gaus K.. Clus-DoC: a combined cluster detection and colocalization analysis for single-molecule localization microscopy data. Mol. Biol. Cell. 2016; 27:3627–3636. - PMC - PubMed
    1. Lagache T., Grassart A., Dallongeville S., Faklaris O., Sauvonnet N., Dufour A., Danglot L., Olivo-Marin J.-C.. Mapping molecular assemblies with fluorescence microscopy and object-based spatial statistics. Nat. Commun. 2018; 9:698. - PMC - PubMed

LinkOut - more resources