. 2024 Jul 31;8(8):e0510.
doi: 10.1097/HC9.0000000000000510. eCollection 2024 Aug 1.

A plasma peptidomic signature reveals extracellular matrix remodeling and predicts prognosis in alcohol-associated hepatitis

Affiliations

A plasma peptidomic signature reveals extracellular matrix remodeling and predicts prognosis in alcohol-associated hepatitis

Khaled Sayed et al. Hepatol Commun. .

Abstract

Background: Alcohol-associated hepatitis (AH) is plagued with high mortality and difficulty in identifying at-risk patients. The extracellular matrix undergoes significant remodeling during inflammatory liver injury and could potentially be used for mortality prediction.

Methods: EDTA plasma samples were collected from patients with AH (n = 62); Model for End-Stage Liver Disease score defined AH severity as moderate (12-20; n = 28) and severe (>20; n = 34). The peptidome data were collected by high resolution, high mass accuracy UPLC-MS. Univariate and multivariate analyses identified differentially abundant peptides, which were used for Gene Ontology, parent protein matrisomal composition, and protease involvement. Machine-learning methods were used to develop mortality predictors.

Results: Analysis of plasma peptides from patients with AH and healthy controls identified over 1600 significant peptide features corresponding to 130 proteins. These were enriched for extracellular matrix fragments in AH samples, likely related to the turnover of hepatic-derived proteins. Analysis of moderate versus severe AH peptidomes was dominated by changes in peptides from collagen 1A1 and fibrinogen A proteins. The dominant proteases for the AH peptidome spectrum appear to be CAPN1 and MMP12. Causal graphical modeling identified 3 peptides directly linked to 90-day mortality in >90% of the learned graphs. These peptides improved the accuracy of mortality prediction over the Model for End-Stage Liver Disease score and were used to create a clinically applicable mortality prediction assay.

Conclusions: A signature based on plasma peptidome is a novel, noninvasive method for prognosis stratification in patients with AH. Our results could also lead to new mechanistic and/or surrogate biomarkers to identify new AH mechanisms.


Conflict of interest statement

Craig J. McClain consults for Altimmune and Novo Nordisk. He received grants from the NIH and VAMC. Ramon Bataller consults for GlaxoSmithKline, Novo Nordisk, and Boehringer. He is on the speaker’s bureau for Abbvie and Gilead. The remaining authors have no conflicts to report.

Figures

None
Graphical abstract
FIGURE 1
FIGURE 1
Study design. (A) Consort diagram. (B) Analytic workflow. Plasma proteins were precipitated with TCA. The peptidome was concentrated and desalted using solid phase extraction before data collection using high-resolution, high mass accuracy UPLC-MS. Database and de novo MS spectral assignments were made using Peaks Xpro. Raw peptide abundances were normalized based on total XICs and then preprocessed within Metaboanalyst. Data were mined by univariate and multivariate statistical methods for differentially abundant peptides and peptide groups, for Gene Ontology (Panther), parent protein matrisomal composition (MatrisomeAnnotator), and protease involvement (Proteasix). Machine-learning methods were initiated with patient-specific TIC-normalized peptidome and clinical scoring data (eg, MELD, 90 d mortality). Data were preprocessed to address missing values and leave-one-out causal graphs to build a selected variables data set. The performance of the selected variables with or without MELD scores was compared to MELD alone using a 5-fold validation and logistic regression to establish model parameters and prediction of 90-day mortality in AH. Abbreviations: AH, alcohol-associated hepatitis; MELD, Model for End-Stage Liver Disease; TCA, trichloroacetic acid; TIC, total ion chromatogram; XIC, extracted ion chromatogram.
FIGURE 2
FIGURE 2
Plasma peptidome quantitative and qualitative analyses. Volcano plot for significant differences (FC >±1.5; p < 0.05). Significant peptide data points were labeled using the gene name. The analysis defines shifts of increased FBA in moderate and increased collagen (eg, CO1A1) peptides in severe AH. Inset: Plasma peptidome analysis by Venn diagram for prevalence (AH-moderate vs. AH–severe). Abbreviations: AH, alcohol-associated hepatitis; CO1A1, collagen 1A1; FBA, fibrinopeptide A.
FIGURE 3
FIGURE 3
Plasma peptidome features analysis. (A) PCA analysis showing principal components PC1 and PC2 for self-sorting of healthy control (green), moderate AH (blue), and severe AH (red) samples as defined by 95% CIs. Healthy control samples are resolved from AH samples. (B) Two-group analysis of moderate AH versus severe AH samples demonstrates emerging self-sorting properties of the peptidome. (C) oPLS-DA analysis comparing AH severity. Complete separation of the moderate and severe AH peptidomes is achieved using discriminate analysis. (D) Major peptide features sorted by oPLS-DA of AH samples are prolyl-hydroxylated CO1A1 fragments (severe AH) and FBA fragments (moderate). Peptide fragments defined by parent protein Gene Name, amino acid (start, stop) location, and site-specific modifications: *, prolyl hydroxylation; a, acetylation; d, dehydration. Abbreviations: AH, alcohol-associated hepatitis; CO1A1, collagen 1A1; oPLS-DA, orthogonal partial least squared-discriminant analysis; PCA, principal component analysis.
FIGURE 4
FIGURE 4
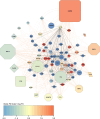
Cluster analysis of the peptidome/degradome in AH. The peptides significantly increased in AH were analyzed by the Proteasix (http://www.proteasix.org) algorithm using a PPV cutoff to 80%. Protein-protein interaction network analysis of regulated proteomic data sets (q-value <0.05) was performed using Search Tool for the Retrieval of Interacting Genes/Proteins, STRING v11, with the highest confidence score (0.900). The resultant matrix of both Proteasix and STRING analyses was visualized using Cytoscape v3.9.1. Node sizes of the predicted proteases represented the relative frequency with which the top 16 proteases were predicted to mediate the observed cleavage (0.2%–25%). Node shape for the proteases represents protease family subtype: serine (diamond), cysteine (square), aspartyl (parallelogram), and metalloproteases (octagon). Node color for protease corresponds to the Log2FC (vs. healthy control) of hepatic mRNA expression from previously published work. Raw data and metadata are publicly available in the Database of Genotypes and Phenotypes of the National Library of Medicine under the accession study code phs001807. Node sizes of the peptides represented the relative number of unique peptides (1–61) identified from each parent protein. Node colors of the peptides represented the median Log2FC versus healthy controls for all peptides derived from that parent protein. Solid lines depict connections between the parent proteins identified by STRING; broken lines depict predicted protease events identified by Proteasix. Abbreviations: AH, alcohol-associated hepatitis; PPV, positive predictive value.
FIGURE 5
FIGURE 5
CGM modeling of the peptidome and clinical features to predict AH outcome. (A) Sensitivity and specificity of the 5-fold cross-validation during the prediction phase of model development. x-axis: the threshold used in the parameter sweep (range: 0.1–1.0). The intersection of sensitivity and specificity was used to determine the optimal threshold for each fold in each model. (B) Density distribution of 90-day survival classification over different cutoff probability thresholds. Models 2 and 3 offer better separation of the 2 categories than the MELD score alone. Abbreviations: AH, alcohol-associated hepatitis; MELD, Model for End-Stage Liver Disease.
FIGURE 6
FIGURE 6
Comparison of model performance using the complete data set. (A) Comparison of model performance using the complete data set. The tables show the number of correctly and incorrectly classified samples. Sensitivity, specificity, and balanced accuracy summarize these results. Kaplan-Maier survival plots depict the discrimination ability of the 3 models. (B) Visualization of the distribution of selected predictive variables of 90-day survival· In model 1, which uses the MELD score only, the MELD variable is the only significantly different variable in the 2 predicted classes.· In model 2 (peptidomic features), MELD is also significant, even though it was not used in model 2 to predict survival· The p value of the MELD score is less significant in model 2 than in the other 2 models where MELD was used as a predictive variable. Red boxes designate the variables that are used for prediction in each model. Abbreviation: MELD, Model for End-Stage Liver Disease.

Update of

References

    1. Torok NJ. Update on alcoholic hepatitis. Biomolecules. 2015;5:2978–2986. - PMC - PubMed
    1. Lucey MR, Mathurin P, Morgan TR. Alcoholic hepatitis. N Engl J Med. 2009;360:2758–2769. - PubMed
    1. Seitz HK, Bataller R, Cortez-Pinto H, Gao B, Gual A, Lackner C, et al. Alcoholic liver disease. Nat Rev Dis Primers. 2018;4:16. - PubMed
    1. Louvet A, Labreuche J, Artru F, Boursier J, Kim DJ, O’Grady J, et al. Combining data from liver disease scoring systems better predicts outcomes of patients with alcoholic hepatitis. Gastroenterology. 2015;149:398–406.e398; quiz e316–397. - PubMed
    1. Degré D, Wandji LCN, Moreno C, Louvet A. Alcoholic hepatitis: Towards an era of personalised management. United European Gastroenterol J. 2020;8:995–1002. - PMC - PubMed

Publication types

LinkOut - more resources