. 2024 Dec;78(4):199-213.
doi: 10.1007/s10858-024-00445-8. Epub 2024 Jul 31.

Transverse relaxation optimized spectroscopy of NH2 groups in glutamine and asparagine side chains of proteins

Affiliations

Transverse relaxation optimized spectroscopy of NH2 groups in glutamine and asparagine side chains of proteins

Vitali Tugarinov et al. J Biomol NMR. 2024 Dec.

Abstract

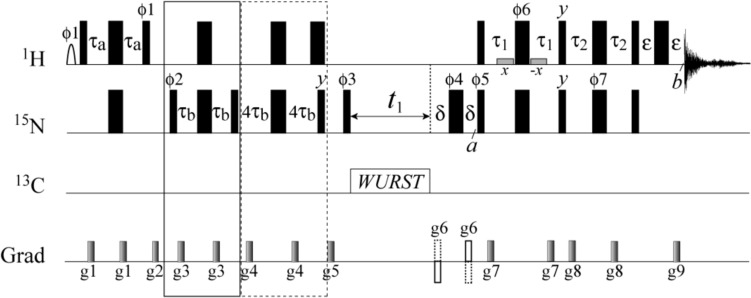
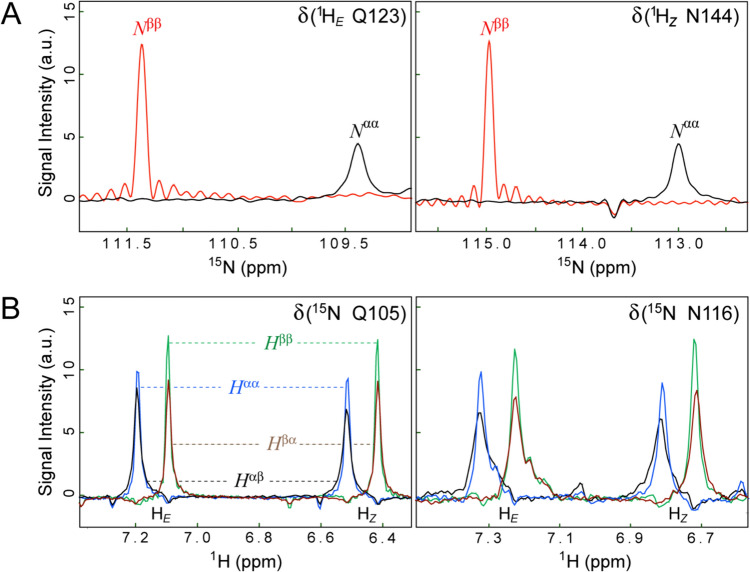
A transverse relaxation optimized spectroscopy (TROSY) approach is described for the optimal detection of NH2 groups in asparagine and glutamine side chains of proteins. Specifically, we have developed NMR experiments for isolating the slow-relaxing 15N and 1H components of NH2 multiplets. Although even modest sensitivity gains in 2D NH2-TROSY correlation maps compared to their decoupled NH2-HSQC counterparts can be achieved only occasionally, substantial improvements in resolution of the NMR spectra are demonstrated for asparagine and glutamine NH2 sites of a buried cavity mutant, L99A, of T4 lysozyme at 5 ºC. The NH2-TROSY approach is applied to CPMG relaxation dispersion measurements at the side chain NH2 positions of the L99A T4 lysozyme mutant - a model system for studies of the role of protein dynamics in ligand binding.

Keywords: 15N CPMG relaxation dispersion; Chemical exchange; Cross correlated relaxation in NH2 groups; Transverse relaxation optimized spectroscopy (TROSY).


Conflict of interest statement

Declarations. Competing interests: The authors have no competing interests to declare that are relevant to the content of this article.

Figures

Fig. 1
Fig. 1
NMR transitions in an 15N–1H2 spin-system. A Energy level diagram of an isolated AMX (15N1H11H2) spin system (NH2 group). Three symbols, ‘α’ or ‘β’, label each eigenstate, with the first symbol corresponding to the state of 15N, and the last two symbols, to the spin states of hydrogens H1 and H2. Diagonal solid arrows depict 15N transitions, each labeled with the single-transition operator defined in Eq. 1 and the Supplementary Information, SI, Eq. S1. Diagonal dashed arrows depict 1H transitions labeled with single-transition operators defined in Eq. 4 and SI, Eq. S4. The 15N transition associated with the slowest transverse relaxation rate and selected for in NH2-TROSY experiments is colored in red. The 1H transitions usually associated with the slowest transverse relaxation rates are colored in green, while those that can occasionally be associated with the slowest rates, are shown in blue. B Schematic representation of the 2D multiplet pattern observed for an individual 1H spin of an 15N–1H2 spin-system in the HSQC experiment performed without de-coupling in either dimension. The pattern is drawn for 1JNH < 0, 2JHH > 0, and 1JNH1 = 1JNH2. For 1JNH1 = 1JNH2, the intensities of 15N transitions Nαβ and Nβα vanish (shown with open circles). The frequencies of 15N and 1H nuclei are labeled with δN and δH, respectively. Horizontal, short-dashed and vertical, long-dashed lines depict 15N and 1H transitions, respectively. The transverse relaxation rate of each 15N transition is defined in Eqs. 2, 3 and SI, Eqs. S2–S3, while that of each 1H transition, in Eqs. 5, 6 and SI, Eqs. S5–S6. The 15N transition associated with the slowest transverse relaxation rate is colored in red, while the 1H peaks usually (Hββ) or incidentally (Hαα) associated with the slowest transverse relaxation rate (highest intensity) are colored in green and blue, respectively (see text) The outer 1H transitions, Hαβ and Hβα, are shown in black and brown, respectively
Fig. 2
Fig. 2
Typical orientations of the CSA tensors of (A) 15N nuclei, and (B) 1HZ and 1HE nuclei in carboxamide NH2 groups. The directions of N–H bond vectors and the vectors connecting the two 1H nuclei are extended with short dashed lines. The angles θN,NH1CSA,DD and θN,NH2CSA,DD in Eqs. 3d–e are labeled by ‘αN’ and ‘βN’, respectively, in (A). The angles θH,HNCSA,DD and θH,HHCSA,DD in Eqs. 6e–f are labeled by ‘αH’ and ‘βH’, respectively, in (B). See ‘Materials and Methods’ for details of DFT calculations and SI, Tables S1 and S2 for the principal values and orientations of the 15N and 1HE/1HZ CSA tensors, respectively, obtained from the calculation with the program Gaussian for non-hydrogen-bonded and hydrogen-bonded side chain NH2 group of Gln41 in the protein ubiquitin
Fig. 3
Fig. 3
Plots showing the dependence of 15N TROSY linewidths (15N-R2/π; Hz) on the strength of the static magnetic field, B0, expressed in units of 1H frequency (GHz) for isolated 15N–1H (black) and 15N–1H2 (red) spin-systems. The calculations were performed for the product S2τC equal to 25 ns using the angles θN,NH1CSA,DD = 20º and θN,NH2CSA,DD = 40º for 15N–1H2 spin-systems, and the angle θN,NHCSA,DD = 16º for 15N–1H spin-systems. 15N CSA (ΔσN) values of  -152 ppm and -164 ppm for NH2 and NH groups, respectively, were used, along with the N–H internuclear distance rNH = 1.02 Å for both spin-systems. Note that the minimal 15N linewidths of NH2 groups (red) is ever so slightly narrower (by 2.5%) than that of their NH counterparts (black). This is a consequence of NH-NH dipole–dipole cross correlated relaxation in NH2 spin-systems, Eq. (3c). Although relatively small in magnitude (see text), these cross correlations lead to the same narrowing of the lines of both the TROSY (Nββ) and anti-TROSY (Nαα) 15N components in NH2 groups. When the contribution of NH–NH dipole–dipole cross correlated relaxation is excluded from the calculation, the minimal linewidth for NH2 groups becomes 2.6-fold broader than that of its NH counterpart (the red curve shifting upwards by ~2.7 Hz)
Fig. 4
Fig. 4
Pulse scheme for selection of each of the eight NH2 multiplet components. All narrow and wide rectangular pulses are applied with flip-angles of 90° and 180°, respectively, along the x-axis unless indicated otherwise. The 1H carrier is positioned at the water resonance, while the 15N carrier is placed at 110 ppm. All 15N pulses are applied with the highest possible power (RF field strength 6.25 kHz). The steady-state Boltzmann 15N polarization is added to the magnetization transferred from 1H by appropriate choice of the phase ϕ1. 13C decoupling is intended for U-[13C; 15N]-labeled samples and is achieved using 180º adiabatic WURST-20 pulses (Kupce and Freeman 1996) (2.5 ms; ± 30 kHz inversion bandwidth) in a p5m4 composite decoupling scheme (Tycko et al. 1985), with the 13C carrier placed at 110 ppm. These pulses are designed for simultaneous decoupling of carbonyl (13C′) and aliphatic (13Cα/β/γ) carbon regions. The shaped 1Hϕ1 pulse at the beginning of the scheme is a ~7 ms 90º water selective pulse applied with an EBURP-1 profile (Geen and Freeman 1991). To achieve good suppression of the water signal for any phase of the 1Hϕ6 pulse (2τ1 period), this pulse is flanked by two rectangular water-selective 1H pulses (shown with shaded rectangles) of ~1.5 ms duration applied with the phases x and -x, respectively. Delays are as follows: τa = 2.25 ms; τb = 1/(16JNH) = 690 μs; τ1 = 0.34/(2JNH) = 1.89 ms; τ2 = 0.23/(2JNH) = 1.28 ms; δ = 800 μs; ε = 500 μs. The phase cycling for ϕ1, ϕ2, ϕ6 and ϕ7 is as indicated in Table 1; ϕ3 = 2(x), 2(-x); ϕ4 = 2(x), 2(-x), 2(y), 2(-y); ϕ5 = x; receiver = x,-x,-x,x, -x,x,x,-x. The durations and strengths of the pulsed-field gradients applied along the z-axis in units of (ms; G/cm) are: g1 = (0.4; 35), g2 = (1.5; 40), g3 = (0.3; 35), g4 = (0.5; 35), g5 = (1.0; 35), g6 = (0.5; 30), g7 = (0.1; 35), g8 = (0.4; 35), g9 = (0.102; 30). In addition, each of the encoding and decoding gradients g6 and g9 are applied along the x and y axes with the strengths of ~15 G/cm. Quadrature detection in t1 is achieved using the Rance-Kay gradient selection scheme (Kay et al. ; Schleucher et al. 1993), with ϕ5 inverted together with the gradients g6 for each complex point in t1
Fig. 5
Fig. 5
The components of the NH2 multiplet obtained for the buried cavity mutant of T4 lysozyme (5 ºC; 900 MHz) with the pulse scheme of Fig. 4. (A) 1D traces showing NH2 multiplet components along the 15N(F1) dimension of the 2D spectra recorded with the pulse scheme of Fig. 4 and selection of the narrowest 1H transitions (Hββ). The traces are drawn at the 1H chemical shifts δ of Gln123 and Asn144 of the T4 lysozyme mutant and are extracted from the 2D spectra processed without apodization in the 15N dimension. (B) 1D traces showing NH2 multiplet components along the 1H(F2) dimension of the 2D spectra acquired using the experiment of Fig. 4 with selection of the narrowest 15N transitions (Nββ). The traces are drawn at the 15N chemical shifts δ of Gln105 and Asn116, and are extracted from the 2D spectra processed without apodization in the 1H dimension. All multiplet components are colored with the same color-coding scheme as in Fig. 1
Fig. 6
Fig. 6
Comparison of a fully decoupled HSQC optimized for 15N–1H2 spin-systems with the NH2-TROSY experiment (the scheme of Fig. 4 with selection of the Nββ and Hββ components). A A region of 2D NH2 correlation maps obtained with the fully decoupled NH2-HSQC experiment (Left panel) and NH2-TROSY experiment (Right panel) recorded at 900 MHz on the U-[15N]-labeled sample of the buried cavity mutant of T4 lysozyme (5 ºC). The 2D spectra were processed using identical parameters, without apodization in either dimension, and plotted at the same contour levels. Note the different 15N chemical shift axes of the two panels chosen for easier comparison. Selected assignments of the NH2 sites are shown in the Left panel, with tentative assignments labeled with asterisks. B 1D traces taken along the 15N(F1) dimension of the 2D correlation maps at the frequencies δ marked by vertical long-dashed lines (labeled ‘1’ and ‘2’ for the 1HZ proton of Asn144 and 1HE proton of Gln123, respectively) in the Right panel of (A). C 1D traces along the 1H(F2) dimension of the 2D correlation maps at the frequencies δ marked by horizontal long-dashed lines (labeled ‘3’ and ‘4’ for 15N of Asn144 and Gln123, respectively) in the Right panel of (A). The peaks reaching maximum intensity in the Bottom row (‘4’) are marked with asterisks
Fig. 7
Fig. 7
Application of NH2-TROSY to CPMG relaxation dispersion measurements. A Pulse scheme for the NH2-TROSY based 15N CPMG relaxation dispersion experiment. All experimental parameters including durations of delays and durations/strengths of pulsed field gradients, are as listed in Fig. 4. The delay T is the total duration of the relaxation period, during which the train of 180º 15N CPMG pulses is applied with phase x. The phase cycling is: ϕ1 = 45º, 225º; ϕ2 = 2(x), 2(-x); ϕ3 = 2(x), 2(-x), 2(y), 2(-y); ϕ4 = x; receiver = x,-x,-x,x, -x,x,x,-x. Quadrature detection in t1 is achieved using the Rance-Kay gradient selection scheme (Kay et al. ; Schleucher et al. 1993), with the phase ϕ4 inverted together with the gradients g6 for each complex point in t1. B Selected relaxation dispersion profiles obtained for the L99A mutant of T4 lysozyme at 600 and 800 MHz (5 ºC). Experimental data are shown with open circles; continuous solid lines represent best-fits to the 2-state exchange model. The upper pair of profiles (shown with dark blue and magenta lines for 600 and 800 MHz, respectively) was recorded using the fully decoupled NH2-HSQC based CPMG experiment of (Mulder et al. 2001), while the lower pair of profiles (shown with light blue and red lines for 600 and 800 MHz, respectively) were obtained with the experiment shown in panel (A). The indicated exchange parameters are averages over individual N–H correlations within NH2 groups and extracted from the best-fits of the NH2-TROSY CPMG dispersion profiles. See SI, Table S3, comparing the exchange parameters for the three sites in panel (B) derived from different variants of CPMG experiments

References

    1. Becke AD (1993) Density-functional thermochemistry. III. The role of exact exchange. J Chem Phys 98:5648–5652
    1. Bodenhausen G, Ruben DJ (1980) Natural abundance nitrogen-15 NMR by enhanced heteronuclear spectroscopy. Chem Phys Lett 69:185–189
    1. Boeszoermenyi A, Chhabra S, Dubey A, Radeva DL, Burdzhiev NT, Chanev CD, Petrov OI, Gelev VM, Zhang M, Anklin C, Kovacs H, Wagner G, Kuprov I, Takeuchi K, Arthanari H (2019) Aromatic 19F–13C TROSY: a background-free approach to probe biomolecular structure, function, and dynamics. Nat Methods 16:333–340 - PMC - PubMed
    1. Bystrov VF (1976) Spin-spin coupling and the conformational states of peptide systems. Prog Nucl Magn Reson Spectrosc 10:41–81
    1. Carlomagno T, Peti W, Griesinger C (2000) A new method for the simultaneous measurement of magnitude and sign of 1DCH and 1DHH dipolar couplings in methylene groups. J Biomol NMR 17:99–109 - PubMed

LinkOut - more resources