. 2024 Sep;11(36):e2405325.
doi: 10.1002/advs.202405325. Epub 2024 Jul 31.

Forkhead Box Protein K1 Promotes Chronic Kidney Disease by Driving Glycolysis in Tubular Epithelial Cells

Affiliations

Forkhead Box Protein K1 Promotes Chronic Kidney Disease by Driving Glycolysis in Tubular Epithelial Cells

Lu Zhang et al. Adv Sci (Weinh). 2024 Sep.

Abstract

Renal tubular epithelial cells (TECs) undergo an energy-related metabolic shift from fatty acid oxidation to glycolysis during chronic kidney disease (CKD) progression. However, the mechanisms underlying this burst of glycolysis remain unclear. Herein, a new critical glycolysis regulator, the transcription factor forkhead box protein K1 (FOXK1) that is expressed in TECs during renal fibrosis and exhibits fibrogenic and metabolism-rewiring capacities is reported. Genetic modification of the Foxk1 locus in TECs alters glycolytic metabolism and fibrotic lesions. A surge in the expression of a set of glycolysis-related genes following FOXK1 protein activation contributes to the energy-related metabolic shift. Nuclear-translocated FOXK1 forms condensate through liquid-liquid phase separation (LLPS) to drive the transcription of target genes. Core intrinsically disordered regions within FOXK1 protein are mapped and validated. A therapeutic strategy is explored by targeting the Foxk1 locus in a murine model of CKD by the renal subcapsular injection of a recombinant adeno-associated virus 9 vector encoding Foxk1-short hairpin RNA. In summary, the mechanism of a FOXK1-mediated glycolytic burst in TECs, which involves the LLPS to enhance FOXK1 transcriptional activity is elucidated.

Keywords: FOXK1; chronic kidney disease; glycolysis; phase separation; transcriptional regulation.


Conflict of interest statement

The authors declare no conflict of interest.

Figures
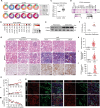
Figure 1
Figure 1
FOXK1 is significantly upregulated in fibrotic kidney featuring proximal TEC‐specific distribution. A) Pie diagrams displaying the proportional abundance of each cell cluster in each disease condition. B) Foxk1 gene expression analysis of a scRNA‐seq dataset (GSE190887) sourced from mice kidneys challenged with uni‐IRI or UUO at different time points. C) Relative mRNA level of FOXK1. FOXK1 expression in CKD kidney tissues from Nephroseq database (“Nakagawa CKD kidney” dataset, median‐centered log2). Unpaired t‐test. D) Single‐cell analysis of FOXK1 expression in kidney tissues from Diabetic Kidney Disease (DKD) and in para‐tumor kidney tissues from renal cancer patients as normal control. The samples were retrieved from the GSE151302, GSE131882 databases. PCT, proximal convoluted tubule; PTVCAM1, VCAM1(+) proximal tubule; PEC, parietal epithelial cells; ATL, ascending thin limb; TAL1, CLDN16(‐) thick ascending limb; TAL2, CLDN16(+) thick ascending limb; DCT1, early distal convoluted tubule; DCT2, late distal convoluted tubule; PC, principal cells; ICA, type A intercalated cells; ICB, type B intercalated cells; PODO, podocytes; ENDO, endothelial cells; FIB, fibroblasts; MES, mesangial cell; LEUK, leukocytes. E, F) Western blotting and statistical analysis of the FOXK1 expression in kidney tissues obtained from patients with obstructive nephropathy or para‐tumor tissue as control (n = 6 for each group). G) H&E, Masson, and immunohistochemistry staining in human kidney specimens from CKD patients or control subjects (para‐tumor group). Scale bar = 100 µm. H–J) Quantification of tubular damage score (H), and tubulointerstitial fibrosis percentage (I), FOXK1 protein expression (J) based on H&E, Masson, and immunohistochemistry staining in (G). K–M) Correlation between kidney FOXK1 expression and serum creatinine (Scr) (K), and blood urea nitrogen (L), and estimated glomerular filtration rate (eGFR) (M) for patients with CKD. N Immunofluorescence staining of FOXK1 (red) and LTL (green) or DBA (green) in human kidneys, DAPI (blue). Scale bar = 100 µm.
Figure 2
Figure 2
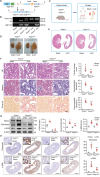
Tubular‐specific Foxk1‐deletion ameliorated kidney fibrosis in UUO model. A) Schematic diagram of the generation and identification of TEC‐specific Foxk1 knockout mouse (Foxk1 cKO ) and the control mouse with regular FOXK1 expression (Foxk1 flox/flox ). B) Genotyping of Foxk1 and Cre mice. PCR assay of mice from the indicated groups. C) Schematic diagram of generation of the UUO mouse model. Seven days after UUO, mice were sacrificed for kidney collection. D) Gross appearance of kidneys from the indicated groups. E) Photomicrographs exhibiting the Hematoxylin and eosin (H&E) staining of kidney sections from the indicated groups. Scale Bar = 2 mm. F) H&E, Masson staining, and Sirius red staining were applied to examine the tubular lesion and interstitial fibrosis in the renal tissue section from the indicated groups. Scale Bar = 50 µm. n = 5 mice per group. G) Western blotting of the protein expression of the related molecules in kidney tissues from the indicated group. n = 5 mice per group. Quantitative data are expressed as the mean ± S.E.M. *p < 0.05, compared to the sham group; #< 0.05, compared with Foxk1 flox/flox ‐UUO mice. H) IHC staining of the protein expression of the related molecules in kidney tissues from the indicated group. n = 5 mice per group. Quantitative data are expressed as the mean ± S.E.M. *p < 0.05, compared to the sham group; #< 0.05, compared with Foxk1 flox/flox ‐UUO mice.
Figure 3
Figure 3
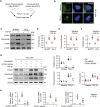
FOXK1 exerted pro‐fibrotic effects on TECs under TGF‐β1 stimulation. A) Schematic diagram of the in vitro experiments on renal tubular cells. Mouse proximal tubular cells (BUMPT) and human proximal tubular cells (HK‐2) were treated with 10 ng mL−1 TGF‐β1 for the indicated times. B) Immunofluorescence analysis was performed to detect the expression and distribution of FOXK1 in HK‐2 cells from the indicated groups. Scale Bar = 20 µm. C–F) Western blotting and statistical analysis of the protein expression of the related molecules in BUMPT cells or HK‐2 cells from the indicated group. Quantitative data are expressed as the mean ± S.E.M. *p < 0.05, compared to the control group. G) Western blotting and statistical analysis of the protein expression of the related molecules in HK‐2 cells from the indicated group. Quantitative data are expressed as the mean ± S.E.M. *p < 0.05, compared to the control group. #< 0.05, compared to TGF‐β1‐stimuli group. H) Relative mRNA levels of FOXK1, FN1, and α‐SMA in HK‐2 cells after transfected with FOXK1 shRNA or control shRNA, followed by TGF‐β1 treatment. Quantitative data are expressed as the mean ± S.E.M. *p < 0.05, compared to the control group. #< 0.05, compared to the TGF‐β1‐stimuli group. Representative images are shown from at least 3 independent experiments. Ctrl, control; TGF‐ β1, transforming growth factor β−1; FN1, Fibronectin; α‐SMA, alpha‐smooth muscle actin.
Figure 4
Figure 4
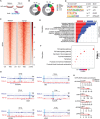
FOXK1 regulated glycolytic gene transcription. A) Schematic diagram of the ChIP‐seq analysis on HK‐2 cells under indicated treatment. B) Genomic distribution of FOXK1 in HK‐2 cells treated with TGF‐β1 or not for 24 h. C Heatmaps of ChIP‐seq signals (TSS ± 3 kb) for FOXK1 from the indicated groups. D) Motif analysis of genome‐wide FOXK1 binding sites, assessed by the HOMER motif analysis algorithm. E) The Gene Ontology analysis for the FOXK1 target genes induced by TGF‐β1. F) Kyoto Encyclopedia of Genes and Genomes (KEGG) analysis for the FOXK1 target genes induced by TGF‐β1. G) Visualization of ChIP‐seq data for FOXK1 target genes (SLC2A2, HK1, FBP1, ALDOA, BPGM, LDHC) in the genomic region. H) ChIP‐qPCR was performed to verify FOXK1 binding to the promoter of glycolysis‐related genes (SLC2A2, HK1, FBP1, ALDOA, BPGM, LDHC) in response to TGF‐β1 treatment in HK‐2 cells (n = 3). *p < 0.05, compared to the control group.
Figure 5
Figure 5
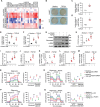
FOXK1 triggered glycolysis through transcriptional regulation of glycolytic‐related genes. A) Heat map showing the expression profile of glycolysis‐related gene sets in HK‐2 cells transfected with FOXK1 shRNA or control shRNA in the presence of TGF‐β1 or control medium. B) Culture medium color of the BUMPT or HK‐2 cells from the indicated groups. C–F) The concentration of lactate was detected by ELISA kit from the indicated groups. In some conditions, HK‐2 cells were transduced with lentivirus vectors carrying FOXK1 encoding or scrambled plasmid to generate FOXK1 overexpression (Lv‐FOXK1) or controlled (Lv‐ctrl) cells. Data are representative of 3 independent experiments. *p < 0.05, compared to the control group. #< 0.05, compared to the TGF‐β1‐stimuli group. G–J) Western blotting and statistical analysis of the protein expression of the related molecules in HK‐2 cells from the indicated group. *p < 0.05, compared to the control group. #< 0.05, compared to the TGF‐β1‐stimuli group. K–M) qRT‐PCR analysis of the expression of the related molecules in HK‐2 cells from the indicated group. *p < 0.05, compared to the control group. #< 0.05, compared to the TGF‐β1‐stimuli group. N) Extracellular acidification rate (ECAR) in cultured HK‐2 cells knocked down for FOXK1 in the presence of TGF‐β1 or control medium. Statistical analyses of glycolysis and glycolytic capacity in ECAR. 2‐DG, 2‐deoxy‐D‐glucose (n = 3 per group). *p < 0.05, compared to the control group. #< 0.05, compared to the TGF‐β1‐stimuli group. O) Oxygen consumption rate (OCR) in cultured HK‐2 cells knocked down for FOXK1 in the presence of TGF‐β1 or control medium. Statistical analyses of ATP production and maximal respiration in OCR (n = 3 per group). *p < 0.05, compared to the control group. #< 0.05, compared to the TGF‐β1‐stimuli group. P) ECAR in cultured HK‐2 cells overexpressing for FOXK1 in the presence of TGF‐β1 or control medium. Statistical analyses of glycolysis and glycolytic capacity in ECAR. 2‐DG, 2‐deoxy‐D‐glucose (n = 3 per group). *p < 0.05, compared to the control group. #< 0.05, compared to the TGF‐β1‐stimuli group. Q) Oxygen consumption rate (OCR) in cultured HK‐2 cells overexpressing for FOXK1 in the presence of TGF‐β1 or control medium. Statistical analyses of ATP production and maximal respiration in OCR (n = 3 per group). *p < 0.05, compared to the control group. #< 0.05, compared to the TGF‐β1‐stimuli group.
Figure 6
Figure 6
FOXK1 protein possesses the capacity to form liquid droplets. A) Graph of intrinsically disordered regions of FOXK1 as calculated by the VL‐XT algorithm (http://pondr.com/). The x‐axis indicates the position of the amino acid, and the y‐axis shows the score of PONDR VL‐XT. For PONDR prediction, a score of more than 0.5 indicates a high degree of disorder. Heavy bars indicate IDRs. B) Recombinant FOXK1‐mEGFP fusion protein resolved on an 8% SDS–PAGE gel and stained with Coomassie brilliant blue. C) Schematic illustration of droplet formation assay in vitro. D) Visualization of solution turbidity associated with droplet formation in vitro. Tubes containing FOXK1‐mEGFP or vector‐mEGFP in the presence (+) or absence (−) of PEG‐8000 or 1,6‐HD are shown. E) Representative fluorescence images of droplet formation at different concentrations of FOXK1‐mEGFP fusion protein or vector‐mEGFP were added to the droplet formation buffer to final concentrations as indicated. Quantification of the size and number of droplets are shown. Each dot represents a droplet. Data are mean ± S.E.M. Scale Bar = 5 µm. F) Representative images of droplet formation at different concentrations of NaCl solution as indicated. Representative images of dissolved droplets. FOXK1‐mEGFP in the 0% or 3% of 1,6‐HD are shown. Quantification of the area of droplets is shown. Each dot represents a droplet. Data are mean ± S.E.M. Scale Bar = 5 µm. G) Representative images of dissolved droplets. FOXK1‐mEGFP in the 0% or 3% of 1,6‐HD are shown. Quantification of the area of droplets is shown. Each dot represents a droplet. Data are expressed in mean ± S.E.M. Scale Bar = 5 µm. Two‐tailed unpaired Student's t‐test was used for statistical analysis. *< 0.05, compared to the control group.
Figure 7
Figure 7
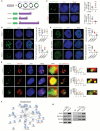
FOXK1 IDRs interact with RNA PoI II in liquid droplets inside the living cells. A) Schematic diagram of plasmid constructions of FOXK1 intrinsically disordered domains. Schematic showing the plasmids design and construction of IDRs of FOXK1. B) Representative images of nuclear puncta in HK‐2 cells transfected with different IDRs of FOXK1 fused to mEGFP: Lv‐FOXK1‐1‐mEGFP, Lv‐FOXK1‐2‐mEGFP, Lv‐FOXK1‐3‐mEGFP lentivirus vectors, Nuclei are stained with DAPI (blue). For each group, 30 cells (n  =  30) were quantified for the average number and size of puncta using ImageJ. Scale bar = 5 µm. Data are representative of 4 to 5 experiments. Data shown as the mean ± S.E.M.; two‐tailed unpaired Student's t‐test. C) Immunofluorescence imaging of mEGFP‐FOXK1‐2 in HK‐2 cells with or without 3% hexanediol treatment for 15 s. Quantification of the average number and size of puncta are shown on the right panel. Scale bar = 5 µm. D) Representative images of mEGFP‐FOXK1‐2 in HK‐2 cells at different concentrations of NaCl solution as indicated. Quantification of the average number and size of puncta are shown on the right panel. Data shown as the mean ± S.E.M. P value was determined by unpaired two‐tailed Student's t‐test. Scale Bar = 5 µm. *p < 0.05, compared to the control group. E) Representative image of HK‐2 cells transfected with mEGFP‐tagged FOXK1‐1, FOXK1‐2, FOXK1‐3 plasmids and stained with RNA Pol II (red) antibody and costained with DAPI (blue). Yellow frames show a higher magnification of the indicated areas. The images were captured using confocal microscopy. The related intensity profiles of FOXK1 with RNA PoI II were analyzed (white frames) by Zen Blue version 3.1. Scale bar = 5 µm. F) The interaction network of FOXK1 by Integrated Interactions Database (http://iid.ophid.utoronto.ca/SearchPPIs/protein/). G) Immunoprecipitation assay to detect the interaction between endogenous FOXK1 and RNA Pol II or POLR2K unit in HK‐2 cells with TGF‐β1 administration for 24 h.
Figure 8
Figure 8
AAV9‐mediated knockdown of renal Foxk1 mitigated kidney fibrosis in UUO mice model. A) Schematic diagram of FOXK1 knockdown in mice. Renal subcapsular delivery of the AAV9‐shCtrl or AAV9‐shFoxk1 to wild‐type C57BL/6 mice at 6 weeks of age. After the delivery for six weeks, the mice were subjected to UUO surgery. B) Fluorescence microscopic analysis of EGFP in frozen sections of mouse kidney at 1 week after injection of AAV9‐shCtrl or AAV9‐ shFoxk1. Nuclei were stained with DAPI (blue). Scale bar = 50 µm. C) qRT‐PCR analysis of Foxk1 mRNA abundance in the whole kidney of AAV9‐shCtrl or AAV9‐shFoxk1 mice. D) WB analysis of FOXK1 in the whole kidney of AAV9‐shCtrl or AAV9‐ shFoxk1 mice. E) Gross appearance of kidneys from the indicated groups. Scale bar = 5 mm. F) H&E, Masson staining, and Sirius red staining were applied to examine the tubular damage and tubulointerstitial fibrosis percentage in the renal tissue section from the indicated groups. Scale Bar = 50 µm. n = 5 mice per group. G–I) Quantification of tubular damage score (G), and tubulointerstitial fibrosis percentage (H, I). n = 5 mice per group. Quantitative data are expressed as the mean ± S.E.M. *p < 0.05, compared to the sham group; #< 0.05 compared with AAV9‐shCtrl‐UUO mice. J) Western blotting of the protein expression of the related molecules in kidney tissues from the indicated group. K) Schematic illustration of the role and mechanism of FOXK1‐triggered energic metabolism rewiring in TECs in the context of renal fibrosis. Transcriptional factor FOXK1 is specifically induced in proximal TECs as a response to insults such as insufficient oxygen supply, or fibrogenic factor TGF‐β1 stimulations. FOXK1 proteins translocated and enriched in the nucleus condensate into liquid droplets via the mechanism of LLPS. The RNA PoI II and the target gene motifs can be sequestrated together with FOXK1 in the droplets, resulting in the formation of membrane‐less compartments which allow FOXK1 to exercise the transcriptional activities with high efficacy. Through this mechanism, FOXK1 promotes the expression of a series of glycolysis‐related genes, such as Slc2a2, Hk1, Fbp1, Aldoa, Bpgm, Ldhc, and drives the shift of energy supply from FAO to glycolysis in TECs, which in turn aggravates renal fibrosis in CKD progression.

References

    1. Duffield J. S., J. Clin. Invest. 2014, 124, 2299. - PMC - PubMed
    1. Eddy A. A., Kidney Int. Suppl. 2014, 4, 2. - PMC - PubMed
    1. Humphreys B. D., Ann. Rev. Physiol. 2018, 80, 309. - PubMed
    1. Liu Y., Nat. Rev. Nephrol. 2011, 7, 684. - PMC - PubMed
    1. Gewin L. S., Matrix Biol. 2018, 68, 248. - PMC - PubMed

Substances

LinkOut - more resources