. 2024 Aug 27;43(8):114554.
doi: 10.1016/j.celrep.2024.114554. Epub 2024 Jul 30.

SMYD5 is a regulator of the mild hypothermia response

Affiliations

SMYD5 is a regulator of the mild hypothermia response

Salvor Rafnsdottir et al. Cell Rep. .

Abstract

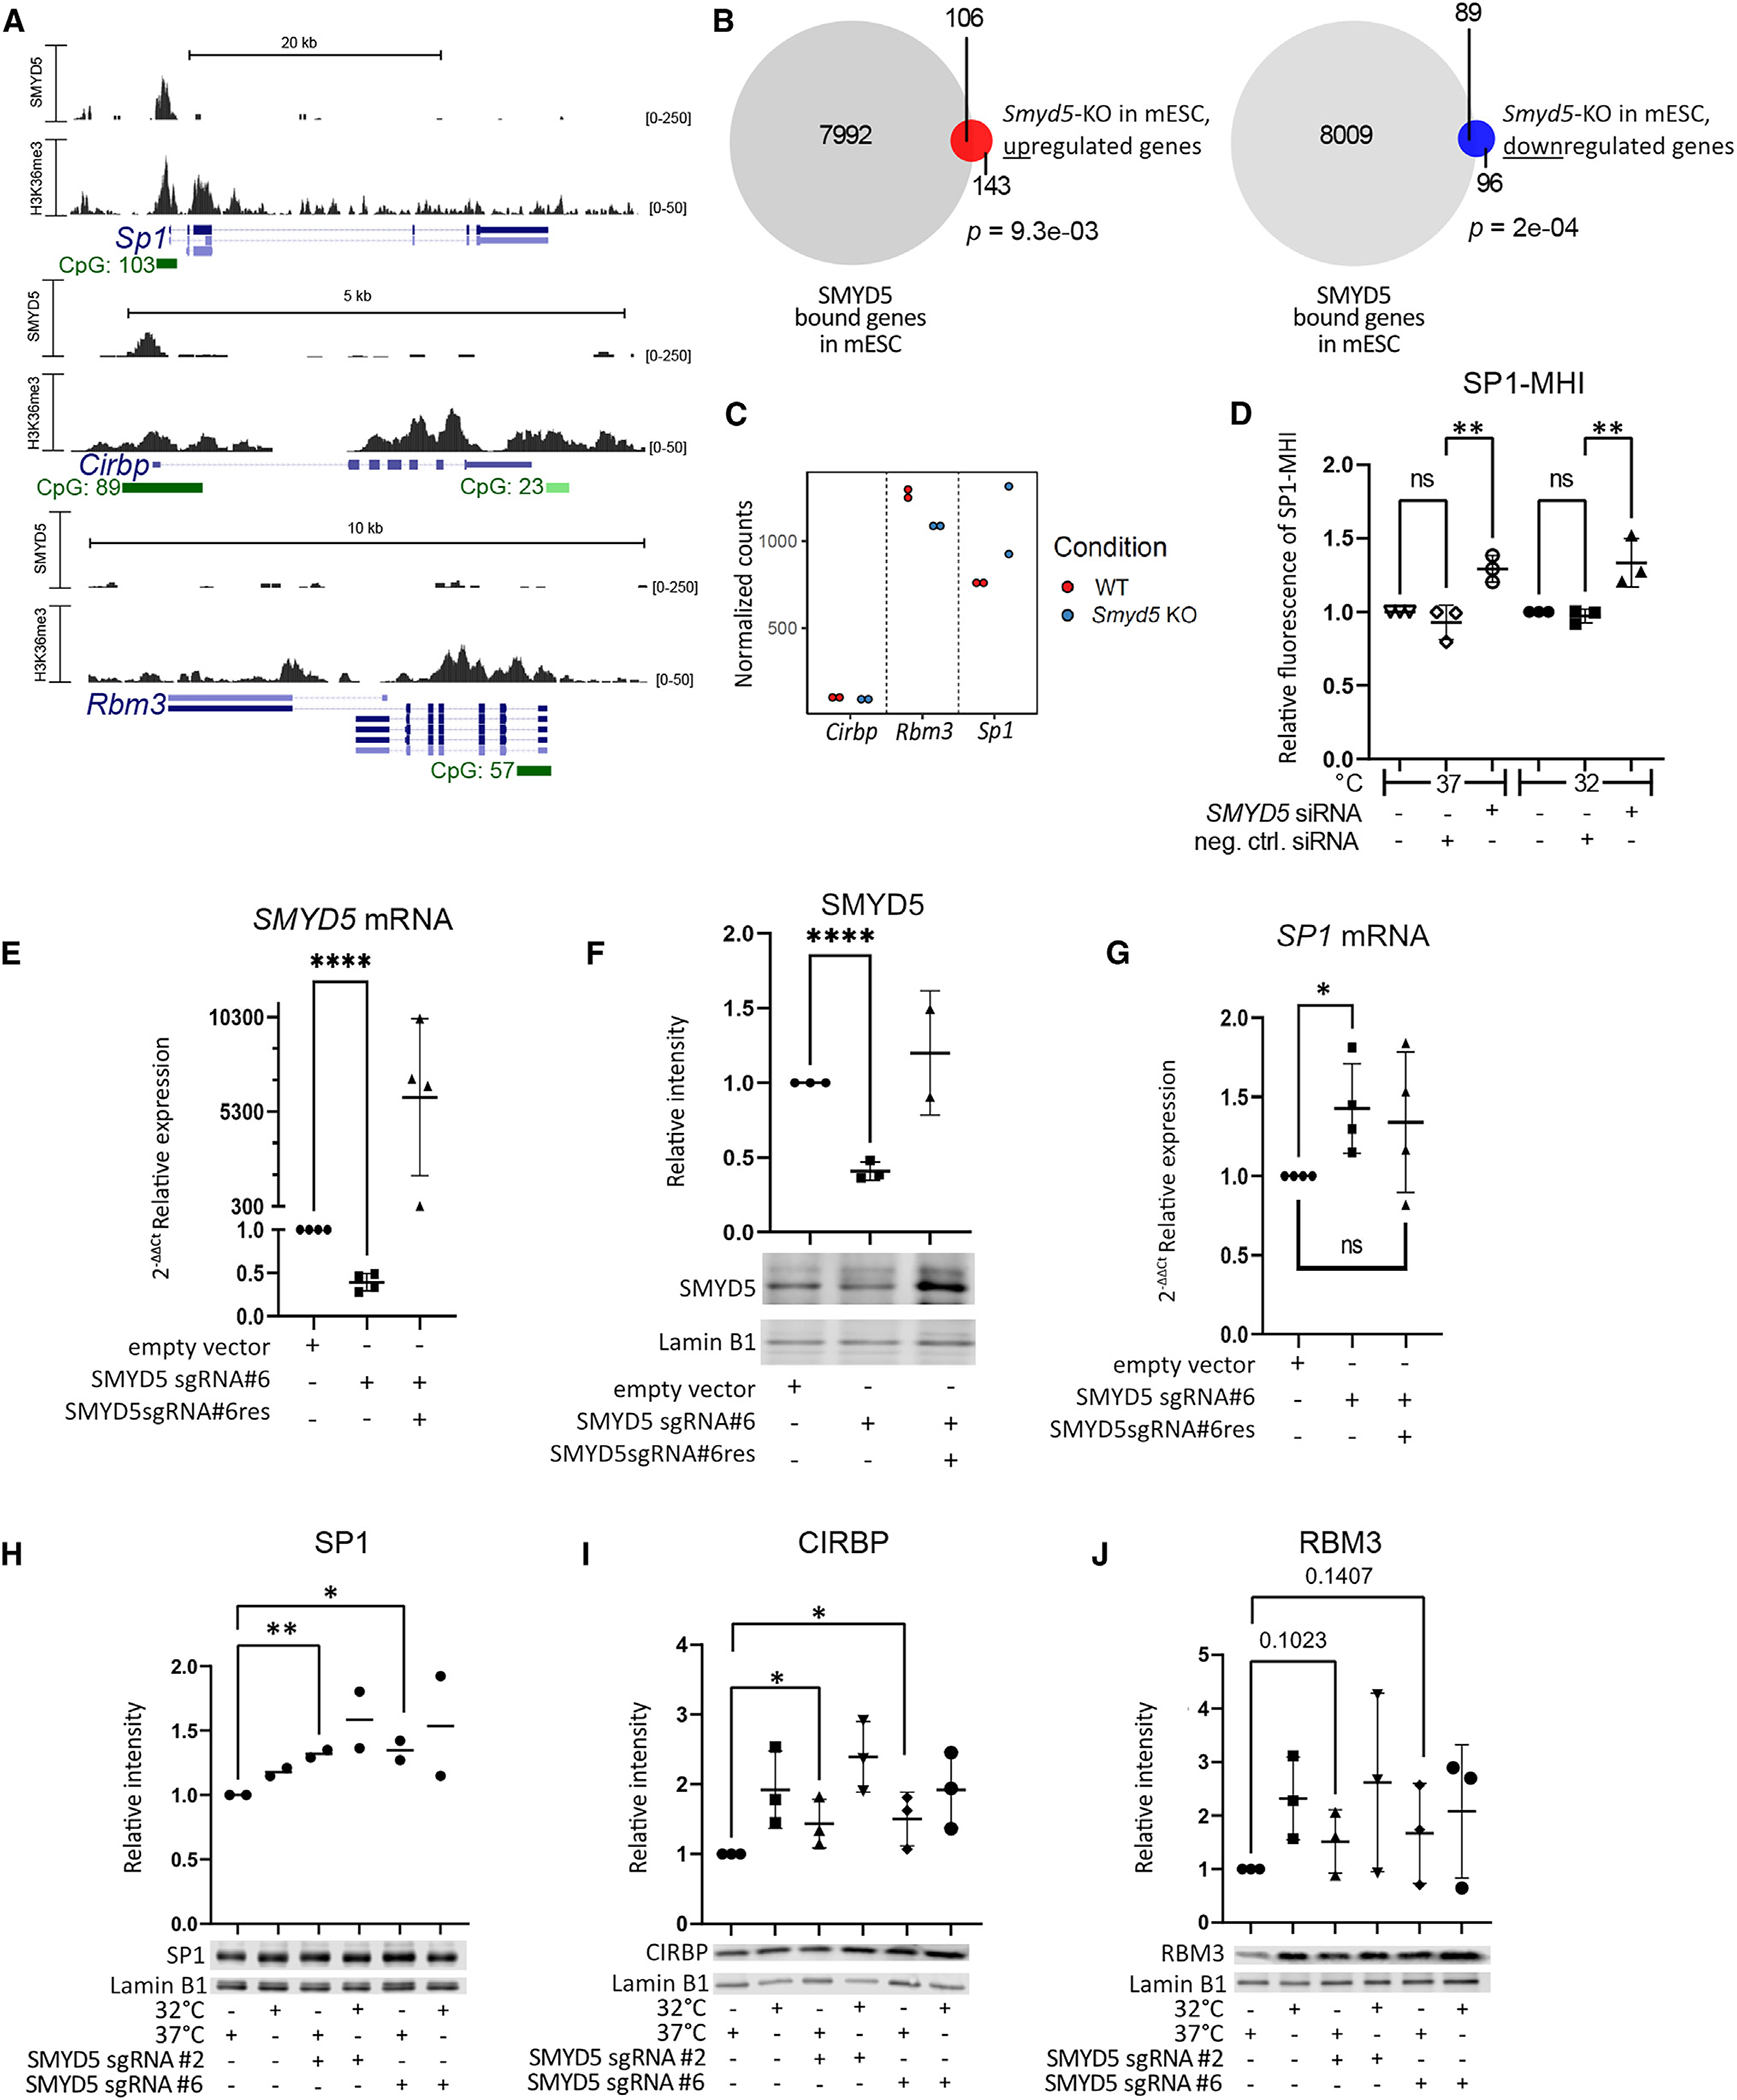
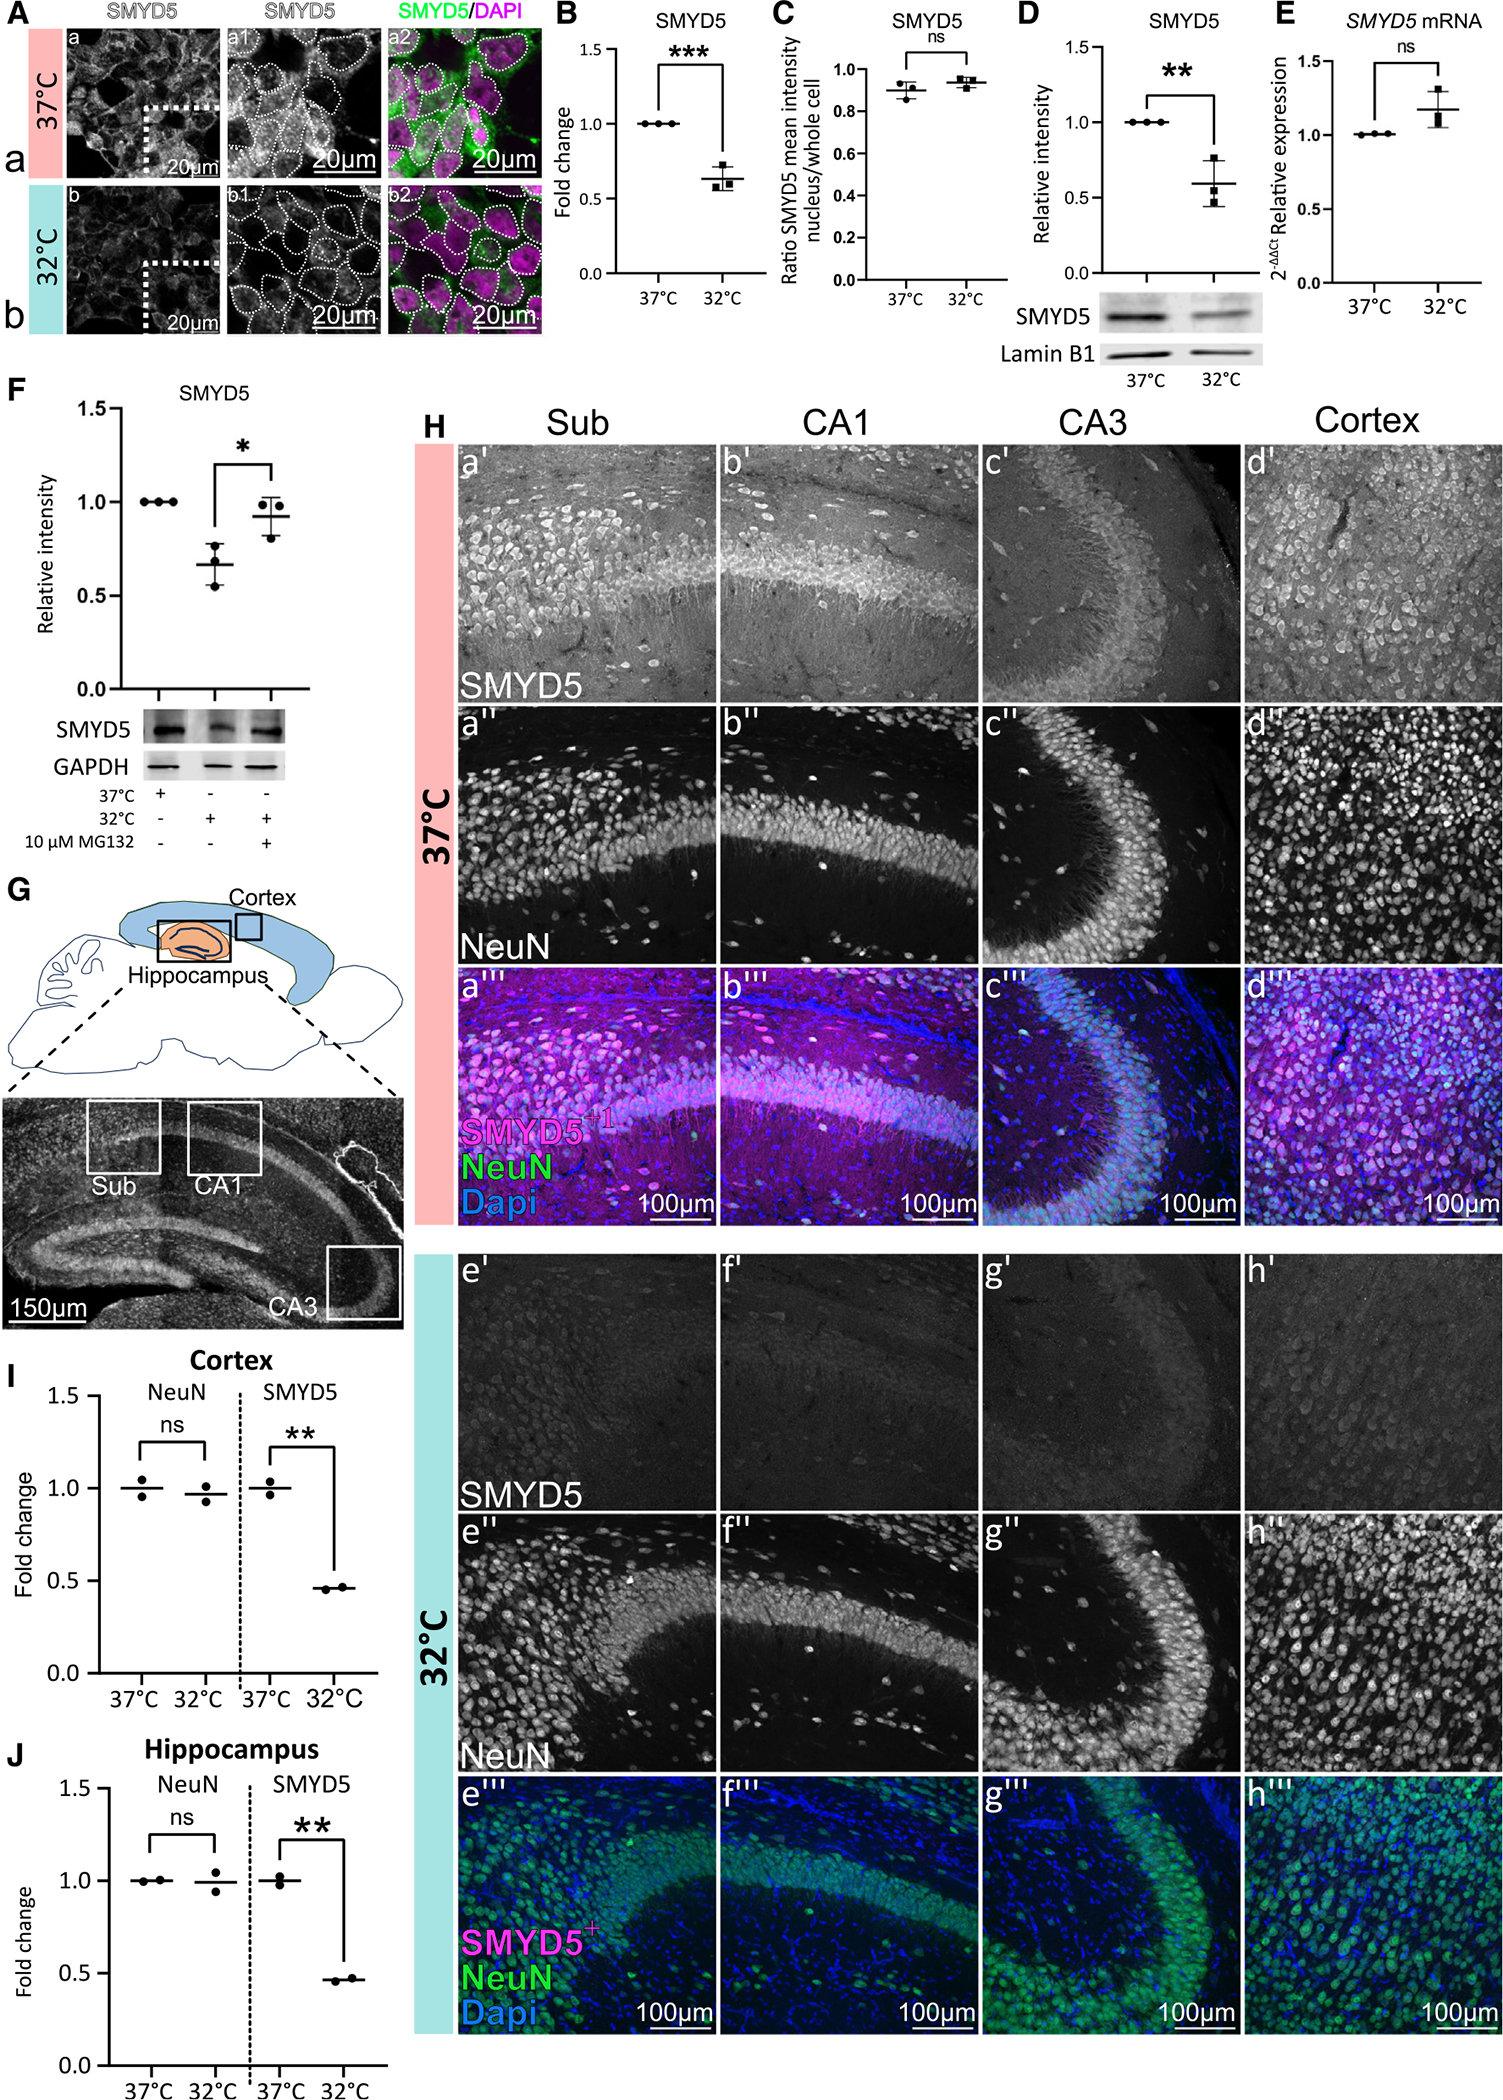
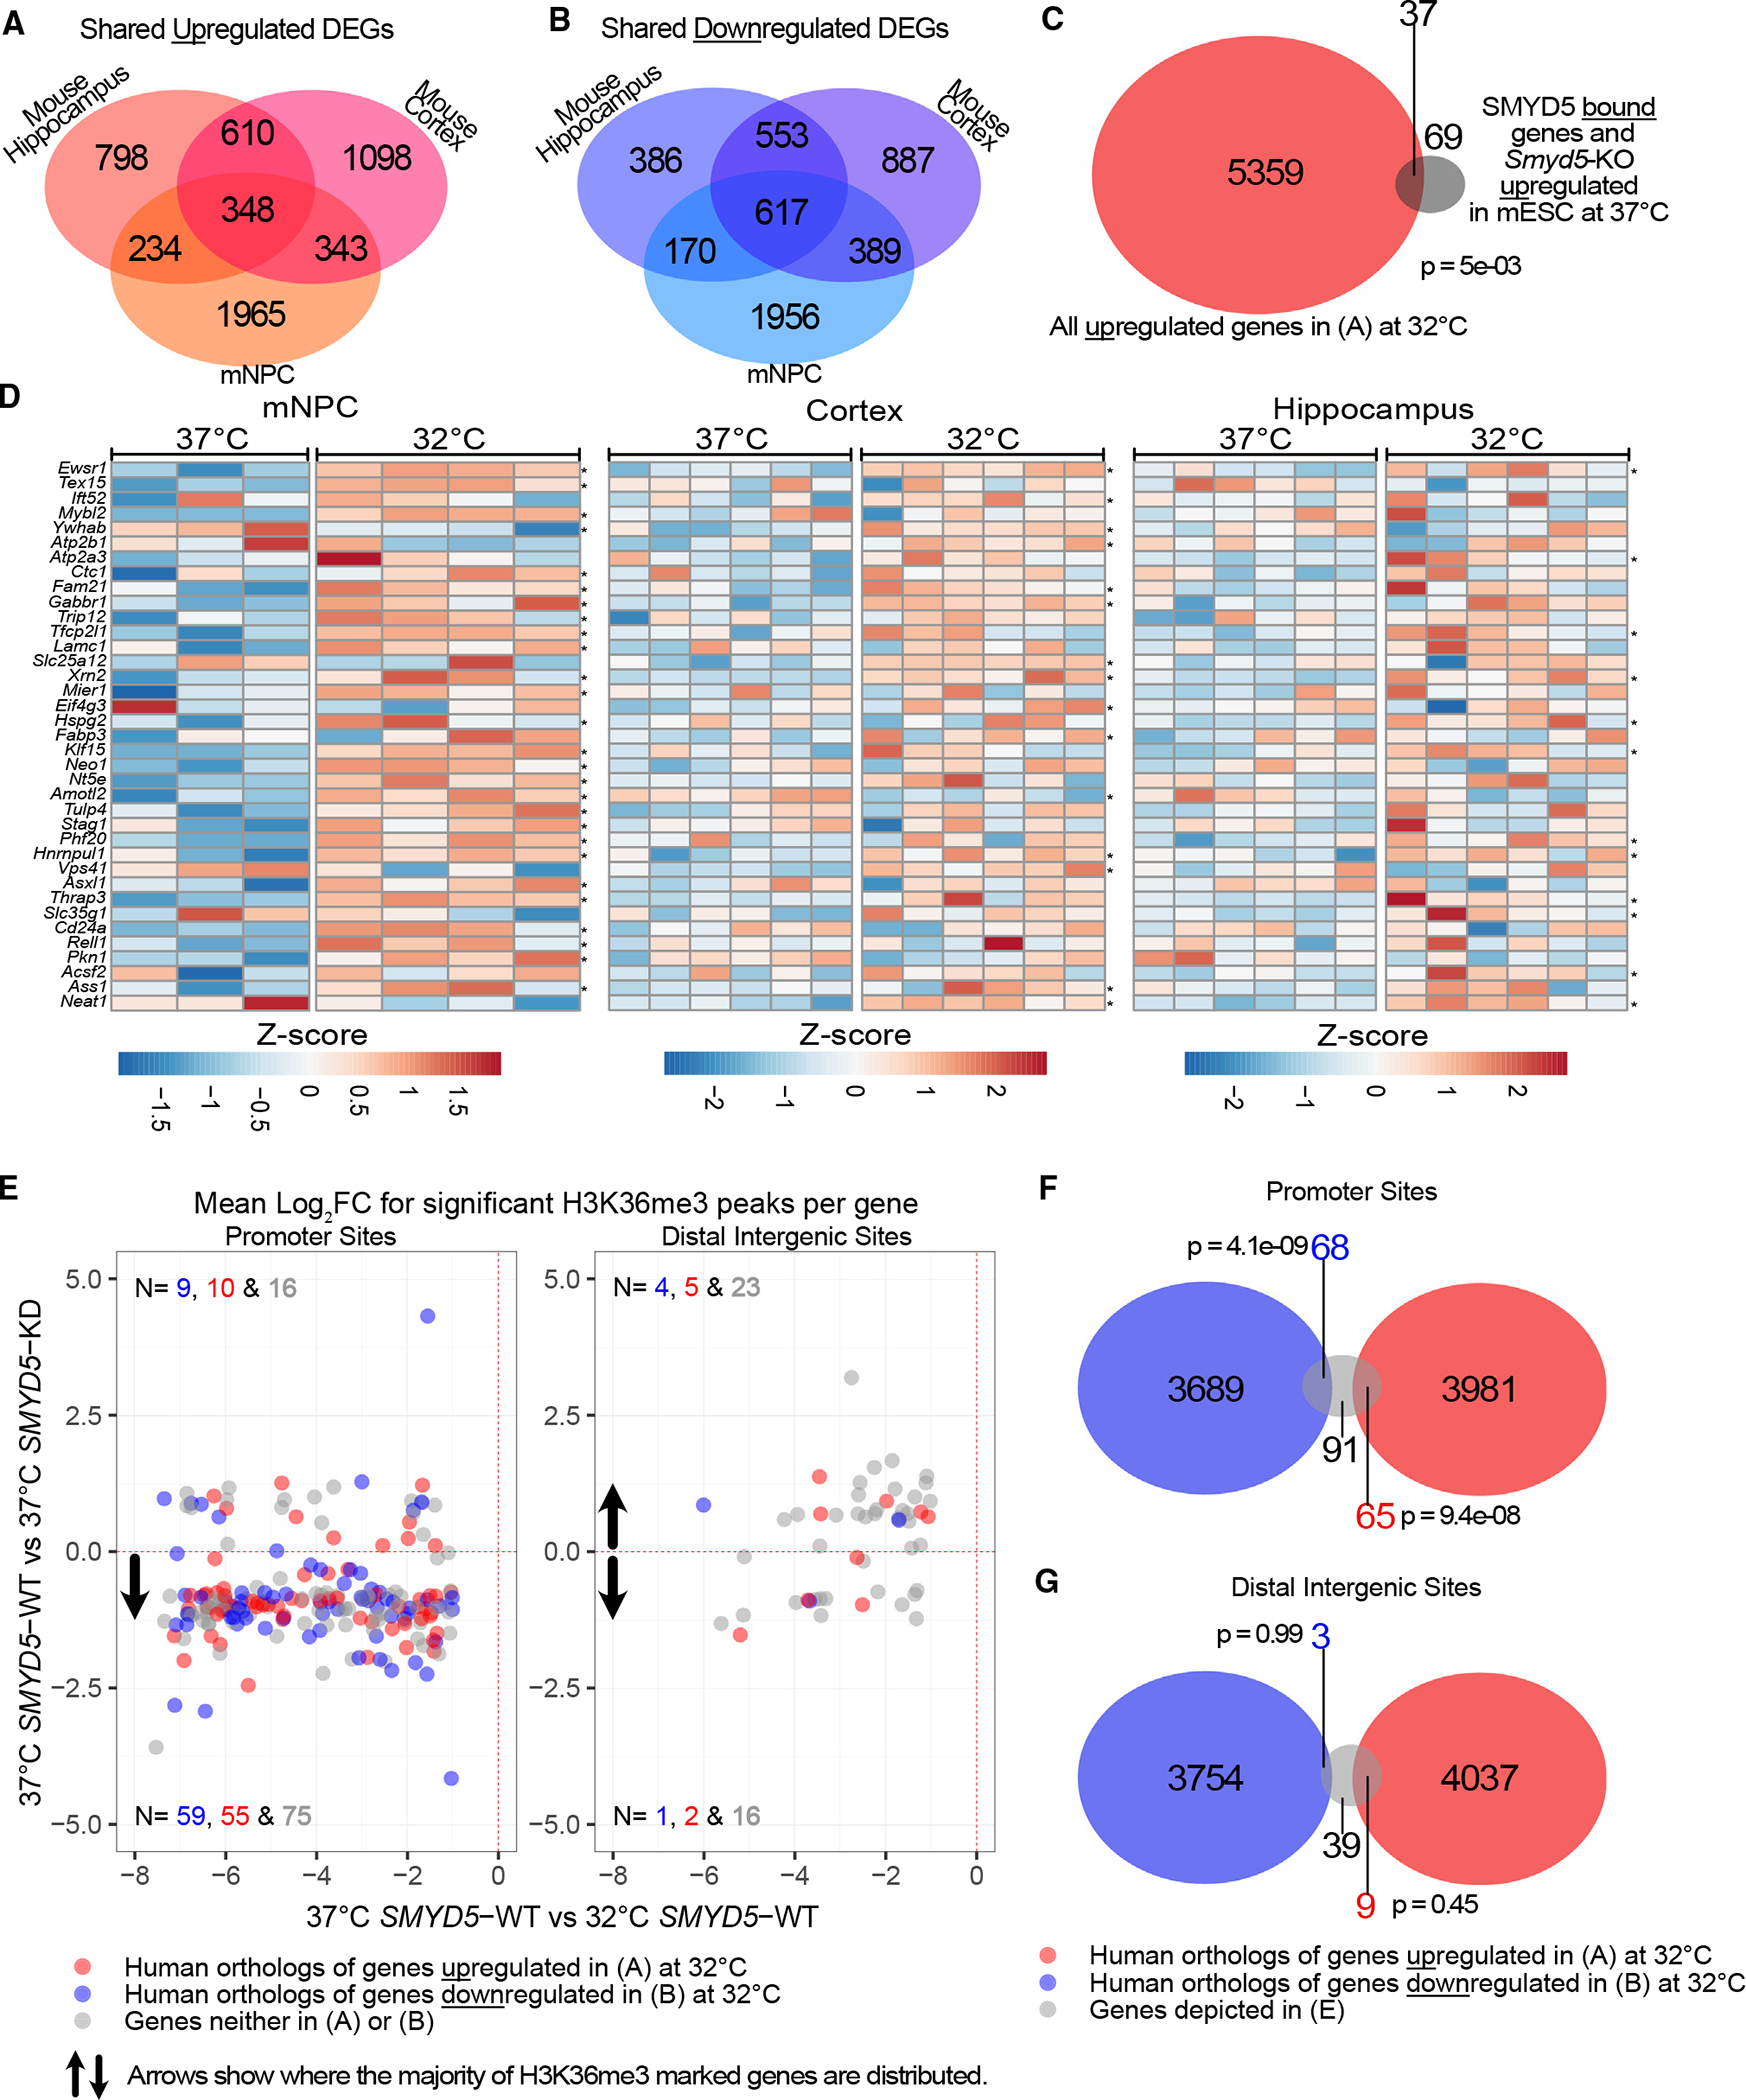
The mild hypothermia response (MHR) maintains organismal homeostasis during cold exposure and is thought to be critical for the neuroprotection documented with therapeutic hypothermia. To date, little is known about the transcriptional regulation of the MHR. We utilize a forward CRISPR-Cas9 mutagenesis screen to identify the histone lysine methyltransferase SMYD5 as a regulator of the MHR. SMYD5 represses the key MHR gene SP1 at euthermia. This repression correlates with temperature-dependent levels of histone H3 lysine 26 trimethylation (H3K36me3) at the SP1 locus and globally, indicating that the mammalian MHR is regulated at the level of histone modifications. We have identified 37 additional SMYD5-regulated temperature-dependent genes, suggesting a broader MHR-related role for SMYD5. Our study provides an example of how histone modifications integrate environmental cues into the genetic circuitry of mammalian cells and provides insights that may yield therapeutic avenues for neuroprotection after catastrophic events.

Keywords: CP: Metabolism; H3K36me3; SP1; cold stress; epigenetics; genetic environmental interaction; histone machinery; histone methylation; hypoxic brain injury; proteasome; repressor.


Conflict of interest statement

Declaration of interests H.T.B. is a consultant for Mahzi Therapeutics and founder of Kaldur Therapeutics. S.R. and H.T.B. have a European patent application (23167505.9) on a therapeutic strategy to activate the MHR.

Figures

Figure 1.
Figure 1.. MHIs allow single-cell fluorescent quantification of MHR activation
(A) A schematic of MHI structures. (B and C) Representative fluorescence images of SP1-Lenti-MHIs and CIRBP-Lenti-MHI, respectively, at 37°C and 32°C. (D) A western blot demonstrating increased SP1 after 16 h at 32°C compared to 37°C. Each data point is a biological replicate (n = 2), and their mean is depicted. Significance levels were calculated with an unpaired two-tailed t test. (E) Geometric mean fluorescence intensity (gMFI; flow cytometry) after varying lengths of hypothermia exposure for SP1-MHI. Each data point is a technical replicate (n = 2), with mean and standard deviation (SD) where applicable. Significance levels were calculated with an unpaired one-tailed t test. (F and G) MFI (flow cytometry) of SP1-MHI and CIRBP-MHI, respectively (16 h at 32°C, 37°C, 40°C). Each point is a technical replicate (n = 3), with mean and SD where applicable. Significance levels were calculated with Šidák’s multiple-comparisons test. (H) gMFI of RBM3-MHI (16 h at 32°C and 37°C). Each point is a technical replicate (n = 4–5), with mean and SD where applicable. Significance levels were calculated with an unpaired one-tailed t test. All significance levels were calculated in GraphPad Prism. *p < 0.05, **p < 0.01, ***p < 0.001, ****p < 0.0001.
Figure 2.
Figure 2.. Genome-scale CRISPR-Cas9 KO screen on SP1-MHI reveals multiple potential inhibitors and activators of the MHR
(A) Overview of the genome-scale CRISPR-Cas9 KO approach for the HEK293WT+Cas9+SP1 cell line. (B) Fluorescence measurements and sort gates of the 4 replicates of transduced HEK293WT+Cas9+SP1 cells (green), negative control (HEK293WT, black) and positive control (HEK293WT+Cas9+SP1, gray). (C and D) Genes marked in red are transcription regulators that have a −log10(RRA) score >3.5 and a known repressive function. Genes marked in green are transcription regulators that have a known activating function and a −log10(RRA) score >3.5. Colored dots represent genes that have a −log10(RRA) score >3.5. Orange dots indicate genes that have a positive log fold change (LFC), and blue dots indicate genes that have a negative LFC, from either the SP1 activator (C) or repressor (D) screen. −Log10(RRA) score and LFC were calculated with MAGeCK.
Figure 3.
Figure 3.. SMYD5 is a direct repressor of SP1 at 37°C
(A) Overexpressed FLAG-tagged SMYD5 (n = 2) in mESCs binds at promoters of Sp1 and Cirbp but not of Rbm3. H3K36me3 peaks over Sp1, Cirbp, and Rbm3 promoter and gene body regions. Data (GEO: GSE184894) are from Zhang et al. (B) Venn graph showing both up- and downregulated SMYD5-bound genes in an RNA-seq of Smyd5 KO cells (n = 2). Statistical analysis was done with the GeneOverlap package in R using Fisher’s exact test. (C) Smyd5 KO leads to increased mRNA expression of SP1 but not RBM3 or CIRBP in mESCs. (D) SMYD5 knock down (KD) by siRNA yields higher levels of fluorescence of SP1-MHI at 32°C and 37°C compared to the empty vector control. Each data point is a biological replicate (n = 3) that has been normalized against the same non-transfected HEK293WT+Cas9+SP1-MHI cell line; mean and SD are depicted where applicable. Significance levels were calculated with Šidák’s multiple-comparisons test in GraphPad Prism. (E) Relative expression of SMYD5 mRNA compared to GAPDH from SMYD5 KO cells, measured by RT-qPCR at 37°C, with or without rescue with the FLAG-SMYD5 sgRNAres plasmid (labeled SMYD5 sgRNA#6res). Each data point is a biological replicate (n = 4), with mean and SD where applicable. Significance levels were calculated with an unpaired one-tailed t test in GraphPad Prism. (F) Western blot using antibodies against SMYD5 and Lamin B in an SMYD5 KO HEK293 cell line at 37°C with and without rescue with the FLAG-SMYD5 sgRNAres plasmid (labeled SMYD5 sgRNA#6res). SMYD5 KO was successful at the protein level at 37°C (n = 2–3). Data are shown as in (E). (G) Relative expression of SP1 mRNA compared to GAPDH from SMYD5 KO cells, measured by RT-qPCR at 37°C, with or without rescue with the FLAG-SMYD5 sgRNAres plasmid (labeled SMYD5 sgRNA#6res) (n = 4). Data are shown as in (E). (H–J) Western blot quantification with and without 16-h incubation at 32°C and representative examples using antibodies against SP1, CIRBP, and RBM3, respectively, in SMYD5 KO cells. Each data point is a biological replicate (n = 2–3), with mean and SD where applicable. Significance levels were calculated with an unpaired one-tailed t test in GraphPad Prism. *p < 0.05, **p < 0.01, ***p < 0.001, ****p < 0.0001.
Figure 4.
Figure 4.. SMYD5 is depleted at 32°C in vitro by the proteasome and in vivo
(A) Representative image of the intensity of endogenous SMYD5 at 37°C (top, a) and 6 h incubation at 32°C (bottom, b). Nuclei are marked with a dotted line. Other images can be found in Figure S6. (B) Quantification of cellular endogenous SMYD5 mean intensity levels from immunocytochemistry; mean fold change between conditions is depicted. Each data point is a biological replicate (n = 3), mean and SD are shown where applicable. Significance levels were calculated with an unpaired one-tailed t test. (C) The ratio of nuclear to whole-cell SMYD5 mean intensity (n = 3). Data are shown as in (B). (D) Western blot using a SMYD5 antibody at 37°C and 6-h incubation at 32°C (n = 3). Significance levels were calculated with an unpaired two-tailed t test; otherwise, data are shown as in (B). (E) RT-qPCR results for SMYD5 expression at 37°C and 32°C after 6-h incubation (n = 3). Significance levels were calculated with an unpaired one-tailed t test. (F) SMYD5 levels at 37°C and at 32°C with and without the exposure to the proteasomal inhibitor MG132 (n = 3). Data are shown as in (B). (G) A schematic overview of sagittal sections of a P10 mouse brain. Boxes indicate areas that were used in (H)–(J). (H) Representative SMYD5, DAPI, and NeuN staining in brain sections of mice kept at euthermia (37°C; a–d) after neonatal hypoxic-ischemic injury compared to those treated with cooling at 32°C for 6 h (e–h). Sagittal brain sections are from the Sub (a and e), CA1 (b and f), CA3 (c and g), and somatosensory cortex (d and h). +Background for SMYD5 in merged images has been adjusted to emphasize the specific staining of SMYD5. (I and J) Quantification of NeuN and SMYD5 staining from (H) (n = 2), where the hippocampus included the Sub, CA1 and CA3 regions. Each data point is a biological replicate that is an average of two technical replicates; the mean of the replicates is shown. Mean fold change between conditions is depicted. Significance level was calculated with an unpaired one-tailed t test. All significance levels were calculated in GraphPad Prism. *p < 0.05, **p < 0.01, ***p < 0.001, ****p < 0.0001.
Figure 5.
Figure 5.. SMYD5 is a regulator of the MHR
A) Overlap of upregulated DEGs from in vitro RNA-seq datasets from mNPCs (n = 3 at 37°C, n = 4 at 32°C), and in vivo hippocampal (n = 6 at 37°C, n = 6 at 32°C), and cortical cells (n = 6 at 37°C, n = 6 at 32°C). (B) Overlap of downregulated DEGs from in vitro RNA-seq datasets from mNPCs (n = 3 at 37°C, n = 4 at 32°C), and in vivo hippocampal (n = 6 at 37°C, n =6 at 32°C), and cortical cells (n = 6 at 37°C, n = 6 at 32°C). (C) Overlap of upregulated DEGs from in vitro and in vivo RNA-seq datasets (mNPCs and hippocampal and cortical cells) at 32°C with SMYD5-bound and repressed genes in mESCs. Statistical analysis was done with the GeneOverlap package in R using Fisher’s exact test. (D) Heatmap for the 37 genes from (C), depicting all normalized counts >10 converted to Z scores. The transformation was done with variance stabilization in DESeq2. *DEG in each dataset that have p adjusted < 0.1, calculated with DESeq2. (E) Mean log2FC of H3K36me3 peaks per gene over promoter sites and distal intergenic sites. Each data point depicted is a gene that had p < 0.05 for both datasets and log2FC < −1 for H3K36me3 modification when comparing 37°C–32°C in SMYD5 WT cells (SMYD5 WT; n = 6, SMYD5 KD; n = 3). Red dots represent genes that are upregulated at 32°C in one of three RNA-seq datasets presented in (A). Blue dots represent genes that are downregulated at 32°C in one of three RNA-seq datasets presented in (B). Gray dots represent genes that are not upregulated at 32°C in any of the three RNA-seq datasets presented in (A). (F and G) Overlap of genes from (E) and human orthologs of up- or downregulated genes at 32°C from at least one of the three RNA-seq datasets from (A) or (B) at promoter sites and distal intergenic sites, respectively. Data are shown as in (C).

Update of

Similar articles

Cited by

  • Androgens mediate sexual dimorphism in Pilarowski-Bjornsson Syndrome.
    Anderson KJ, Thorolfsdottir ET, Nodelman IM, Halldorsdottir ST, Benonisdottir S, Alghamdi M, Almontashiri N, Barry BJ, Begemann M, Britton JF, Burke S, Cogne B, Cohen ASA, de Diego Boguñá C, Eichler EE, Engle EC, Fahrner JA, Faivre L, Fradin M, Fuhrmann N, Gao CW, Garg G, Grečmalová D, Grippa M, Harris JR, Hoekzema K, Hershkovitz T, Hubbard S, Janssens K, Jurgens JA, Kmoch S, Knopp C, Koptagel MA, Ladha FA, Lapunzina P, Lindau T, Meuwissen M, Minicucci A, Neuhaus E, Nizon M, Nosková L, Park K, Patel C, Pfundt R, Prasun P, Rahner N, Robin NH, Ronspies C, Roohi J, Rosenfeld J, Saenz M, Saunders C, Stark Z, Thiffault I, Thull S, Velasco D, Velmans C, Verseput J, Vitobello A, Wang T, Weiss K, Wentzensen IM, Pilarowski G, Eysteinsson T, Gillentine M, Stefánsson K, Helgason A, Bowman GD, Bjornsson HT. Anderson KJ, et al. medRxiv [Preprint]. 2025 May 7:2025.05.06.25326635. doi: 10.1101/2025.05.06.25326635. medRxiv. 2025. PMID: 40385454 Free PMC article. Preprint.

References

    1. Luedke MW, Graffagnino C, McKinney BG, Piper J, Iversen E, and Kolls B (2022). Association of time-temperature curves with outcomes in temperature management for cardiac arrest. BMJ Neurol. open 4, e000273. 10.1136/BMJNO-2022-000273. - DOI - PMC - PubMed
    1. Shankaran S, Laptook AR, Ehrenkranz RA, Tyson JE, McDonald SA, Donovan EF, Fanaroff AA, Poole WK, Wright LL, Higgins RD, et al. (2005). Whole-body hypothermia for neonates with hypoxic-ischemic encephalopathy. N. Engl. J. Med. 353, 1574–1584. 10.1056/NEJMCPS050929. - DOI - PubMed
    1. Azzopardi D, Brocklehurst P, Edwards D, Halliday H, Levene M, Thoresen M, and Whitelaw A; TOBY Study Group (2008). The TOBY Study. Whole body hypothermia for the treatment of perinatal asphyxial encephalopathy: a randomised controlled trial. BMC Pediatr. 8, 17. 10.1186/1471-2431-8-17. - DOI - PMC - PubMed
    1. Gluckman PD, Wyatt JS, Azzopardi D, Ballard R, Edwards AD, Ferriero DM, Polin RA, Robertson CM, Thoresen M, Whitelaw A, and Gunn AJ (2005). Selective head cooling with mild systemic hypothermia after neonatal encephalopathy: Multicentre randomised trial. Lancet 365, 663–670. 10.1016/S0140-6736(05)17946-X. - DOI - PubMed
    1. Dankiewicz J, Cronberg T, Lilja G, Jakobsen JC, Levin H, Ullén S, Rylander C, Wise MP, Oddo M, Cariou A, et al. (2021). Hypothermia versus Normothermia after Out-of-Hospital Cardiac Arrest. N. Engl. J. Med. 384, 2283–2294. 10.1056/NEJMOA2100591. - DOI - PubMed

Substances