. 2024 Aug 27;43(8):114565.
doi: 10.1016/j.celrep.2024.114565. Epub 2024 Jul 30.

MicroRNA-19b exacerbates systemic sclerosis through promoting Th9 cells

Affiliations

MicroRNA-19b exacerbates systemic sclerosis through promoting Th9 cells

Yun-Ji Lim et al. Cell Rep. .

Erratum in

Abstract

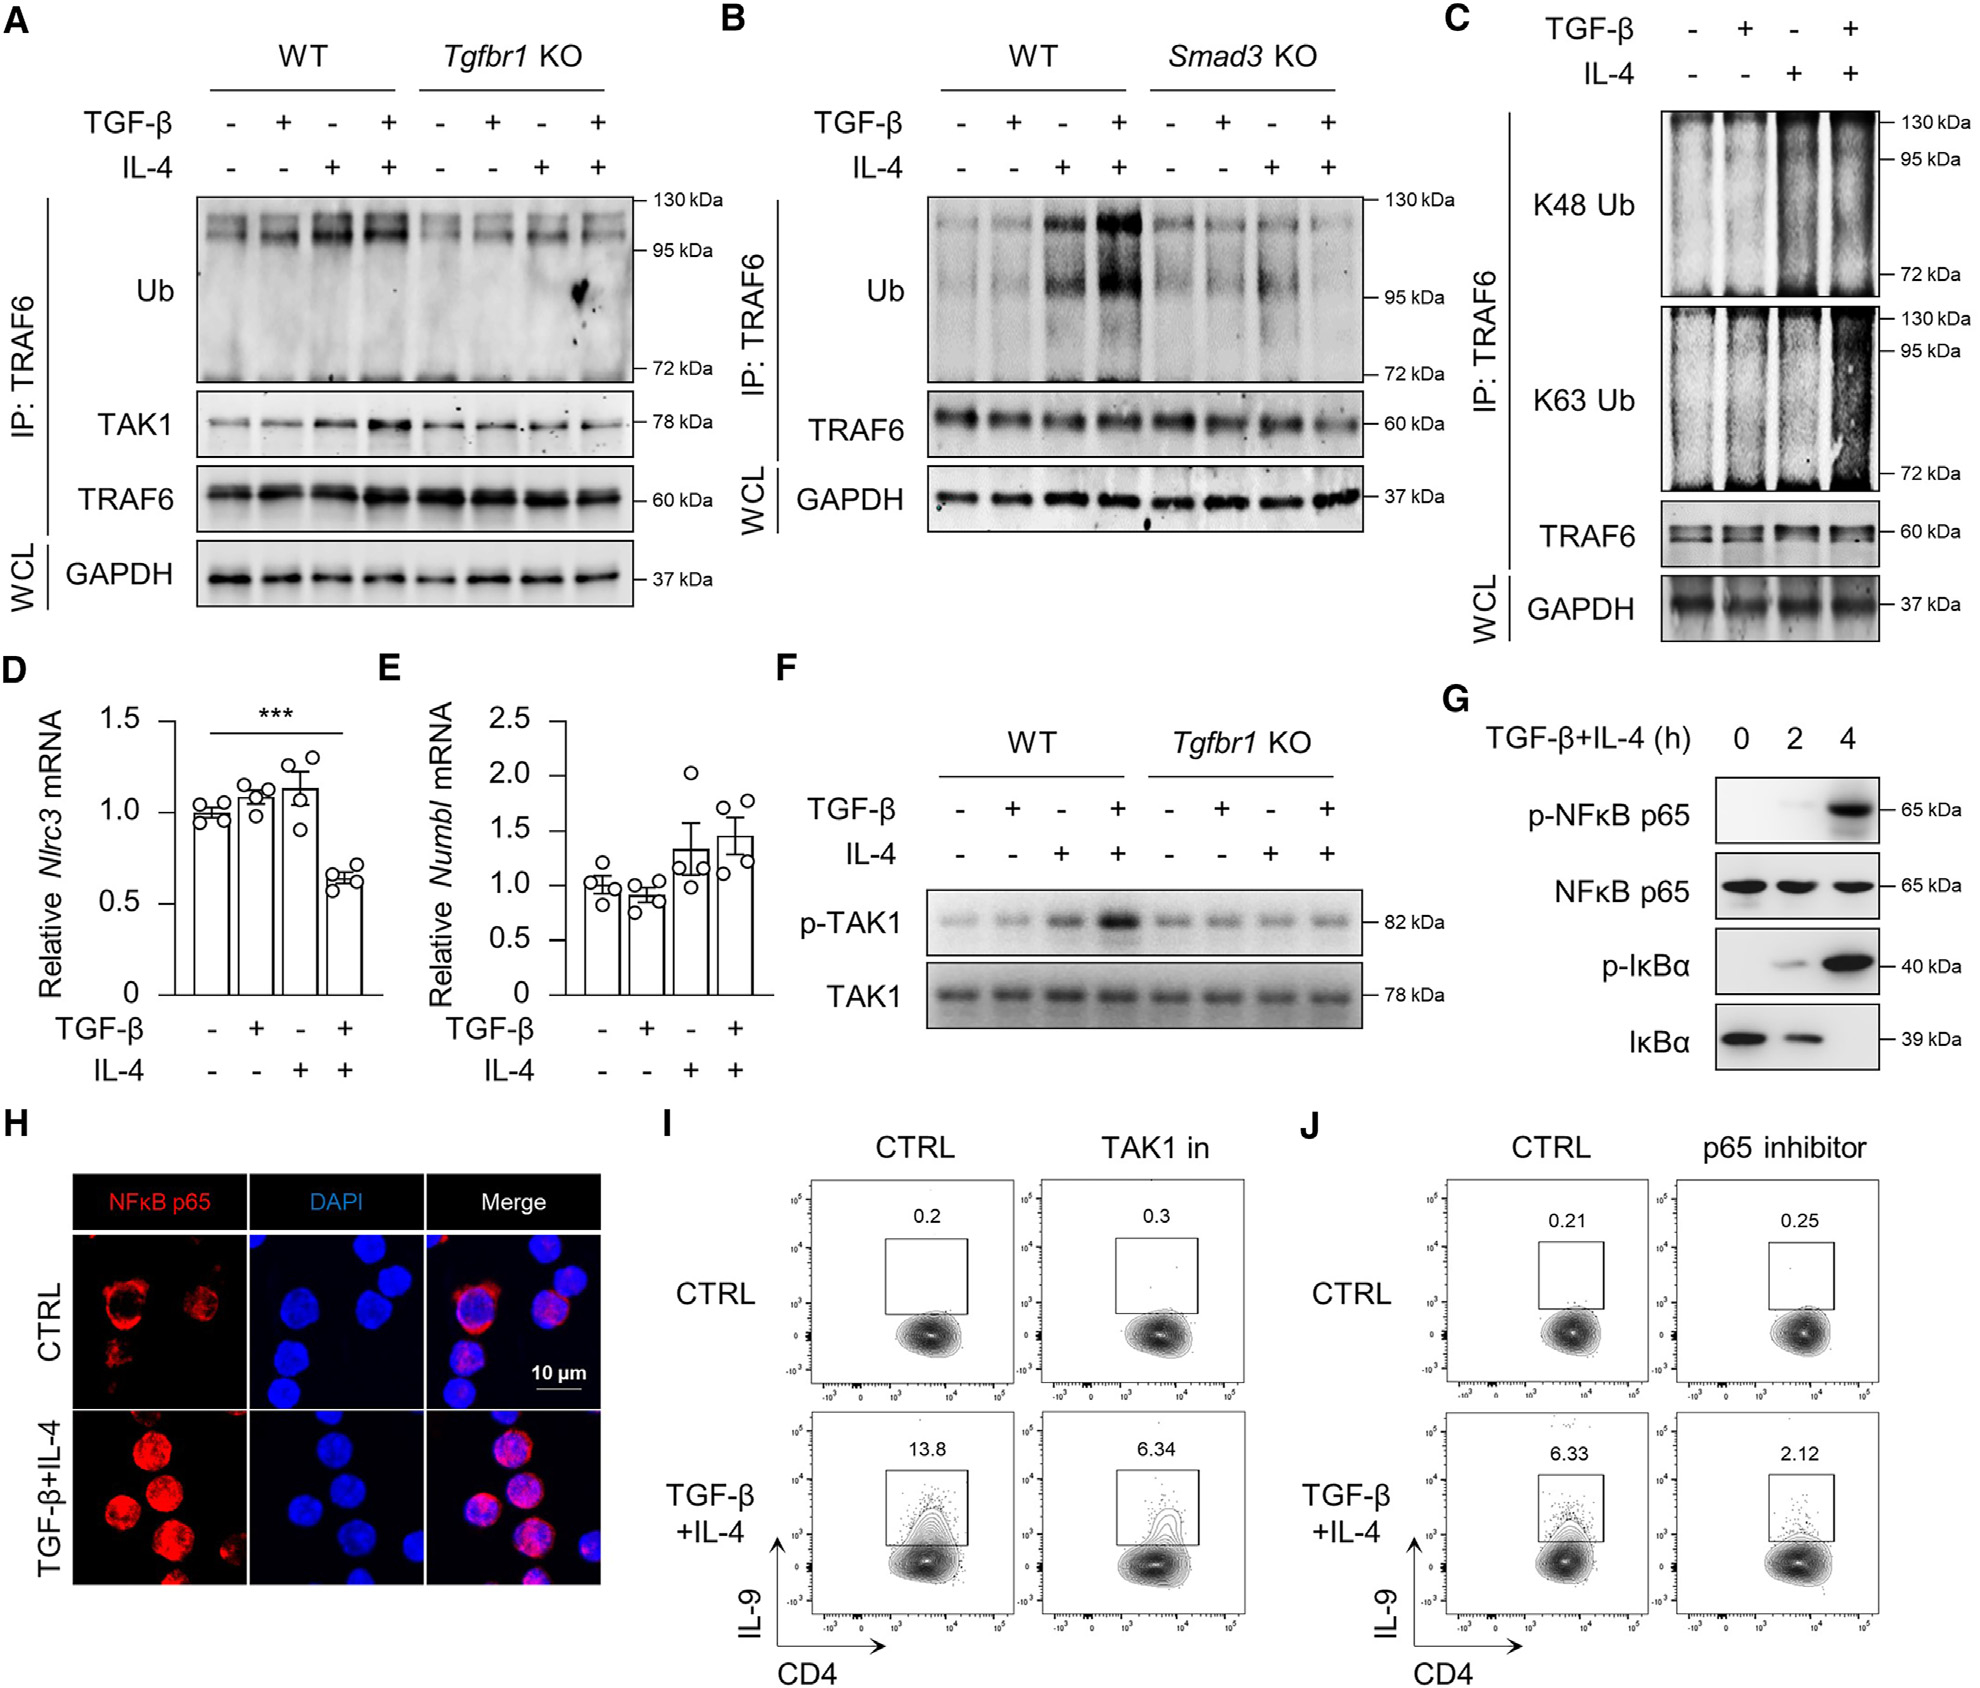
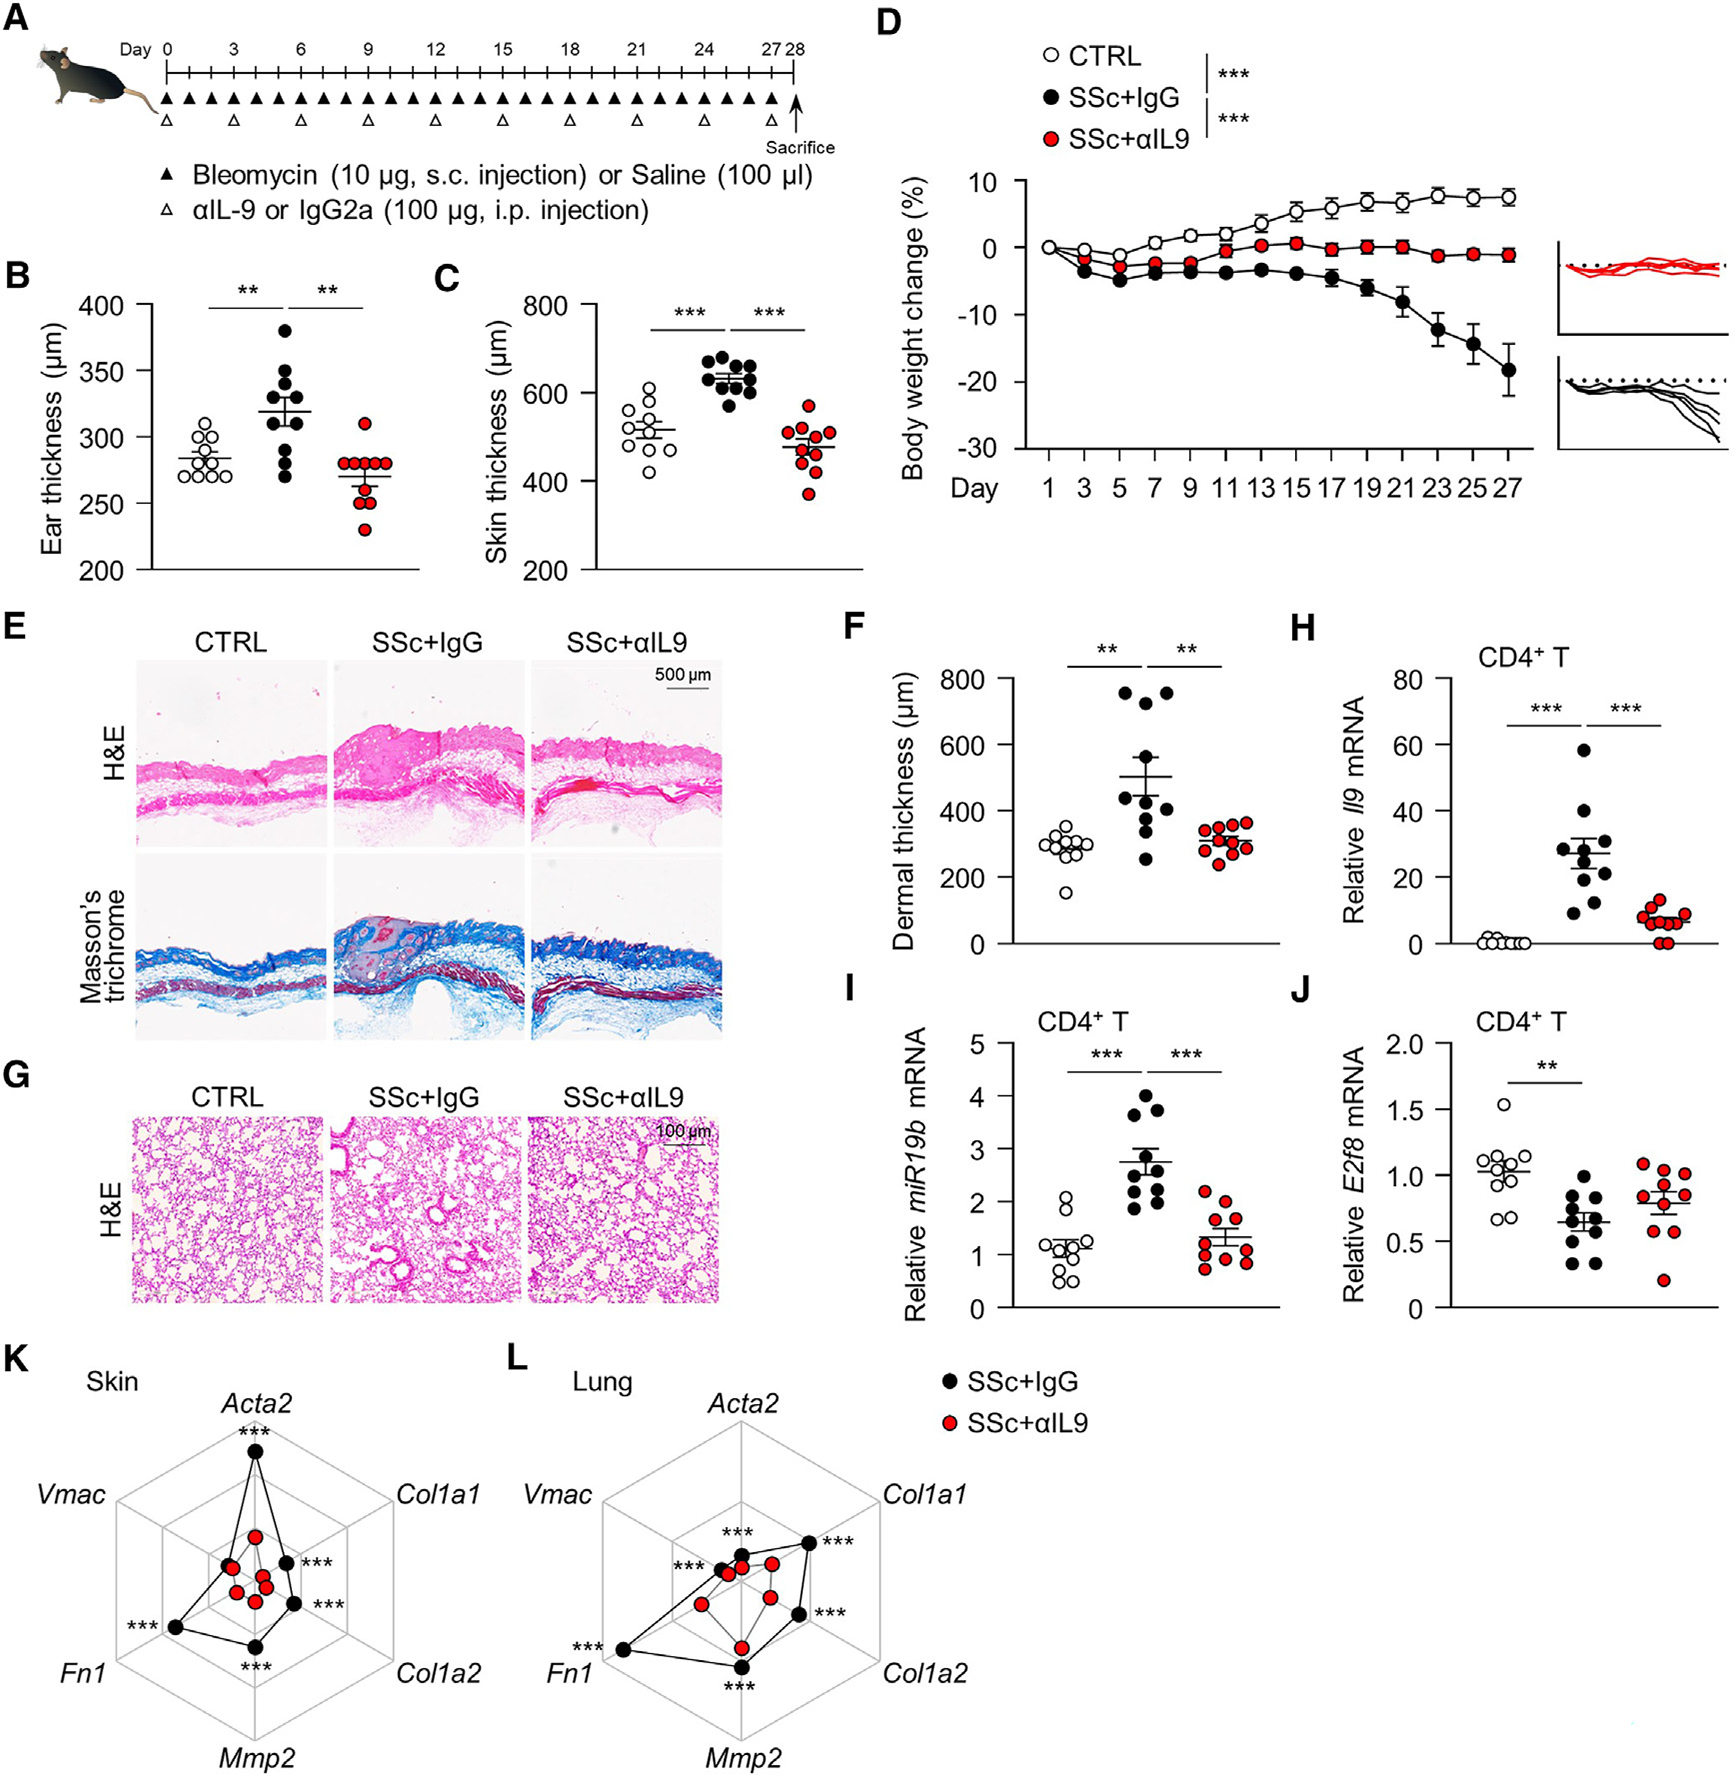
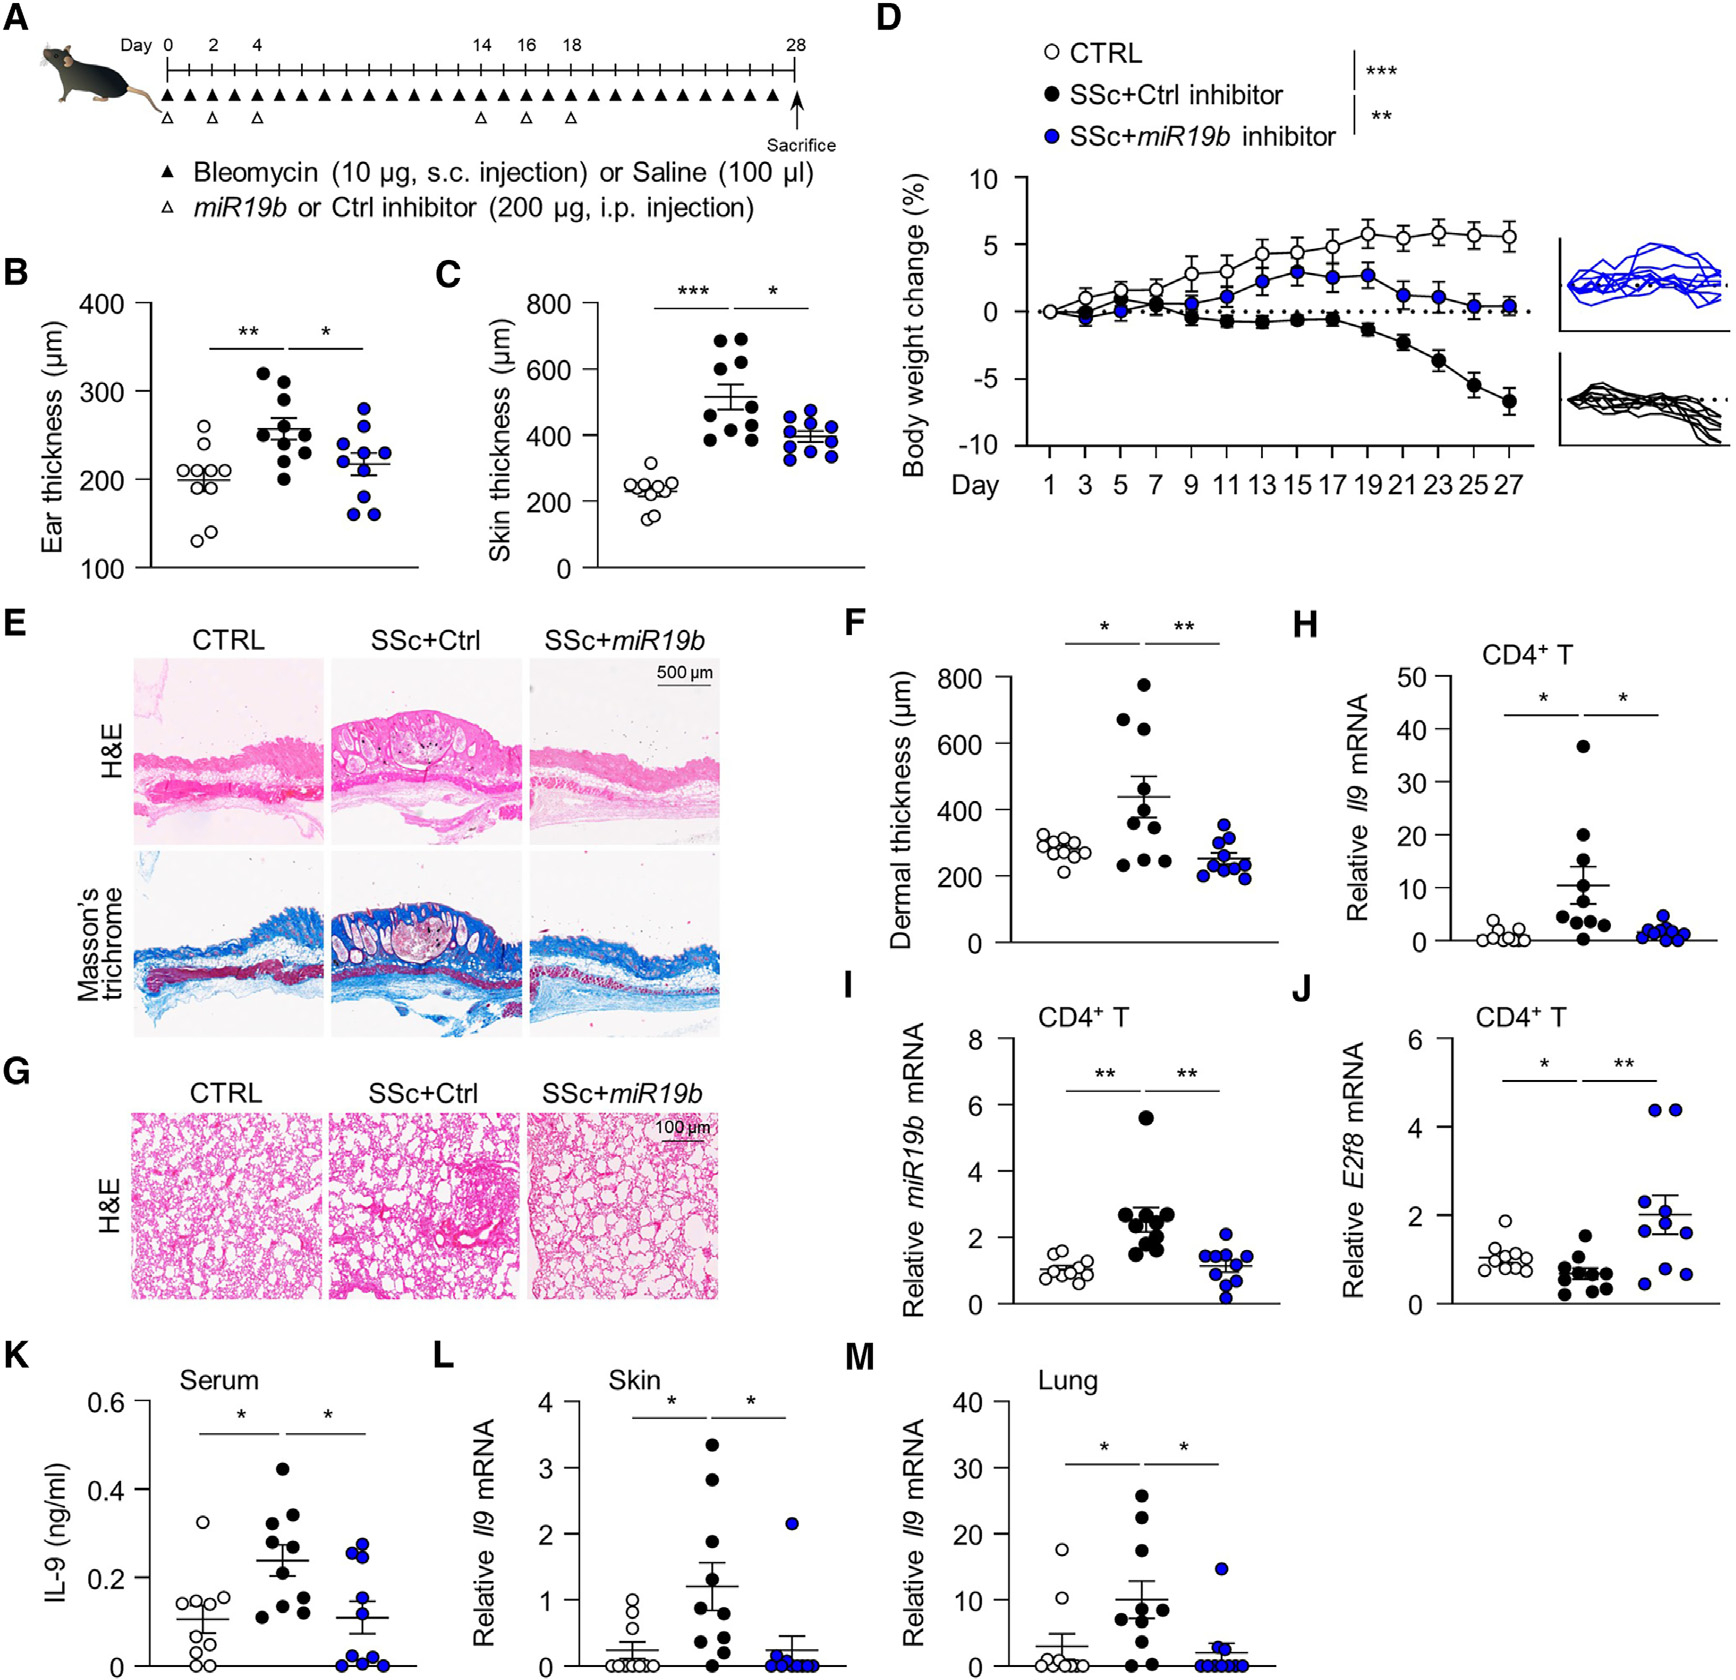
Systemic sclerosis (SSc) is a chronic autoimmune disease characterized by fibrosis of the skin and multiple vital organs, but the immunological pathogenesis of SSc remains unclear. We show here that miR-19b promotes Th9 cells that exacerbate SSc. Specifically, miR-19b and interleukin (IL)-9 increase in CD4+ T cells in experimental SSc in mice induced with bleomycin. Inhibiting miR-19b reduces Th9 cells and ameliorates the disease. Mechanistically, transforming growth factor beta (TGF-β) plus IL-4 activates pSmad3-Ser213 and TRAF6-K63 ubiquitination by suppressing NLRC3. Activated TRAF6 sequentially promotes TGF-β-activated kinase 1 (TAK1) and nuclear factor κB (NF-κB) p65 phosphorylation, leading to the upregulation of miR-19b. Notably, miR-19b activated Il9 gene expression by directly suppressing atypical E2F family member E2f8. In patients with SSc, higher levels of IL9 and MIR-19B correlate with worse disease progression. Our findings reveal miR-19b as a key factor in Th9 cell-mediated SSc pathogenesis and should have clinical implications for patients with SSc.

Keywords: CP: Immunology; E2f8; NF-κB p65; TAK1; TGF-β signaling; TRAF6; Th9; miR-19b; patients with systemic sclerosis.


Conflict of interest statement

Declaration of interests The authors declare no competing interests.

Figures

Figure 1.
Figure 1.. TRAF6 is increased by activation of Smad3-Ser213 during Th9 differentiation induced by IL-4 plus TGF-β
(A and B) Expression of Traf6 mRNA by real-time PCR (A) and TRAF6 protein by western immunoblotting (B) in CD4+ T cells from Tgfbr1f/f-ERCre− (WT) and Tgfbr1f/f-ERCre+ (Tgfbr1 KO) mice in response to TGF-β, IL-4, or TGF-β plus IL-4 for 2 h. (C and D) Expression of Traf6 mRNA by real-time PCR (C) and TRAF6 protein by western immunoblotting (D) in CD4+ T cells from Smad3 WT and Smad3 KO mice in response to TGF-β, IL-4, or TGF-β plus IL-4 for 2 h. (E–H) Real-time PCR (E and G) and immunoblotting of TRAF6 expression (F and H) in normal T cells and S213A mutant- or EPSM mutant-transfected WT CD4+ T cells (E and F) or Smad3 KO T cells (G and H) cultured with IL-4 and TGF-β for 2 h. For (A), (C), (E), and (G), data are from four independent experiments. For (B), (D), (F), and (H), data are pooled from three experiments. Data were analyzed by two-way ANOVA with Tukey’s test. Graphs show the mean ± SEM. See also Figure S1.
Figure 2.
Figure 2.. K63 ubiquitination of TRAF6 enhances TAK1 and NF-κB activation during Th9 differentiation
(A) Immunoprecipitation (IP) of TRAF6 in CD4+ T cells from WT and Tgfbr1 KO mice incubated with TGF-β, IL-4, or TGF-β plus IL-4 for 2 h, followed by immunoblot analysis with anti-ubiquitin (Ub), anti-TRAF6, and anti-TAK1. Whole-cell lysates (WCLs) were used for immunoblotting with anti-GAPDH. (B) IP of TRAF6 in CD4+ T cells from Smad3 WT and Smad3 KO mice incubated with TGF-β, IL-4, or TGF-β plus IL-4 for 2 h, followed by immunoblot analysis with anti-Ub and anti-TRAF6. (C) IP of TRAF6 in naive CD4+ T cells and analysis using immunoblotting with anti-Ub-K48- or anti-Ub-K63-specific antibody. (D and E) Expression of Nlrc3 and Numbl mRNA in CD4+ T cells cultured with TGF-β, IL-4, or TGF-β plus IL-4 for 1 h. (F) Immunoblotting of TAK1 in WT and Tgfbr1 KO T cells after 4 h stimulation. (G) Immunoblotting of NF-κB p65 and IκB in TGF-β-and-IL-4-treated T cells for the indicated time periods. (H) Immunofluorescence microscopy analysis of NF-κB p65 nuclear translocation in T cells cultured with TGF-β and IL-4 for 4 h. (I and J) Intracellular staining of IL-9 in CD4+ T cells in the presence of TAK1inhibitor (I) or p65 inhibitor (J) and cultured with TGF-β plus IL-4 for 72 h. For (A)–(C), (F), (G), and (H)–(J), data are pooled from three experiments. For (D) and (E), data are from four independent experiments. Data were analyzed by two-way ANOVA with Tukey’s test. Graphs show the mean ± SEM. See also Figure S2.
Figure 3.
Figure 3.. The TRAF6-TAK1-NF-κB axis is required for E2f8 downregulation to Th9 differentiation
(A–C) Expression of Il9 mRNA (A) and Dbp and E2f8 mRNA (B) after 24 h and immunoblotting of DBP and E2f8 protein (C) after 72 h in WT and Traf6 KO T cells. (D–F) Expression of Il9 mRNA (D) and Dbp and E2f8 mRNA (E) after 24 h and immunoblotting of DBP and E2f8 protein (F) after 72 h in TAK1-inhibited T cells. (G–I) Expression of Il9 mRNA (G) and Dbp and E2f8 mRNA (H) after 24 h and immunoblotting of DBP and E2f8 protein (I) after 72 h in p65-inhibited T cells. For (A), (B), (D), (E), (G), and (H), data are from four independent experiments. For (C), (F), and (I), data are pooled from three experiments. Data were analyzed by two-way ANOVA with Tukey’s test. Graphs show the mean ± SEM.
Figure 4.
Figure 4.. miR-19b leads to Th9 polarization via E2f8 suppression
(A) Expression of miR-19b in CD4+ T cells cultured with TGF-β plus IL-4 for 24 h. (B–D) Expression of miR-19b in WT and Tgfbr1 KO (B), Smad3 KO (C), and Traf6 KO (D) T cells in response to TGF-β plus IL-4 for 24 h. (E) Expression of miR-19b in T cells treated with TGF-β plus IL-4 in the presence or absence of TAK1 inhibitor or p65 inhibitor. (F–H) Expression of Il9 mRNA (F and G) and intracellular IL-9 production (H) in negative control-, miR-19b mimic-, or miR-19b inhibitor-transfected CD4+ T cells, followed by the stimulation of TGF-β and IL-4 for 72 h. (I and J) Expression of E2f8 mRNA and E2f8 protein in miR-19b-overexpressed cells in (F) or miR-19b inhibited T cells in (G). (K) Relative luciferase activity in HEK293 T cells overexpressing miR-19b and transfected with E2f8 3′ UTR WT or mutation vector (WT, E2f8 WT; mut, E2f8 point mutation in miR-19b binding site). For (A)–(G) and (K), data are from four independent experiments. For (I) and (J), qPCR data are from four independent experiments, and western blots are pooled from three experiments. For (H), data are pooled from three experiments. Data were analyzed by two-way ANOVA with Tukey’s test. Graphs show the mean ± SEM. See also Figure S3.
Figure 5.
Figure 5.. IL-9 blockade suppresses fibrogenic pathology in SSc mouse model in vivo
(A) Operational schematics of in vivo experiments. Mice were injected with bleomycin (BLM) subcutaneously (1 mg/kg/day) or saline (CTRL) for 28 days. For IL-9 neutralization, mice were treated intraperitoneally with anti-IL-9 antibody (100 μg) or mouse anti-IgG2a isotype control every 3 days. (B–D) Skin thickness (B and C) and body weight (D) of CTRL and BLM-induced SSc mice injected with isotype control or anti-IL-9 antibody. (E) H&E staining and Masson’s trichrome staining of the skin tissues from CTRL-, BLM-plus-IgG-, and BLM-plus-anti-IL-9-treated mice at 28 days. (F) The thickness of the dermal layer in (E). (G) H&E staining of the lung tissues in the same treatments as in (E). (H–J) Expression of Il9, miR-19b, and E2f8 in CD4+ T cells isolated from spleens and lymph nodes. (K and L) Spider plots of fibrogenic genes including Acta2, Col1a1, Col1a2, Mmp2, Fn1, and Vmac in skin (K) and lung (L). These data are representative of two independent experiments, n = 10 per group. Data were analyzed by two-tailed unpaired Student’s t test. Graphs show the mean ± SEM.
Figure 6.
Figure 6.. miR-19b blockade inhibits BLM-induced fibrosis by IL-9 suppression in vivo
(A) Operational schematics of in vivo experiments. Mice were injected with BLM or saline (CTRL) in the same treatments as in Figure 5A and then treated with MiRCURY LNA miR-19b inhibitor (200 μg) or control inhibitor on days 1, 3, 5, 15, 17, and 19 (6 times). (B–D) Skin thickness (B and C) and body weight (D) of CTRL and BLM-induced SSc mice injected with control (Ctrl) inhibitor or miR-19b inhibitor. (E) H&E staining and Masson’s trichrome staining of the skin tissues from CTRL-, BLM-plus-Ctrl-inhibitor-, and BLM-plus-miR-19b-inhibitor-treated mice at 28 days. (F) The thickness of the dermal layer in (E). (G) H&E staining of the lung tissues in the same treatments as in (E). (H–J) Expression of Il9, miR-19b, and E2f8 in CD4+ T cells isolated from spleens and lymph nodes. (K) IL-9 production by ELISA assay in blood serum. (L and M) Expression of Il9 in skin and lung. These data are representative of two independent experiments, n = 10 per group. Data were analyzed by two-tailed unpaired Student’s t test. Graphs show the mean ± SEM. See also Figures S4 and S5.
Figure 7.
Figure 7.. miR-19b expression in T cells of the patients with SSc
(A) Immunoblotting of TRAF6 and p-TAK-1 in human naive CD4+ T cells cultured with IL-4 and TGF-β for 4 h. (B and C) Expression of IL9 mRNA in negative control-, MIR-19B mimic- or MIR-19B inhibitor-transfected human CD4+ T cells, followed by the stimulation of TGF-β and IL-4 for 72 h. (D) Expression of IL-9 protein in blood serum from patients with SSc (n = 16) and healthy controls (n = 15). (E and F) Expression of IL9 and MIR-19B mRNA in CD4+ T cells isolated from blood of the patients (n = 26) and healthy individuals (n = 22). (G and H) Correlation of IL9 and MIR-19B mRNA with the mRSS of the patients (n = 14): IL9 (R2 = 0.8107, p < 0.0001) and MIR-19B (R2 = 0.8812, p < 0.0001). (I) Scatterplot of MIR-19B on the x axis and IL9 on they axis in CD4+ T cells from the patients (n = 13): (R2 = 0.6395, p < 0.001). Data were analyzed by two-tailed unpaired Student’s t test. Graphs show the mean ± SEM. See also Figure S6 and Table S1.

References

    1. Papadimitriou TI, van Caam A, van der Kraan PM, and Thurlings RM (2022). Therapeutic Options for Systemic Sclerosis: Current and Future Perspectives in Tackling Immune-Mediated Fibrosis. Biomedicines 10, 316. 10.3390/biomedicines10020316. - DOI - PMC - PubMed
    1. Fuschiotti P (2016). Current perspectives on the immunopathogenesis of systemic sclerosis. ImmunoTargets Ther. 5, 21–35. 10.2147/ITT.S82037. - DOI - PMC - PubMed
    1. Dardalhon V, Collins M, and Kuchroo VK (2015). Physical attraction of Th9 cells is skin deep. Ann. Transl. Med. 3, 74. 10.3978/j.issn.2305-5839.2015.01.28. - DOI - PMC - PubMed
    1. Nakatsukasa H, Zhang D, Maruyama T, Chen H, Cui K, Ishikawa M, Deng L, Zanvit P, Tu E, Jin W, et al. (2015). The DNA-binding inhibitor Id3 regulates IL-9 production in CD4(+) T cells. Nat. Immunol. 16, 1077–1084. 10.1038/ni.3252. - DOI - PMC - PubMed
    1. Park SA, Lim YJ, Ku WL, Zhang D, Cui K, Tang LY, Chia C, Zanvit P, Chen Z, Jin W, et al. (2022). Opposing functions of circadian protein DBP and atypical E2F family E2F8 in anti-tumor Th9 cell differentiation. Nat. Commun. 13, 6069. 10.1038/s41467-022-33733-8. - DOI - PMC - PubMed

Publication types

MeSH terms