. 2024 Aug 6;121(32):e2403652121.
doi: 10.1073/pnas.2403652121. Epub 2024 Jul 31.

OPALIN is an LGI1 receptor promoting oligodendrocyte differentiation

Affiliations

OPALIN is an LGI1 receptor promoting oligodendrocyte differentiation

Xiao-Yu Teng et al. Proc Natl Acad Sci U S A. .

Abstract

Leucine-rich glioma-inactivated protein 1 (LGI1), a secretory protein in the brain, plays a critical role in myelination; dysfunction of this protein leads to hypomyelination and white matter abnormalities (WMAs). Here, we hypothesized that LGI1 may regulate myelination through binding to an unidentified receptor on the membrane of oligodendrocytes (OLs). To search for this hypothetic receptor, we analyzed LGI1 binding proteins through LGI1-3 × FLAG affinity chromatography with mouse brain lysates followed by mass spectrometry. An OL-specific membrane protein, the oligodendrocytic myelin paranodal and inner loop protein (OPALIN), was identified. Conditional knockout (cKO) of OPALIN in the OL lineage caused hypomyelination and WMAs, phenocopying LGI1 deficiency in mice. Biochemical analysis revealed the downregulation of Sox10 and Olig2, transcription factors critical for OL differentiation, further confirming the impaired OL maturation in Opalin cKO mice. Moreover, virus-mediated re-expression of OPALIN successfully restored myelination in Opalin cKO mice. In contrast, re-expression of LGI1-unbound OPALIN_K23A/D26A failed to reverse the hypomyelination phenotype. In conclusion, our study demonstrated that OPALIN on the OL membrane serves as an LGI1 receptor, highlighting the importance of the LGI1/OPALIN complex in orchestrating OL differentiation and myelination.

Keywords: LGI1; OPALIN; Sox10; myelination; oligodendrocyte differentiation.


Conflict of interest statement

Competing interests statement:The authors declare no competing interest.

Figures

Fig. 1.
Fig. 1.
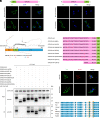
LGI1 directly binds to OPALIN. (A) Schematic diagram showing the experimental procedure of coimmunoprecipitation combined with mass spectrometry. (B) Coomassie staining of an SDS-PAGE gel containing the recombinant protein. The table shows the mass spectrometry results. (C) Schematic diagram showing the domains of the OPALIN protein. The peptide segments identified by mass spectrometry are labeled. NTD, N-terminal domain; TM, transmembrane; CTD, C-terminal domain. (D) Representative images of double-staining for OPALIN/MBP in the CC of WT mice at P14. (Scale bar, 10 μm.) (E) Representative images of double-staining for OPALIN/CC1 in primary cultured OLs. The nucleus was stained with DAPI (blue). (Scale bar, 10 μm.) (F and G) Coimmunoprecipitation of LGI1 and OPALIN from WT mouse brain lysates. An OPALIN antibody (F) and an LGI1 antibody (G) were used for immunoprecipitation. (H) Top panels show the schematic of the experimental procedure for plasmid transfection, purified protein incubation, and immunofluorescence staining. Bottom panels show representative images for double staining of HA-tagged OPALIN and FLAG-tagged LGI1 in HEK293T cells. Nuclei were stained with DAPI (blue). Arrowheads indicate OPALIN-negative cells. (Scale bar, 10 μm.) (I) Coimmunoprecipitation results for HA-tagged OPALIN with FLAG-tagged LGI1 from HEK293T cell lysates (n = 3 replicates for each experiment). IP, immunoprecipitation; IB, immunoblotting.
Fig. 2.
Fig. 2.
The NTD of OPALIN is responsible for its binding to LGI1. (A and B) Immunostaining for HA in HEK293T cells expressing HA-OPALIN (A) and OPALIN-HA (B) with or without membrane permeabilization. The HA tag was inserted at the N terminus (A) and C terminus (B) of OPALIN. (Scale bar, 10 μm.) (C) The membrane topology of OPALIN. The NTD of OPALIN contains two N-linked glycosylation consensus sites (orange) and two charged amino acid sites (blue or red). (D) Schematic representation of the HA-tagged OPALIN variant constructs. (E) Coimmunoprecipitation results for HA-tagged OPALIN or HA-tagged OPALIN variants with FLAG-tagged LGI1 from HEK293T cell lysates (n = 3 replicates for each experiment). (F) Representative images of double-staining for HA-tagged OPALIN (or the HA-tagged OPALIN variant) and FLAG-tagged LGI1 in HEK293T cells. Nuclei were counterstained with DAPI (blue). (Scale bar, 10 μm.) (G) Sequence alignment of OPALIN around K23 and D26 in various species.
Fig. 3.
Fig. 3.
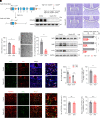
OPALIN is required for myelination. (A) Gene targeting and mouse breeding strategies for the generation of Opalin cKO mice. Western blotting for OPALIN protein expression in the CC of Opalin cKO mice (Olig1-Cre; Opalinfl/fl) and littermate controls (Olig1-Cre; Opalinfl/+) at P14 (n = 6 mice per group). (B) Representative images for Nissl staining using coronal brain sections from Opalin cKO mice and controls. Boxed areas in the Left panels are shown at high magnification in the corresponding Right panels. The scale bar is 200 μm in the Left or 100 μm in the Right. (C) Quantification of the CC area in Opalin cKO mice and controls (n = 6 mice per group; **P < 0.01). (D) Representative electron microscopy images of the CC of Opalin cKO mice and controls at P14. Myelinated axons were counted (n = 6 mice per group; ***P < 0.001). (Scale bar, 2 μm.) (E) Western blotting for MAG, MBP, and PLP1 levels. Protein samples prepared from the CC of mice at P14 were used. Representative bands (Left) and relative protein levels (Right) are shown (n = 6 mice per group; ***P < 0.001). GAPDH was used as the loading control. (F) Representative images of double-staining for Olig2/CC1 in the CC of Opalin cKO mice and controls at P14. Nuclei were counterstained with DAPI (blue). The boxed area is shown on the Right. Arrows indicate Olig2+/CC1+ cells. The scale bar is 50 μm in the Left or 25 μm in the Right. (G and H) Average number of Olig2+ cells and CC1+ cells per mm2 (G) and the ratio of the number of Olig2+/CC1+ cells to that of Olig2+ cells (%) (H) in the CC (n = 6 mice per group; **P < 0.01; ***P < 0.001). (I) Representative images of double-staining for PDGFRα/BrdU in the CC. The boxed area is shown on the Right. Arrows indicate PDGFRα+/BrdU+ cells. The scale bar is 50 μm in the Left or 25 μm in the Right. (J and K) Average number of PDGFRα+ cells per mm2 (J) and the ratio of the number of PDGFRα+/BrdU+ cells to that of PDGFRα+ cells (%) (K) in the CC (n = 6 mice per group; ns, not significant).
Fig. 4.
Fig. 4.
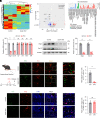
OPALIN deletion causes the downregulation of transcription factors important for OL differentiation. (A) Heatmap illustrating the expression levels of different genes in the brains of Opalin cKO mice compared with controls. Different groups are indicated on the x-axis. The y-axis shows different genes, including Sox10 and Olig2. (B) Volcano plot showing changes in the expression of transcripts in the brains of Opalin cKO mice. Red dots represent upregulated transcripts, and blue dots represent downregulated transcripts in Opalin cKO mice. (C) Gene Ontology (GO) analysis revealed the enrichment of several signaling pathways in Opalin cKO mice. (D) qRT-PCR analysis. The mRNA levels of Olig2, Sox10, Id2, Id4, Hes1, and Tcf4 were examined in the CC of Opalin cKO mice at P14 (n = 6 mice per group; ns, not significant; ***P < 0.001). (E) Western blotting for Olig2 and Sox10. The levels of these two proteins were significantly decreased in the CC of Opalin cKO mice at P14 (n = 6 mice per group; ***P < 0.001). Representative bands (Left) and relative protein levels (Right) are shown. GAPDH was used as the loading control. (F) Schematic diagram of the experimental design. BrdU was injected into mice for three consecutive days beginning at P7. Histological analysis was performed at P14. (G) Representative images of double-staining for BrdU/CC1 in brain sections at P14. The boxed area is shown on the Right. Arrows indicate BrdU+/CC1+ cells. The scale bar is 50 μm in the Left or 25 μm in the Right. (H) Ratio of the number of BrdU+/CC1+ cells to that of CC1+ cells (%) in the CC of Opalin cKO mice and controls (n = 6 mice per group; ***P < 0.001). (I) Representative images of double-staining for Ki67/Olig2 in the brain at P14. The boxed area is shown on the Right. Arrows indicate Ki67+/Olig2+ cells. The scale bar is 50 μm in the Left or 25 μm in the Right. (J) Ratio of the number of Ki67+/Olig2+ cells to that of Olig2+ cells (%) in the CC of Opalin cKO mice and controls (n = 6 mice per group; ns, not significant).
Fig. 5.
Fig. 5.
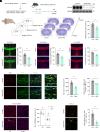
NG2-CreERT2-mediated deletion of Opalin causes the loss of mature OLs. (A) Breeding strategy for the generation of inducible Opalin icKO (NG2-CreERT2; Opalinfl/fl) mice. Schematic diagram showing tamoxifen administration to NG2-CreERT2; Opalinflox mice on three consecutive days at P3. Histological analysis was conducted using mice at P14. (B) Western blotting for OPALIN protein expression in the CC of Opalin icKO mice and controls at P14. (C) Simple drawing of the rostrocaudal extent of the CC and Nissl staining of the brains of Opalin icKO mice (NG2-CreERT2; Opalinfl/fl) and littermate controls (NG2-CreERT2; Opalinfl/+) at P14. Nissl staining was performed using three coronal sections at bregma 0.38, 0.62, and 0.86 mm. (Scale bar, 500 μm.) (D) Quantification of the total volume of the CC in Opalin icKO mice and controls (n = 6 mice per group; **P < 0.01). (EG) Representative images of fluorescence IHC staining for MBP (E), MAG (F), and PLP1 (G) in Opalin icKO and control mice at P14 (n = 6 mice per group; **P < 0.01; ***P < 0.001). (Scale bar, 100 μm.) (H) Representative images of double-staining for Olig2/CC1 in the CC of mice at P14. Nuclei were counterstained with DAPI (blue). The boxed area is shown on the Right. The scale bar is 50 μm in the Left or 25 μm in the Right. (I and J) Average number of CC1+ cells per mm2 (I) and the ratio of the number of Olig2+/CC1+ cells to that of Olig2+ cells (%) (J) in the CC of Opalin icKO mice and controls (n = 6 mice per group; *P < 0.05; ***P < 0.001). (K) Representative images of fluorescence IHC staining for PDGFRα in Opalin icKO and control mice at P14 (n = 6 mice per group; ns, not significant). (Scale bar, 50 μm.) (L) Representative images of double-staining for BrdU/CC1 in the CC of Opalin icKO and control mice at P14 (n = 6 mice per group; ***P < 0.001). (Scale bar, 50 μm.)
Fig. 6.
Fig. 6.
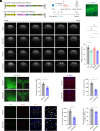
AAV-mediated expression of WT OPALIN but not mutant OPALIN effectively rescues myelination in Opalin icKO mice. (A) Schematic diagram showing the lateral ventricle injection of the virus into NG2-CreERT2; Opalinfl/fl mice at P0, followed by tamoxifen administration for three consecutive days at P3. Brain sections were prepared from mice at P28. LV, lateral ventricle. (B) Fluorescence images showing the expression of EGFP in the CC after viral infection. (Scale bar, 50 μm.) (C) Series of MRI images of four different groups of mice, including control, Opalin icKO, Opalin icKO expressing WT OPALIN and Opalin icKO expressing the OPALIN_K23A/D26A mutant. MRI measures FA to evaluate the microstructure of white matter. The relative FA value in the CC is shown in the graph on the Right (n = 6 mice per group; **P < 0.01; ns, not significant). (D and E) Representative images of fluorescence IHC staining for MBP (D) and CC1 (E) in Opalin icKO mice expressing WT OPALIN or mutant OPALIN (n = 6 mice per group; **P < 0.01). The scale bar represents 100 μm in D and 50 μm in E. (F) Representative images of double-staining for Olig2/Sox10 in the CC of mice. Nuclei were counterstained with DAPI (blue). The boxed area is shown on the Right. Scale bars represent 50 μm in the Left and 25 μm in the Right. (G and H) Quantification of Sox10+ cells per mm2 (G) and the ratio of the number of Olig2+/Sox10+ cells to that of Olig2+ cells (%) (H) in the CC of Opalin cKO mice expressing WT OPALIN or mutant OPALIN (n = 6 mice per group; *P < 0.05; ***P < 0.001).

References

    1. Fields R. D., White matter in learning, cognition and psychiatric disorders. Trends Neurosci. 31, 361–370 (2008). - PMC - PubMed
    1. Karlsgodt K. H., White matter microstructure across the psychosis spectrum. Trends Neurosci. 43, 406–416 (2020). - PMC - PubMed
    1. Wolf N. I., Ffrench-Constant C., van der Knaap M. S., Hypomyelinating leukodystrophies—Unravelling myelin biology. Nat. Rev. Neurol. 17, 88–103 (2021). - PubMed
    1. Chang K. J., Redmond S. A., Chan J. R., Remodeling myelination: Implications for mechanisms of neural plasticity. Nat. Neurosci. 19, 190–197 (2016). - PMC - PubMed
    1. Taveggia C., Feltri M. L., Wrabetz L., Signals to promote myelin formation and repair. Nat. Rev. Neurol. 6, 276–287 (2010). - PMC - PubMed

MeSH terms

Substances

LinkOut - more resources