. 2024 Aug 2;10(31):eadm8836.
doi: 10.1126/sciadv.adm8836. Epub 2024 Jul 31.

Immediate myeloid depot for SARS-CoV-2 in the human lung

Affiliations

Immediate myeloid depot for SARS-CoV-2 in the human lung

Mélia Magnen et al. Sci Adv. .

Abstract

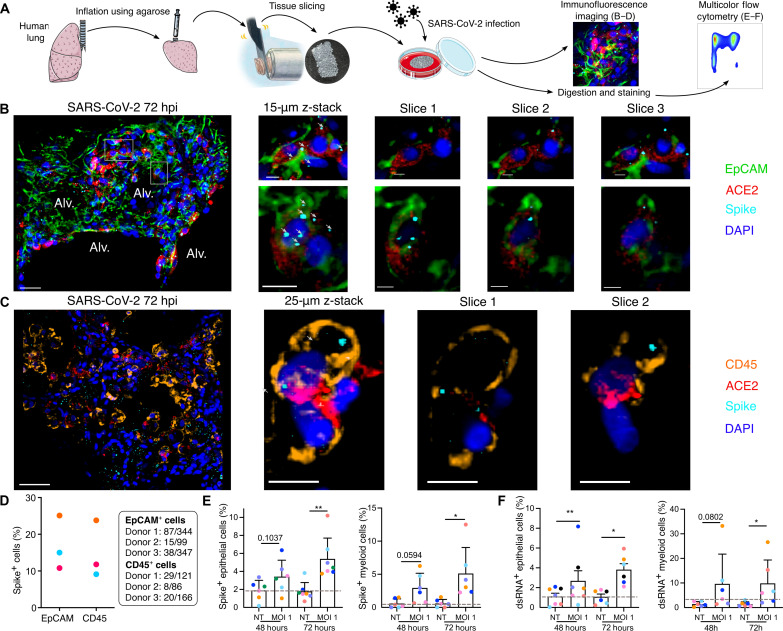
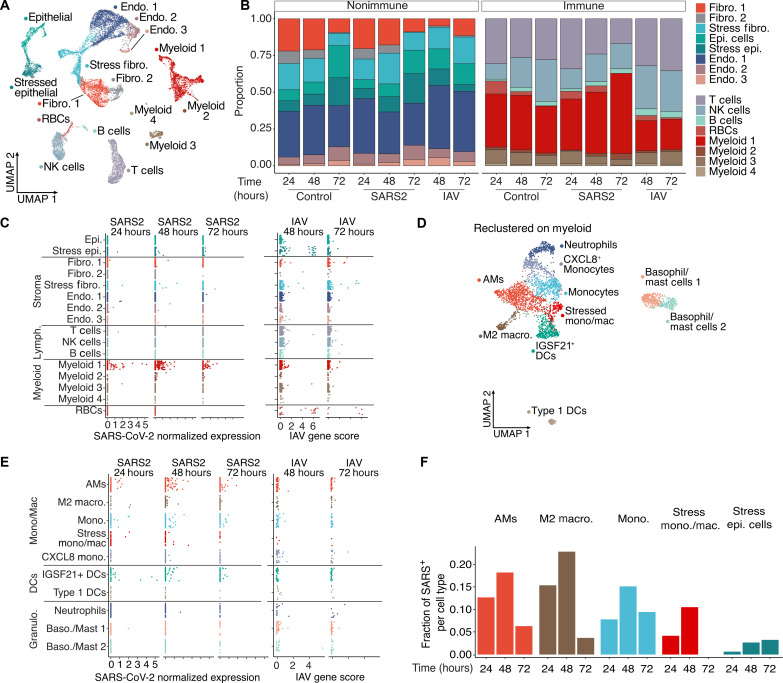
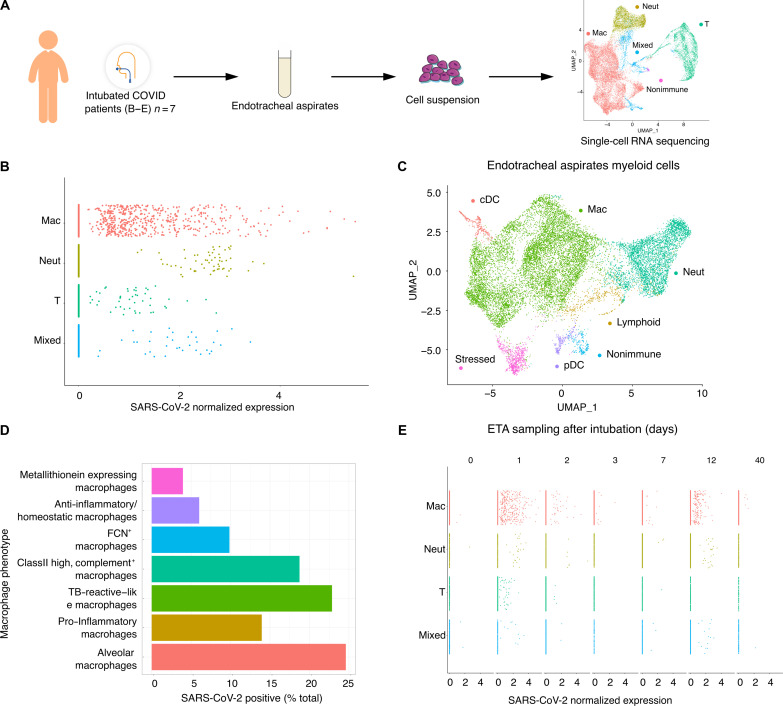
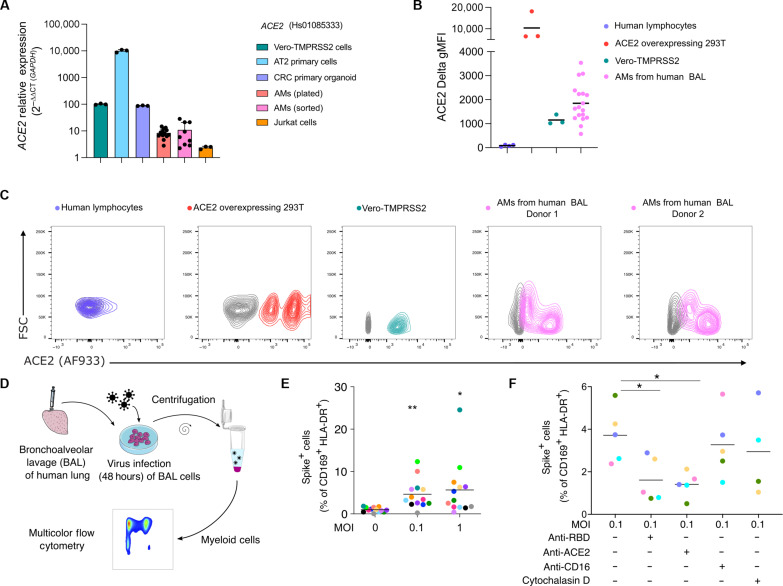
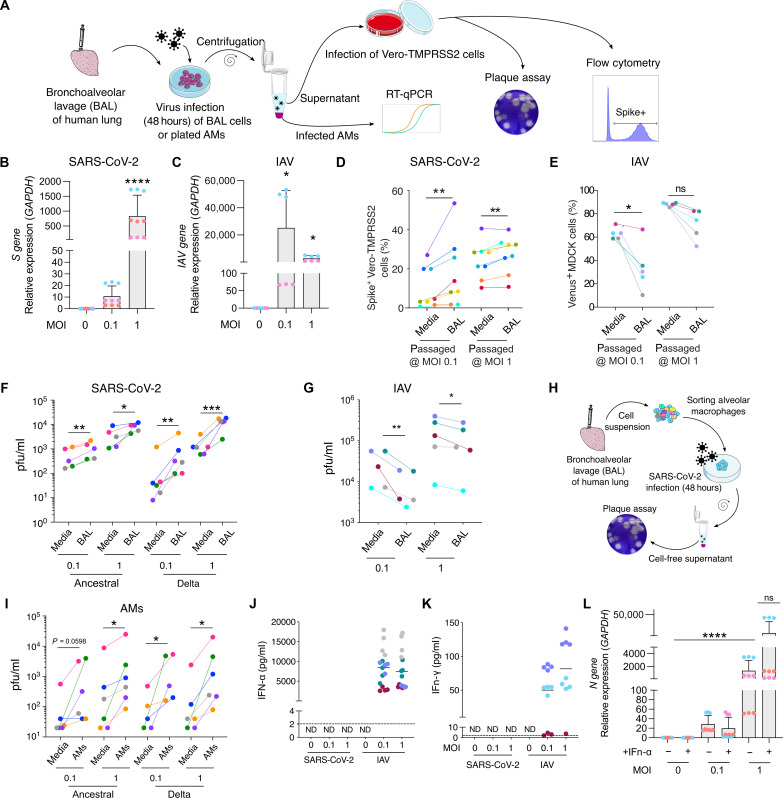
In the pathogenesis of severe acute respiratory syndrome coronavirus 2 (SARS-CoV-2) infection, epithelial populations in the distal lung expressing Angiotensin-converting enzyme 2 (ACE2) are infrequent, and therefore, the model of viral expansion and immune cell engagement remains incompletely understood. Using human lungs to investigate early host-viral pathogenesis, we found that SARS-CoV-2 had a rapid and specific tropism for myeloid populations. Human alveolar macrophages (AMs) reliably expressed ACE2 allowing both spike-ACE2-dependent viral entry and infection. In contrast to Influenza A virus, SARS-CoV-2 infection of AMs was productive, amplifying viral titers. While AMs generated new viruses, the interferon responses to SARS-CoV-2 were muted, hiding the viral dissemination from specific antiviral immune responses. The reliable and veiled viral depot in myeloid cells in the very early phases of SARS-CoV-2 infection of human lungs enables viral expansion in the distal lung and potentially licenses subsequent immune pathologies.


Figures

Fig. 1.
Fig. 1.. SARS-CoV-2 infects both epithelial and immune cells in human PCLS.
(A) Human lung lobes were inflated with 2% low–melting point agarose and sectioned into 300-μm PCLSs, which were infected with SARS-CoV-2 for 48 or 72 hours. PCLS were either used for confocal imaging (B to D) or flow cytometry (E and F). (B and C) Alveolar spaces (Alv.) are indicated in the large image (scale bar, 50 μm). Zoomed area is marked by the white rectangle. For each zoomed area, 15- or 25-μm z-stacks appear on the side (scale bar, 10 μm). (B) PCLS were stained for 4′,6-diamidino-2-phenylindole (DAPI) (dark blue), EpCAM (green), ACE2 (red), and spike (light blue). (C) PCLS were stained for DAPI (dark blue), CD45 (orange), ACE2 (red), and spike (light blue). (D) For both stainings, spike-positive cell percentages are displayed for three donors. (E and F) PCLS were infected at MOI 1. Infection was assessed by intracellular spike and dsRNA staining in epithelial (E) and myeloid cells (F) (n = 6 to 7). Gray dashed lines indicate detection limit of assays. Data are means ± SEM. Each dot represents the average percentage per donor of two to three PCLS. *P < 0.05, **P < 0.01.
Fig. 2.
Fig. 2.. SARS-CoV-2 displays tropism for myeloid cells compared to IAV.
(A) A Uniform Manifold Approximation and Projection (UMAP) visualization of cells from control, SARS-CoV-2, and IAV-infected PCLS (two donors, three technical replicates) collected at distinct times. (B) Relative quantification of cell types from the different experimental conditions, stratified by time point. (C) Scatterplots describing the library-normalized SARS-CoV-2 expression across various cell types in SARS-CoV-2–infected PCLS (left) or IAV gene score in IAV-infected PCLS (right). (D) A UMAP of finely annotated myeloid cell types in the dataset. (E) Distribution of infected myeloid cells similar to (C). (F) The fraction of SARS-CoV-2–positive cells at different time points.
Fig. 3.
Fig. 3.. Tropism of SARS-CoV-2 for myeloid cells in ETAs from COVID-19 individuals with ARDS.
(A) ETAs were collected from SARS-CoV-2 infected individuals with ARDS and tested with scRNA-seq. UMAP at far right shows landmark populations. (B) Distribution of per-cell normalized SARS-CoV-2 expression in landmark cell types. (C) UMAP projection of myeloid subtypes in ETAs. (D) Fraction of SARS-CoV-2–positive cells per myeloid cell type (E) Days (D0 to D40) at the top of the graph represent the days after intubation when the ETA samples were collected. Each column represents a unique COVID-19 individual except for postintubation day 2, where two individuals are represented. See table S2 for details.
Fig. 4.
Fig. 4.. SARS-CoV-2 infection of AMs is ACE2 dependent.
(A to C) ACE2 mRNA and protein expression was assessed on AMs (AMs: CD169+ HLA-DR+ cells) from BAL of human lungs. (A) ACE2 transcript expression was assessed by RT-qPCR in Vero-TMPRSS2 cells (green), AT2 primary cells (blue), colorectal cancer (CRC) organoid (violet), Jurkat cells (orange), and AMs from human BAL [red (plated) and pink (flow-sorted), n = 3 donors]. Relative mRNA expression is displayed as 2−∆∆CT relative to GAPDH for probe Hs1085333. Vero-TMPRSS2 are set at 100. Bars show means ± SD. (B) and (C) ACE2 protein expression was measured in AMs from human BAL (n = 18, each dot is a donor), in Vero-TMPRSS2 cells (n = 3), in ACE2-overexpressing 293 T cells (ACE2-293 T, n = 3), and in human lymphocytes from PBMCs (n = 4). Delta MFI (Stained MFI − FMO MFI) was measured for each population. Results are displayed as contour plots, gray lines represent FMO staining, and colored lines are the fully stained samples. (D and E) AM infection (MOI 0.1 and 1) was measured by flow cytometry using spike staining and compared to nontreated (MOI 0) cells (mean, each color represents a human lung donor, n = 13). (F) RBD, ACE2, or CD16 blocking antibody or cytochalasin D was added to BAL cells before infection (MOI 0.1). Cells were analyzed by flow cytometry (n = 4 to 5). *P < 0.05, **P < 0.01.
Fig. 5.
Fig. 5.. SARS-CoV-2 infection of AMs leads to viral amplification.
(A to C) Virus gene expression was measured in plated AMs at 48 hours after infection with SARS-CoV-2 (B) or IAV (C). (A), (D), and (E) BAL cells were infected with SARS-CoV-2 (BAL). As a control, SARS-CoV-2 was incubated in culture media alone (Media). Cell-free supernatant was used to infect Vero-TMPRSS2 cells. (D) At 24 hours after infection, Vero-TMPRSS2 cells were stained for intracellular spike expression and analyzed using flow cytometry (n = 8). (E) Similarly, IAV-Venus was used to infect BAL cells or incubated with media. Cell-free supernatant was used to infect MDCK cells. At 24 hours after infection, Venus expressing MDCK percentage was measured by flow cytometry (n = 5). (F and G) Plaque assay was used to further assess viral titer in supernatant of infected BAL cells (n = 5 to 6). (H) AMs were sorted from BAL samples. (I) Following 48 hours of SARS-CoV-2 infection (Ancestral, Delta), viral titer was determined by plaque assay (n = 5 to 6). (J and K) BAL cells were infected for 48 hours with either IAV or SARS-CoV-2 at MOl 0. 1 or 1. After 48 hours of infection, IFN-α (J) and IFN-γ (K) were measured in the supernatant. (L) Plated AMs were infected with SARS-CoV-2 and treated with IFN-α (10 pg/ml) at 24 hours after infection. At 48 hours after infection, SARS-CoV-2 N gene expression was measured by RT-qPCR. ND, not detectable; ns, not significant; *P < 0.05, **P < 0.01, ***P < 0.001, ****P < 0.0001.

Update of

Similar articles

Cited by

References

    1. Lamers M. M., Haagmans B. L., SARS-CoV-2 pathogenesis. Nat. Rev. Microbiol. 20, 270–284 (2022). - PubMed
    1. Ortiz M. E., Thurman A., Pezzulo A. A., Leidinger M. R., Klesney-Tait J. A., Karp P. H., Tan P., Wohlford-Lenane C., McCray P. B. Jr., Meyerholz D. K., Heterogeneous expression of the SARS-Coronavirus-2 receptor ACE2 in the human respiratory tract. EBioMedicine 60, 102976 (2020). - PMC - PubMed
    1. Zhao Y., Zhao Z., Wang Y., Zhou Y., Ma Y., Zuo W., Single-cell RNA expression profiling of ACE2, the receptor of SARS-CoV-2. Am. J. Respir. Crit. Care Med. 202, 756–759 (2020). - PMC - PubMed
    1. Combes A. J., Courau T., Kuhn N. F., Hu K. H., Ray A., Chen W. S., Chew N. W., Cleary S. J., Kushnoor D., Reeder G. C., Shen A., Tsui J., Hiam-Galvez K. J., Munoz-Sandoval P., Zhu W. S., Lee D. S., Sun Y., You R., Magnen M., Rodriguez L., Im K. W., Serwas N. K., Leligdowicz A., Zamecnik C. R., Loudermilk R. P., Wilson M. R., Ye C. J., Fragiadakis G. K., Looney M. R., Chan V., Ward A., Carrillo S., Consortium U. C., Matthay M., Erle D. J., Woodruff P. G., Langelier C., Kangelaris K., Hendrickson C. M., Calfee C., Rao A. A., Krummel M. F., Global absence and targeting of protective immune states in severe COVID-19. Nature 591, 124–130 (2021). - PMC - PubMed
    1. Mathew D., Giles J. R., Baxter A. E., Oldridge D. A., Greenplate A. R., Wu J. E., Alanio C., Kuri-Cervantes L., Pampena M. B., D’Andrea K., Manne S., Chen Z., Huang Y. J., Reilly J. P., Weisman A. R., Ittner C. A. G., Kuthuru O., Dougherty J., Nzingha K., Han N., Kim J., Pattekar A., Goodwin E. C., Anderson E. M., Weirick M. E., Gouma S., Arevalo C. P., Bolton M. J., Chen F., Lacey S. F., Ramage H., Cherry S., Hensley S. E., Apostolidis S. A., Huang A. C., Vella L. A.; UPenn COVID Processing Unit, Betts M. R., Meyer N. J., Wherry E. J., Deep immune profiling of COVID-19 patients reveals distinct immunotypes with therapeutic implications. Science 369, eabc8511 (2020). - PMC - PubMed

Publication types

MeSH terms

Substances