. 2024 Aug 2;10(31):eadp3363.
doi: 10.1126/sciadv.adp3363. Epub 2024 Jul 31.

Making sense of scattering: Seeing microstructure through shear waves

Affiliations

Making sense of scattering: Seeing microstructure through shear waves

Giacomo Annio et al. Sci Adv. .

Abstract

The physics of shear waves traveling through matter carries fundamental insights into its structure, for instance, quantifying stiffness for disease characterization. However, the origin of shear wave attenuation in tissue is currently not properly understood. Attenuation is caused by two phenomena: absorption due to energy dissipation and scattering on structures such as vessels fundamentally tied to the material's microstructure. Here, we present a scattering theory in conjunction with magnetic resonance imaging, which enables the unraveling of a material's innate constitutive and scattering characteristics. By overcoming a three-order-of-magnitude scale difference between wavelength and average intervessel distance, we provide noninvasively a macroscopic measure of vascular architecture. The validity of the theory is demonstrated through simulations, phantoms, in vivo mice, and human experiments and compared against histology as gold standard. Our approach expands the field of imaging by using the dispersion properties of shear waves as macroscopic observable proxies for deciphering the underlying ultrastructures.


Figures
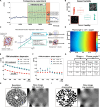
Fig. 1.
Fig. 1.. Shear viscosity has a substantial contribution originating from wave scattering onto vessels, and wavelength dispersion properties depend on the scatterers’ Hurst index.
(A) Measured temperature shift in a bovine tissue specimen quantified via MRT due to 200-Hz mechanical vibrations. The green and red arrows indicate the measured and theoretical temperature increase, respectively, assuming for the latter that the material’s attenuation is purely due to absorption. (B) Box plot showing the Hurst index H of vessels in tumoral and healthy liver tissue (with corresponding segmented histological cuts). (C) Vascularized tissue is modeled as a composite material made from an effective background described by a single classical spring-pot model. The power law exponent (slope κ) is linked to vasculature’s Hurst index (through scattering) and tissue’s constitutive properties (γ), while the phase angle Y depends solely on the constitutive background properties (γ). (D) The phase angle Y is bound to the admissible interval [0 − 1] for all the possible combination of γ and H. (E) Wavelength dispersion of propagating shear waves using FEM simulations in 2D scattering structures exhibiting two different Hurst indices (H = 0.1,0.15) for a given background (γ = 0.18). Data points and solid lines indicate the estimated wavelengths and corresponding power law fits, respectively. (F) Corresponding dispersion of the phase angle Y. (G) Table showing theoretical and corresponding estimated values for κ and Y. (H) Simulation of multiple wave reflections at a very fine spatial resolution with corresponding wave fields (curl of the 2D wave field). (I) Downscaled version of the simulated data.
Fig. 2.
Fig. 2.. 3D scattering structures, described by their Hurst index, affect differently the dispersion of wavelength and phase angle, shown in vivo and in vitro.
(A) The dispersion of shear wavelength (red dots, left y axis) and phase angle (green dots, right y axis) in an ultrasound gel (1) are presented; the inset shows the corresponding experimental shear waves. (B) The presence of a 3D-printed fractal structure (3D print and corresponding shear wave pattern shown in the insets) within the ultrasound gel affects the shear speed’s dispersion (red and blue dots) but not the phase angle’s (green dots). A power law fit (with corresponding fit parameters) is shown for each of the two frequency regimes (multiple scattering in red, ballistic in blue). (C) Shielded covariance of the 3D-printed fractal structure (in the inset) showing a sharply falling distribution centered at very small diameters (in blue) and a rising part probing the lags between the scatterers (datapoints and fit are indicated in red). (D) MRI image of a healthy volunteer’s liver. (E) Corresponding shear wavelength map at 50-Hz vibrations. (F) Wavelength’s (red dots, left y axis) and phase angle’s dispersion properties (green dots, right y axis) within the liver region of interest (ROI) (red ROI in D) with corresponding frequency power law fit. (G) Section of healthy human liver tissue stained (CD31) and segmented for vessels. (H) Corresponding shielded covariance. (I) Dispersion properties of the wavelength (red dots, left y axis) and phase angle (green dots, right y axis) in ultrasound gel (2) follow the spring-pot model.
Fig. 3.
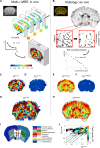
Fig. 3.. Maps of vascular fractality in the mouse brain, obtained in vivo via shear wave scattering and ex vivo from histology, show a strong correlation and match the anatomical atlas.
(A) Individual MRE experiments in a living mouse provide spatially resolved images of the shear wavelength for each mechanical excitation frequency. A pixel-wise power law fit to the dispersion properties and an average of the phase angle obtained from all frequencies allows to extract for each image pixel the corresponding Hurst index H, as explained beforehand. This yields spatially resolved maps of the vasculature’s fractality via Df = 2 − H. (B) Ex vivo box counting analysis pipeline: vessels were stained (Glut1) on tissue slices, and corresponding images accordingly segmented. Structures below 7 μm in size were removed as they constitute capillaries in mice and therefore do not exhibit smooth muscle cells. Box counting was performed on sub-tiles of 512 × 512 pixels. (C) Map of Df from in vivo shear wave scattering ( Dfin vivo ). (D) Corresponding error ( EDfin vivo ). (E) Map of Df from histology ( Dfhistology ). (F) Corresponding error ( EDfhistology ). (G) Dfin vivo coregistered to a mouse brain atlas with anatomical regions overlaid. (H) Corresponding map of Dfhistology . (I) Matching section of a mouse brain atlas. (J) Correlation between in vivo and histology derived fractal dimension as a pixel density plot with respect to the total number of pixels in the brain region. The solid red line represents unity, while the dashed green (blue) lines indicate SD(s) of ±1σ (±2σ), respectively.
Fig. 4.
Fig. 4.. The Hurst index estimated from the shielded covariance, correlates to the fractal dimension Df.
(A) Covariance function of medium fluctuations generated from the 3D-printed fractal-like structure shown in Fig. 2 (B and C). Mind that the full covariance includes lags which are not accessible to the process of multiple reflections as they are shielded. (B) Correlation of effective Hurst index H′ with corresponding fractal dimension Df at box size 2 pixels, calculated for the data collective from Fig. 1A. (C) Corresponding correlation of H′ with Df quantified at box size 32 pixels.
Fig. 5.
Fig. 5.. Absolute error in the approximation of the phase angle of the shear modulus.
That is, the difference between Eqs. 22 and 20 normalized by π2.

Similar articles

References

    1. Schmitt J. M., Kumar G., Turbulent nature of refractive-index variations in biological tissue. Opt. Lett. 21, 1310–1312 (1996). - PubMed
    1. Xu M., Alfano R. R., Fractal mechanisms of light scattering in biological tissue and cells. Opt. Lett. 30, 3051–3053 (2005). - PubMed
    1. Barthelemy P., Bertolotti J., Wiersma D. S., A Lévy flight for light. Nature 453, 495–498 (2008). - PubMed
    1. Page J. H., Sheng P., Schriemer H. P., Jones I., Jing X., Weitz D. A., Group velocity in strongly scattering media. Science 271, 634–637 (1996).
    1. Tourin A., Fink M., Derode A., Multiple scattering of sound. Waves Random Media 10, R31 (2000).

Publication types