. 2024 Aug 22;67(16):14175-14183.
doi: 10.1021/acs.jmedchem.4c00983. Epub 2024 Jul 31.

Interaction of Cephalosporins with Human Serum Albumin: A Structural Study

Affiliations

Interaction of Cephalosporins with Human Serum Albumin: A Structural Study

Akito Kawai et al. J Med Chem. .

Abstract

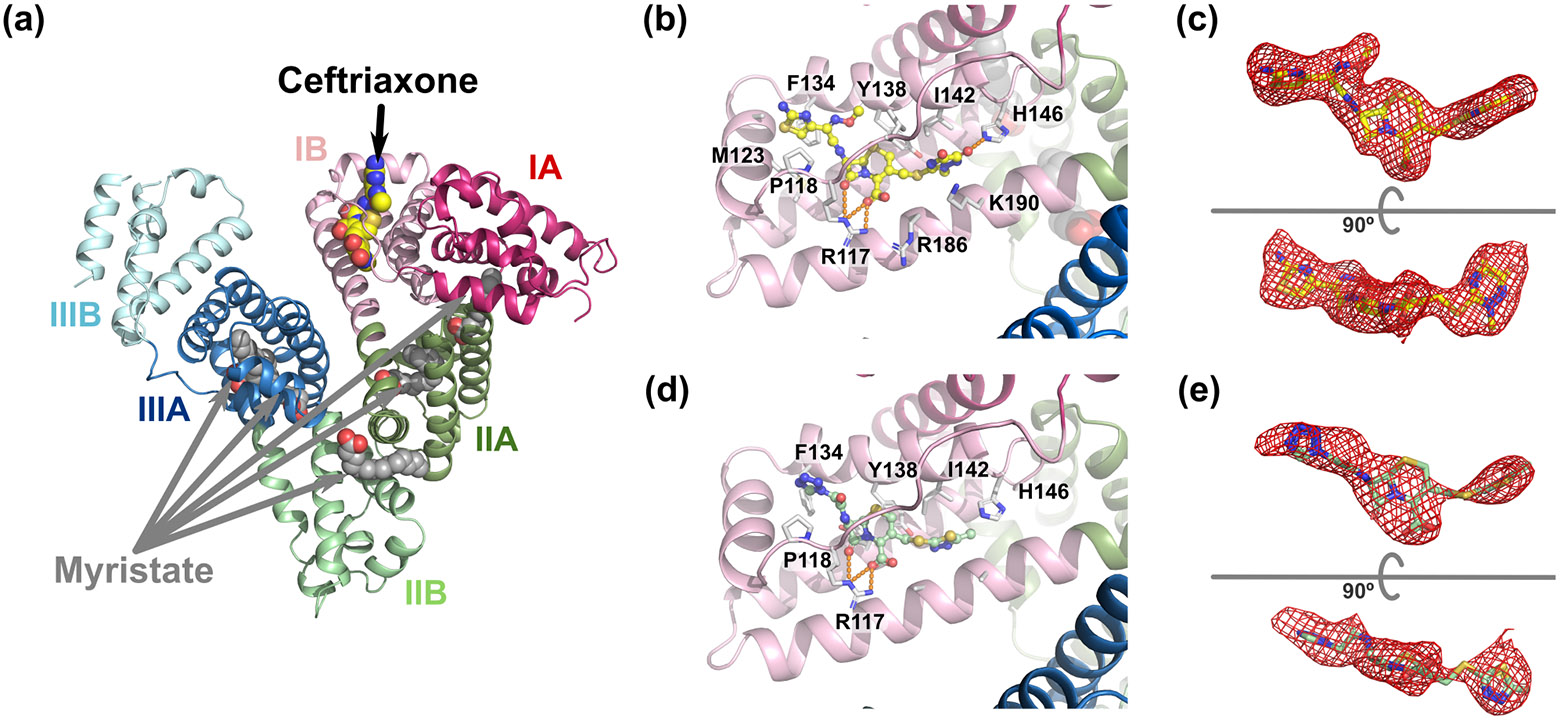
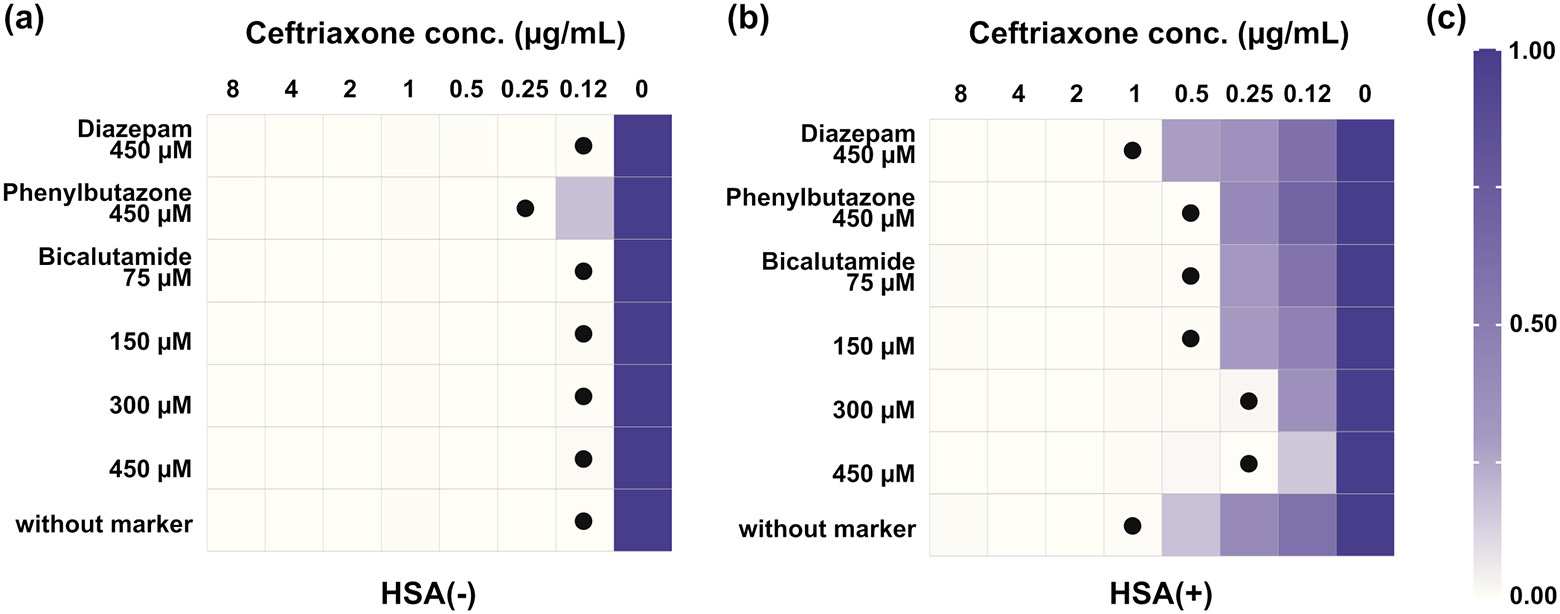
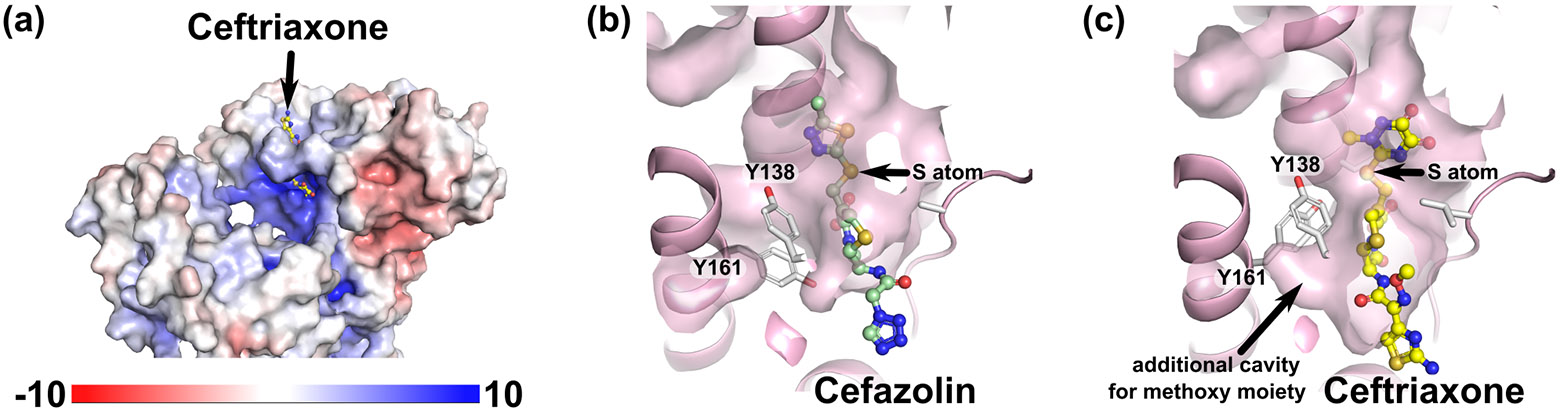
Modification of the R1 and R2 side chain structures has been used as the main strategy to expand the spectrum of cephalosporins and impart resistance to hydrolysis by β-lactamases. These structural modifications also result in a wide range of plasma protein binding, especially with human serum albumin (HSA). Here, we determined the crystal structures of the HSA complexes with two clinically important cephalosporins, ceftriaxone and cefazolin, and evaluated the binding of cephalosporin to HSA by susceptibility testing and competitive binding assay. Ceftriaxone and cefazolin bind to subdomain IB of HSA, and their cephem core structures are recognized by Arg117 of HSA. Tyr161 of HSA changes its rotamer depending on the cephalosporin, resulting in alterations of the cavity shape occupied by the R2 side chain of cephalosporins. These findings provide structural insight into the mechanisms underlying the HSA binding of cephalosporins.


Figures

Figure 1.
Figure 1.. Chemical structures of cephalosporins.
(a) Cephem core structure. The positions of the side chains R1 and R2 are labeled with red letters. (b) ceftriaxone (c) cefazolin
Figure 2.
Figure 2.. Structure of cephalosporin and its plasma protein binding parameter.
Plasma protein binding parameters are indicated in parentheses and are referenced from Kanis et al.
Figure 3.
Figure 3.. Crystal structures of the HSA-cephalosporin-myristate complex.
(a) Overall structure of the HSA-ceftriaxone-myristate complex (PDB ID: 8YXB). The subdomain structures are colored in magenta (IA), pink (IB), green (IIA), palegreen (IIB), blue (IIIA) and cyan (IIIB). The ceftriaxone molecule (yellow) and the myristate molecule (gray) are shown as CPK representations. (b–e) Close-up view of the interaction between ceftriaxone (b,c PDB ID: 8YXB) or cefazolin (d,e PDB ID: 8YXA) and subdomain IB of HSA. The molecules of ceftriaxone (yellow) and cefazolin (lightgreen) are shown as ball-and-stick representations. Hydrogen bonds are represented as orange dashed lines. (c,e) The mFo-DFc polder omit maps are shown as red meshes contoured at 4σ.
Figure 4.
Figure 4.. MICs of ceftriaxone against Escherichia coli ATCC 25922 in the presence or absence of HSA and site marker drugs.
Each well is colored according to the mean value of relative optical density to its growth control. Determined MICs are indicated by a dot in the wells, (a) in the absence of HSA (b) in the presence of HSA (c) The color-bar of relative optical density. The assays were run in triplicate.
Figure 5.
Figure 5.. Klotz plot analysis of ceftriaxone in the presence of bicalutamide as an inhibitor.
For the experiments, 40 μM of HSA was used. The total concentrations of ceftriaxone and bicalutamide were 10–120 μM and 0–80 μM, respectively. Df is the free concentration of ceftriaxone. Experimental data and theoretical fitting are represented by circles and solid line for the absence of bicalutamide, triangles and dotted line for 40 μM of bicalutamide and squares and dashed-dotted line for 80 μM of bicalutamide, respectively.
Figure 6.
Figure 6.. Substrate binding site at subdomain IB of HSA.
(a) Electrostatic potential molecular surface of HSA. Electrostatic surface potential was calculated with PDB2PQR and APBS. Potential values are given in units of kbTec, where kb: Boltzmann’s constant, T: temperature and ec; the charge of an electron. (b, c) Transparent molecular surfaces of the substrate binding site through the R2 chamber to the cephem core are colored in pink. The position of the sulfur atoms at the thiomethylene linker is labeled as “S atom”. The HSA complex with cefazolin (b) or ceftriaxone (c).
Figure 7.
Figure 7.. Structure comparison of ceftriaxone with bicalutamide.
The HSA in complex with ceftriaxone and bicalutamide complex (PDB ID: 4LA0) is shown as cartoon representations colored pink and blue, respectively. The molecules of ceftriaxone and bicalutamide are shown as ball-and-sticks and sticks representations colored yellow and purple, respectively.

Similar articles

References

    1. Lin X; Kuck U Cephalosporins as key lead generation beta-lactam antibiotics. Appl Microbiol Biotechnol 2022, 106 (24), 8007–8020. DOI: 10.1007/s00253-022-12272-8. - DOI - PMC - PubMed
    1. Tawara S; Matsumoto S; Matsumoto Y; Kamimura T; Goto S Structure-binding relationship and binding sites of cephalosporins in human serum albumin. J Antibiot (Tokyo) 1992, 45 (8), 1346–1357. DOI: 10.7164/antibiotics.45.1346. - DOI - PubMed
    1. Kanis E; Parks J; Austin DL Structural Analysis and Protein Binding of Cephalosporins. ACS Pharmacol Transl Sci 2023, 6 (1), 88–91. DOI: 10.1021/acsptsci.2c00168. - DOI - PMC - PubMed
    1. Pollock AA; Tee PE; Patel IH; Spicehandler J; Simberkoff MS; Rahal JJ Jr. Pharmacokinetic characteristics of intravenous ceftriaxone in normal adults. Antimicrob Agents Chemother 1982, 22 (5), 816–823. DOI: 10.1128/AAC.22.5.816. - DOI - PMC - PubMed
    1. Heffernan AJ; Sime FB; Kumta N; Wallis SC; McWhinney B; Ungerer J; Wong G; Joynt GM; Lipman J; Roberts JA Multicenter Population Pharmacokinetic Study of Unbound Ceftriaxone in Critically Ill Patients. Antimicrob Agents Chemother 2022, 66 (6), e0218921. DOI: 10.1128/aac.02189-21. - DOI - PMC - PubMed

LinkOut - more resources