. 2024 Aug 12;64(15):5977-5990.
doi: 10.1021/acs.jcim.4c00460. Epub 2024 Jul 31.

Adsorption-Driven Deformation and Footprints of the RBD Proteins in SARS-CoV-2 Variants on Biological and Inanimate Surfaces

Affiliations

Adsorption-Driven Deformation and Footprints of the RBD Proteins in SARS-CoV-2 Variants on Biological and Inanimate Surfaces

Antonio M Bosch et al. J Chem Inf Model. .

Abstract

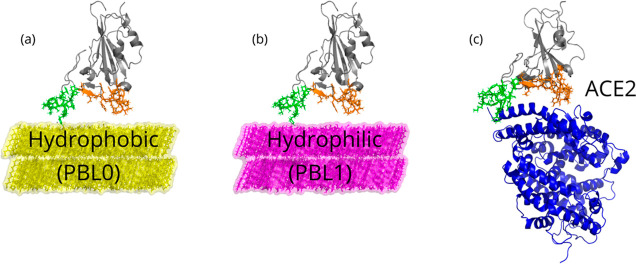
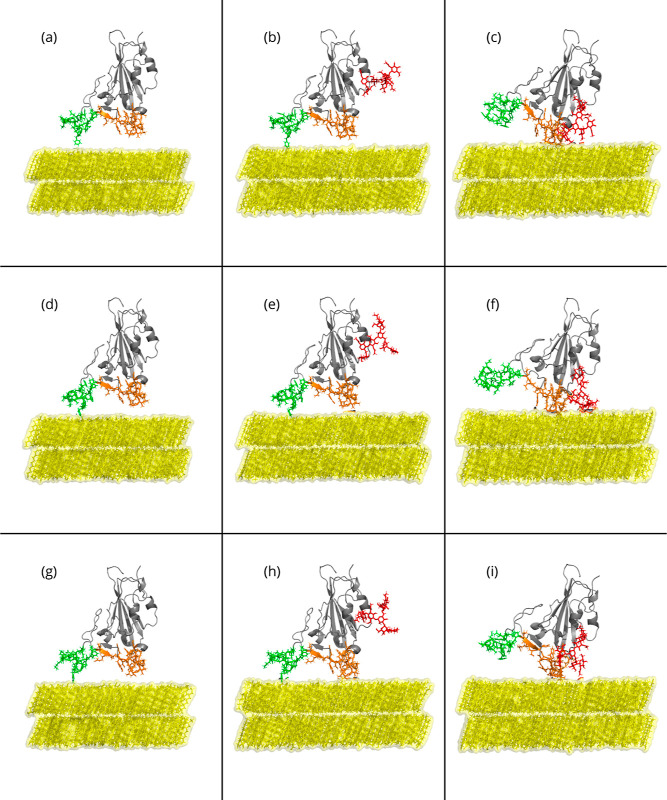
Respiratory viruses, carried through airborne microdroplets, frequently adhere to surfaces, including plastics and metals. However, our understanding of the interactions between viruses and materials remains limited, particularly in scenarios involving polarizable surfaces. Here, we investigate the role of the receptor-binding domain (RBD) of the spike protein mutations on the adsorption of SARS-CoV-2 to hydrophobic and hydrophilic surfaces employing molecular simulations. To contextualize our findings, we contrast the interactions on inanimate surfaces with those on native biological interfaces, specifically the angiotensin-converting enzyme 2. Notably, we identify a 2-fold increase in structural deformations for the protein's receptor binding motif (RBM) onto inanimate surfaces, indicative of enhanced shock-absorbing mechanisms. Furthermore, the distribution of adsorbed amino acids (landing footprints) on the inanimate surface reveals a distinct regional asymmetry relative to the biological interface, with roughly half of the adsorbed amino acids arranged in opposite sites. In spite of the H-bonds formed at the hydrophilic substrate, the simulations consistently show a higher number of contacts and interfacial area with the hydrophobic surface, where the wild-type RBD adsorbs more strongly than the Delta or Omicron RBDs. In contrast, the adsorption of Delta and Omicron to hydrophilic surfaces was characterized by a distinctive hopping-pattern. The novel shock-absorbing mechanisms identified in the virus adsorption on inanimate surfaces show the embedded high-deformation capacity of the RBD without losing its secondary structure, which could lead to current experimental strategies in the design of virucidal surfaces.


Conflict of interest statement

The authors declare no competing financial interest.

Figures

Figure 1
Figure 1
Snapshots of the three main scenarios simulated in this work. (a) Hydrophobic (PBL0) surface with an RBD, (b) hydrophilic (PBL1) surface with an RBD, and (c) RBD-ACE2 complex, as a reference control model, are depicted. Note that in all cases, the left (group 1) and right (group 2) legs of the RBD are colored green and orange, respectively. Water molecules are removed for visualization reasons.
Figure 2
Figure 2
Side-view snapshots of the RBD-PBL simulations performed for this research with the hydrophobic (PBL0) substrate at the beginning of the MD production. Rows show snapshots of the RBDs of (a–c) WT, (d–f) Delta, and (g–i) Omicron with the substrate alone, with its glycan standing vertically to the substrate, and rotated with respect to the substrate with its glycan, from top to bottom. In each panel, the left leg (group 1) is shown in green, the right leg (group 2) is in orange, and PBL0 is shown in yellow. The presence of the glycan chain is depicted in red.
Figure 3
Figure 3
Perpendicular, Rg⊥, vs parallel radius gyration, Rg∥, of (a–c) group 1 and (d–f) group 2 of the RBD in the presence of PBL0, PBL1, and ACE2 (from top to bottom). In each plot, green, blue, and orange dots are values for WT, Delta, and Omicron each 200 ps, respectively, excluding the first 100 ns. The black square, triangle, and inverse triangle are the means of perpendicular and parallel radius gyrations, i.e., ⟨Rg⊥⟩, and ⟨Rg∥⟩ of each variant. In the legends and inside the parentheses, the formula image 
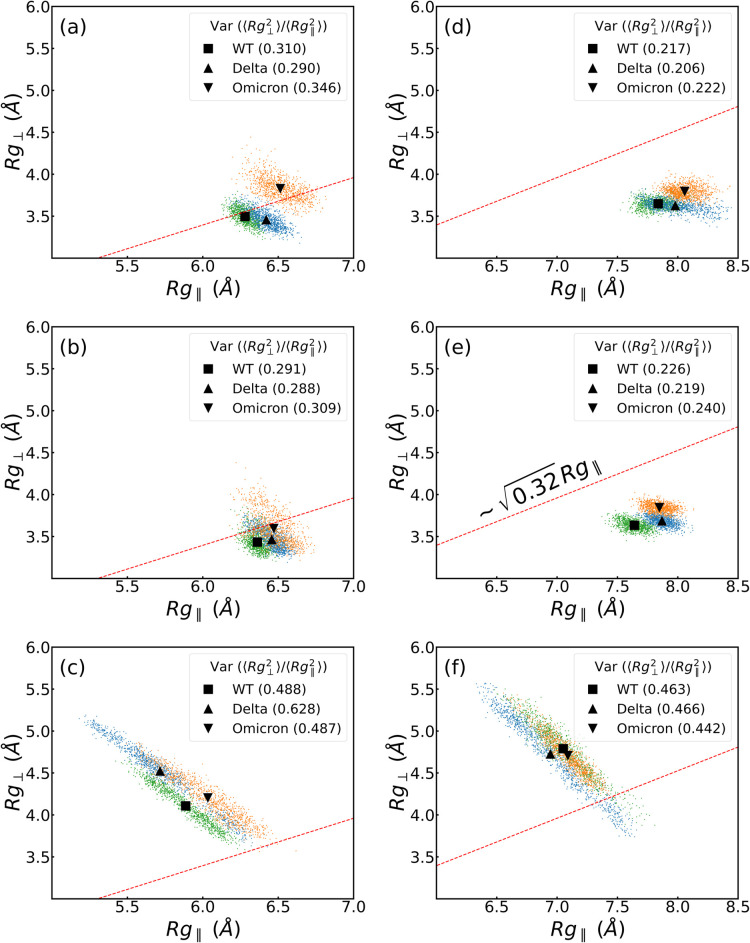
ratio is shown for each case.
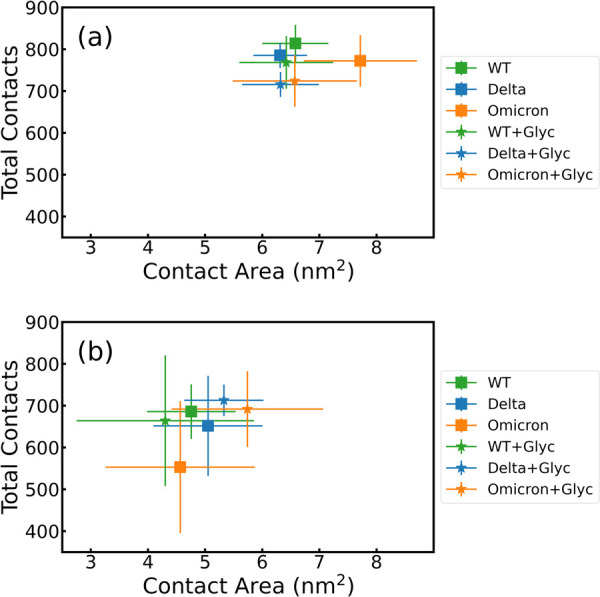
Figure 4
Figure 4
Total contacts per frame vs contact area between the RBDs of WT (green), Delta (blue), and Omicron (orange) and the (a) hydrophobic (PBL0) and (b) hydrophilic (PBL1) surfaces. Squares are the mean over the whole trajectory of RBD-PBLs, and stars are the mean values over the whole trajectory of the RBD-PBLs with glycan simulations. Error bars show the standard deviation over time.
Figure 5
Figure 5
Residue contact histograms between RBDs and (a–d) PBL0 and (e–h) PBL1 for (a,e) WT, (b,f) Delta, and (c,g) Omicron variants. Note that the mutated residues referenced to the WT are colored in fuchsia, and the legs of the RBD are highlighted by color in each region, green (left leg, group 1), and orange (right leg, group 2). (d,h) Contact histogram of the carbohydrates of the glycan to the hydrophobic and hydrophilic surfaces, respectively, in the rotated RBD-PBLs with glycan simulations. Glycan residues 193-BGLCNA and 194-AFUC have been excluded since they do not have contacts with the PBLs.
Figure 6
Figure 6
Center of mass distance of the residues of (a,b) WT and (g,h) Omicron RBDs to the hydrophobic substrate of the top 5 residues with most contacts with the (a,g) hydrophobic substrate and (b,h) ACE2. Legends show the residue IDs, the residue names, and the total contacts over the trajectory of each ranked residue (format: ResID (ResName) TotalContacts). The visualization of residue loci for each case is also shown at the bottom of (d,e) for WT-PBL0 and (g,h) for Omicron-PBL0, with colors corresponding to the distance plots (a,b,g,h). The minimum distance between the glycan and the substrate on the hydrophobic surface in the vertical and rotated configurations for (c) WT-PBL0 and (i) Omicron-PBL0. In (f,l), Glycan is shown in red. Note that all snapshots were taken from a bottom perspective. Complementary at the top of (a,b,g,h), we present contour-line plots showing the top 10 residues with most contacts with the (g) hydrophobic substrate and (h) ACE2. Note that in the contour-line plots, the color code of the top 5 corresponds to residue distance plots on their left side, the remaining 5 are depicted in black color.
Figure 7
Figure 7
Average distance of the two regions of the RBDs, the left leg in green (group 1) and the right leg in orange (group 2) for the (a–c) hydrophobic and (d–f) hydrophilic surfaces. Variants are ordered as WT, Delta, and Omicron from top to bottom, i.e., (a,d) for WT, (b,e) for Delta, and (c,f) for Omicron. Insets are a zoom of the trajectory from 150 to 300 ns.
Figure 8
Figure 8
Residues with an average center of mass-surface distance smaller than or equal to 6 Å in (a,c) and 10 Å in (b,d). (a,b) correspond to simulations with a hydrophobic surface and (c,d) correspond to a hydrophilic surface. Note that all the distances plotted here are average distances of the total trajectory, excluding the first 100 ns, and distance values larger than 15 Å.
Figure 9
Figure 9
H-bonds of residues with hydrophilic surfaces for (a) WT, (b) Delta, and (c) Omicron. A scatter plot shows the location of all centers of mass of hydrophilic residues that have H-bonds with the surface from a top view. Circles represent the percentage of the trajectory in which each residue has H-bonds. Scatter colors vary according to the ranking of this percentage. In the legend, in parentheses next to the ResIDs and residue names, the percentage of time with H-bonds is shown for each residue. Note that all plots here include the contour-line plots.
Figure 10
Figure 10
(a–c) Crook-handle formation in group 1 in the presence of a hydrophobic surface. In red, the loci of the C-alpha atoms corresponding to the residues 151, 152, 154, and 155 are represented; in green is residue 153, which mutates from WT to Omicron. Residue 153 is part of the crook-handle, forming a hydrophobic pocket in Omicron. (d) Mean C-alpha atom distance between residues 151-GLY and 155-PHE over each 15 ns, dpocket, which is depicted in (e). Colored shadows represent the standard error over these 15 ns. Note that the perimeter of the crook-handle from residue 151-GLY to 155-PHE was 15.3 ± 0.1 Å for all variants. In Omicron, a breathing mechanism is promoted [see in (c) that at 126 ns closed state and open at 150 ns] due to the attraction of 153-ALA to the hydrophobic surface. The adsorption of 153-ALA into PBL0 forces 154-GLY to be reoriented to the 149-CYS direction for geometrical reasons.

Similar articles

Cited by

References

    1. Wrapp D.; Wang N.; Corbett K. S.; Goldsmith J. A.; Hsieh C.-L.; Abiona O.; Graham B. S.; McLellan J. S. Cryo-EM structure of the 2019-nCoV spike in the prefusion conformation. Science 2020, 367, 1260–1263. 10.1126/science.abb2507. - DOI - PMC - PubMed
    1. Yan R.; Zhang Y.; Li Y.; Xia L.; Guo Y.; Zhou Q. Structural basis for the recognition of SARS-CoV-2 by full-length human ACE2. Science 2020, 367, 1444–1448. 10.1126/science.abb2762. - DOI - PMC - PubMed
    1. Walls A. C.; Park Y.-J.; Tortorici M. A.; Wall A.; McGuire A. T.; Veesler D. Structure, function, and antigenicity of the SARS-CoV-2 spike glycoprotein. Cell 2020, 181, 281–292.e6. 10.1016/j.cell.2020.02.058. - DOI - PMC - PubMed
    1. Bar-On Y. M.; Flamholz A.; Phillips R.; Milo R. Science Forum: SARS-CoV-2 (COVID-19) by the numbers. eLife 2020, 9, e5730910.7554/elife.57309. - DOI - PMC - PubMed
    1. Shang J.; Ye G.; Shi K.; Wan Y.; Luo C.; Aihara H.; Geng Q.; Auerbach A.; Li F. Structural basis of receptor recognition by SARS-CoV-2. Nature 2020, 581, 221–224. 10.1038/s41586-020-2179-y. - DOI - PMC - PubMed

Substances

Supplementary concepts

LinkOut - more resources