. 2024 Dec 2;14(12):2387-2406.
doi: 10.1158/2159-8290.CD-24-0046.

Identification and Characterization of Chemotherapy-Resistant High-Risk Neuroblastoma Persister Cells

Affiliations

Identification and Characterization of Chemotherapy-Resistant High-Risk Neuroblastoma Persister Cells

Liron D Grossmann et al. Cancer Discov. .

Abstract

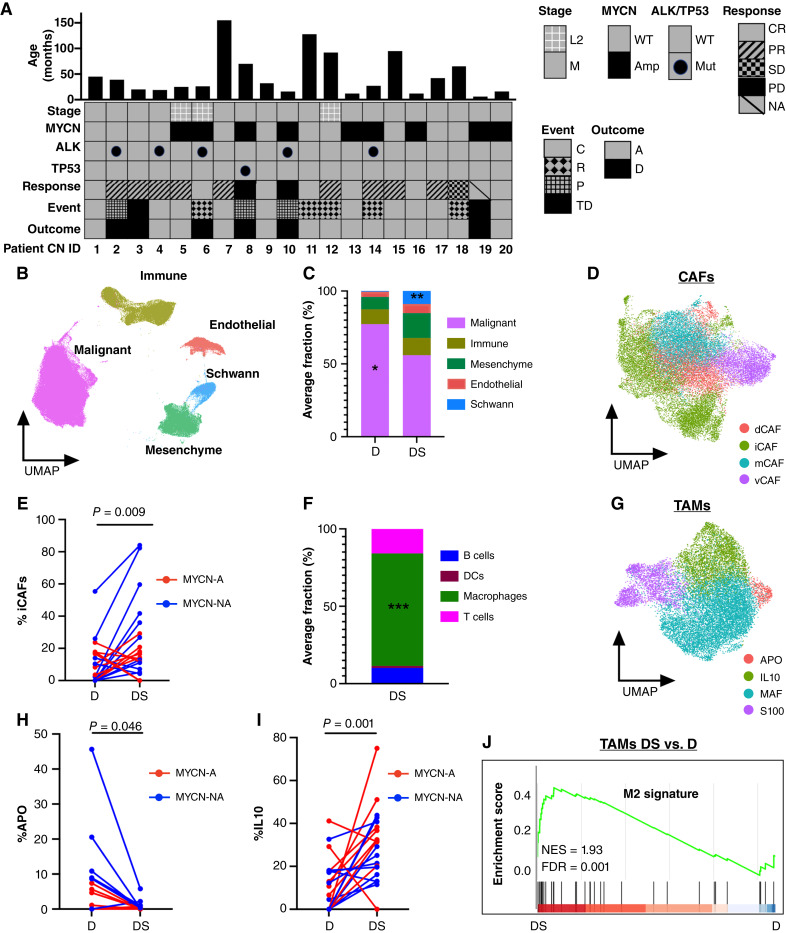
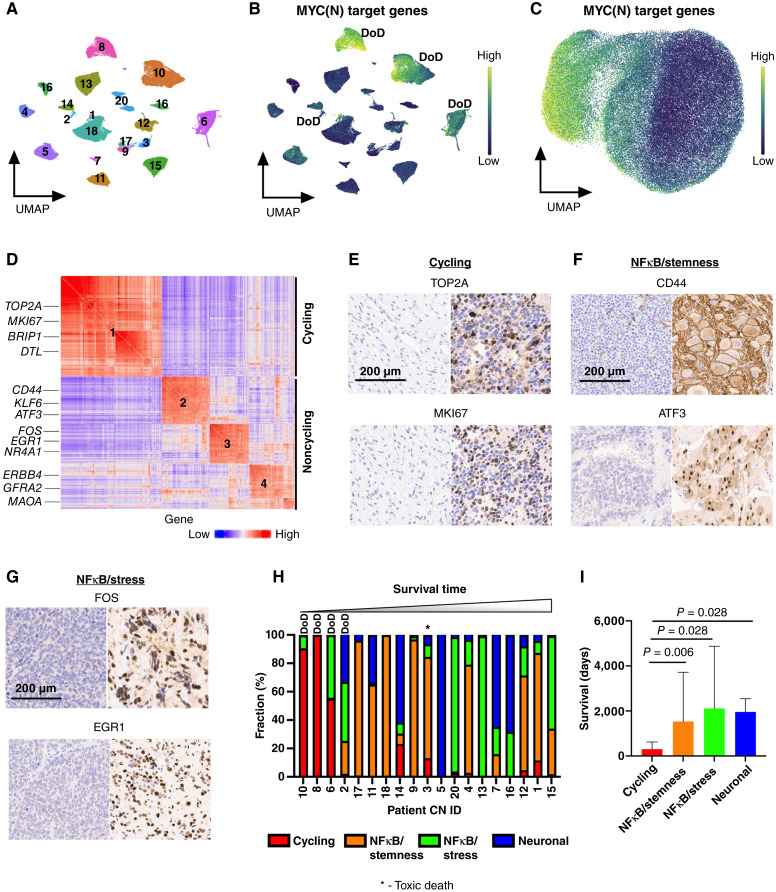
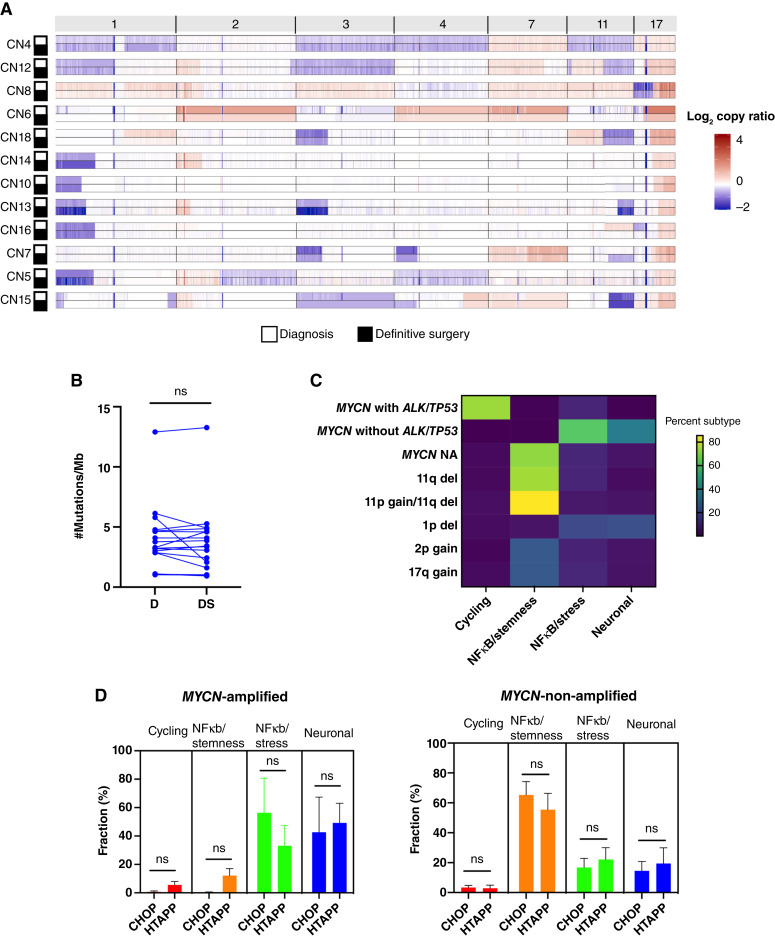
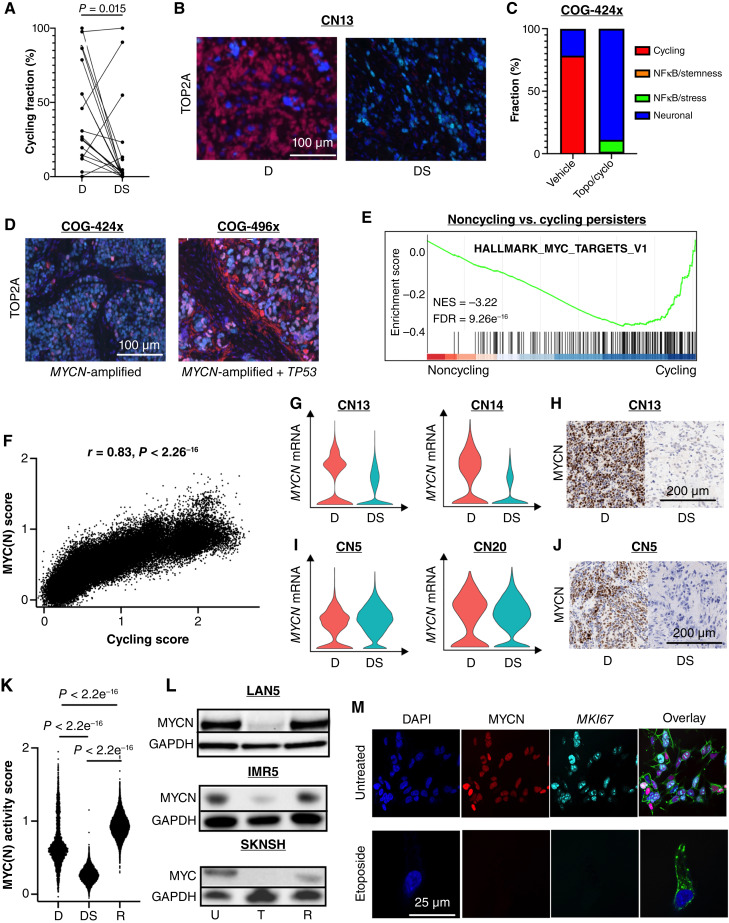
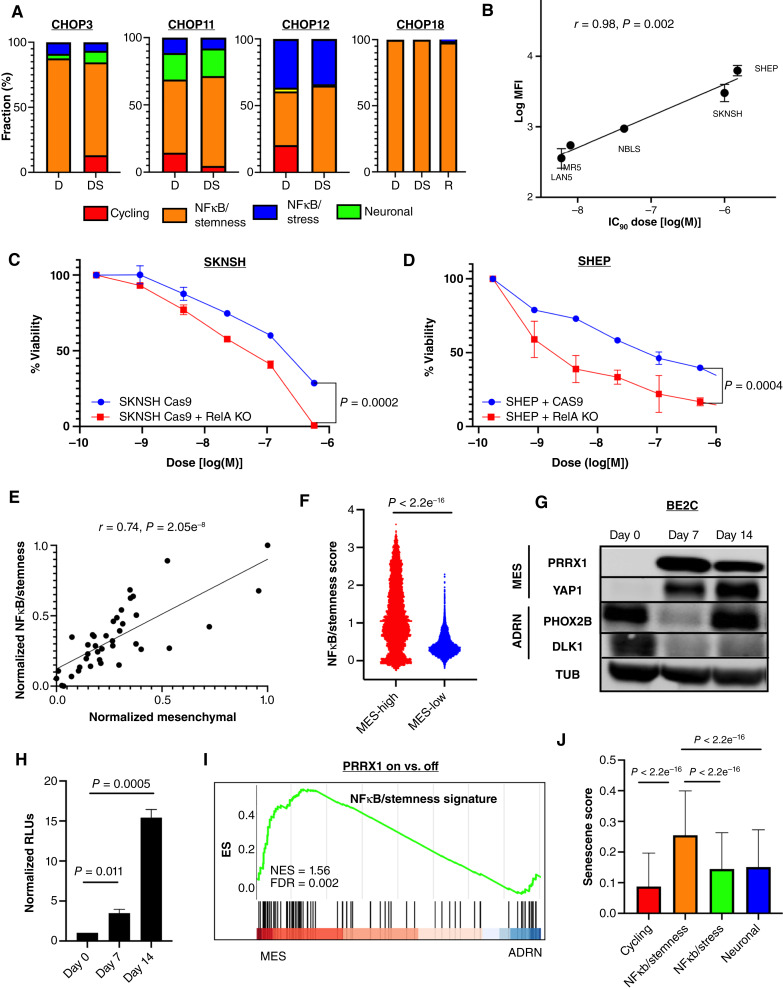
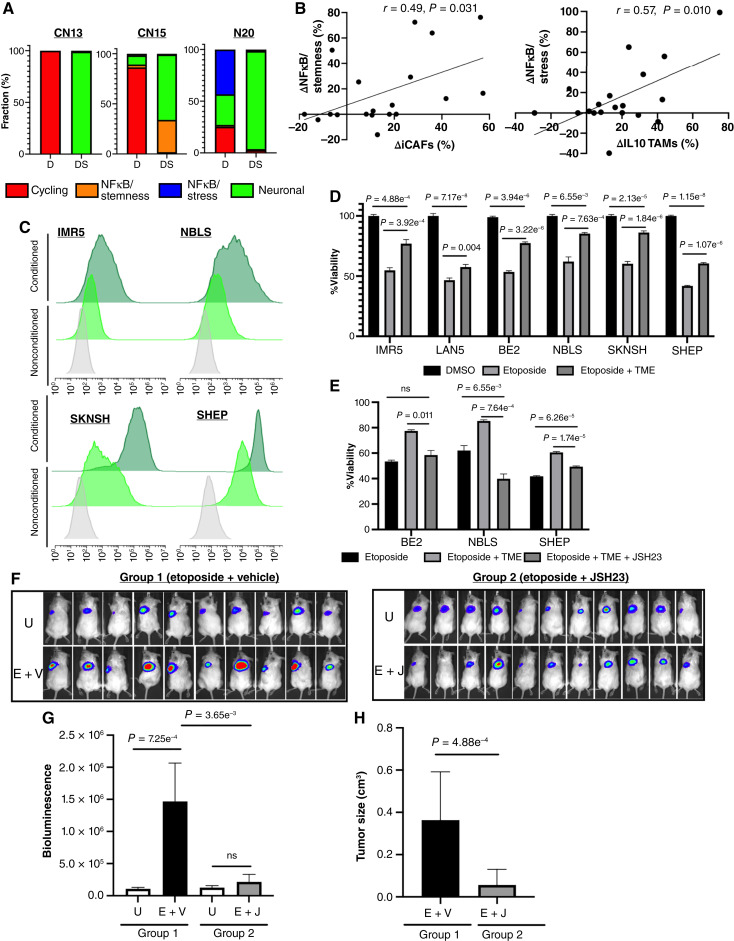
Relapse rates in high-risk neuroblastoma remain exceedingly high. The malignant cells that are responsible for relapse have not been identified, and mechanisms of therapy resistance remain poorly understood. In this study, we used single-nucleus RNA sequencing and bulk whole-genome sequencing to identify and characterize the residual malignant persister cells that survive chemotherapy from a cohort of 20 matched diagnosis and definitive surgery tumor samples from patients treated with high-risk neuroblastoma induction chemotherapy. We show that persister cells share common mechanisms of chemotherapy escape, including suppression of MYC(N) activity and activation of NFκB signaling, and the latter is further enhanced by cell-cell communication between the malignant cells and the tumor microenvironment. Overall, our work dissects the transcriptional landscape of cellular persistence in high-risk neuroblastoma and paves the way to the development of new therapeutic strategies to prevent disease relapse. Significance: Approximately 50% of patients with high-risk neuroblastoma die of relapsed refractory disease. We identified the malignant cells that likely contribute to relapse and discovered key signaling pathways that mediate cellular persistence. Inhibition of these pathways and their downstream effectors is postulated to eliminate persister cells and prevent relapse. See related commentary by Wolf et al., p. 2308.


Conflict of interest statement

No disclosures were reported by the authors.

Figures

Figure 1.
Figure 1.
Chemotherapy remodels the cellular composition of neuroblastoma tumors. A, Patients characteristics of a paired matched cohort of 20 patients with high-risk neuroblastoma at diagnosis and surgical resection. Response was determined at the end of induction therapy, typically after 1–2 additional cycles of chemotherapy following definitive surgery. B, Uniform Manifold Approximation and Projection for Dimension (UMAP) of 248,591 nuclei integrated from diagnostic and surgical specimens from 20 patients with high-risk neuroblastoma showing the main cellular components of tumors. C, Stacked bar plot of average percent of cell type at diagnosis and definitive surgery. Malignant cells showed a statistically significant decrease (P = 0.013; paired Wilcoxon test) whereas Schwann cells demonstrated a statistically significant increase (P = 0.006; paired Wilcoxon test) at definitive surgery. D, UMAP of CAFs annotated according to recently identified CAF subtypes (30). E, Connected pairs plot showing the percent of relative iCAFs at diagnosis and definitive surgery in 20 tumor pairs. Lines are colored by MYCN amplification status. F, Stacked bar plot of average percent of immune cell types at definitive surgery (P = 2.96e−05; Wilcoxon test). G, UMAP of TAMs annotated according to recently identified neuroblastoma TAM subtypes (17). H, Connected pairs plot showing the percent of relative APO TAMs (APO) at diagnosis and definitive surgery in 20 tumor pairs. I, Connected pairs plot showing the percent of relative IL10 TAMs (iL10) at diagnosis and definitive surgery in 20 tumor pairs. J, Gene set enrichment analysis (GSEA) analysis of DEGs between TAMs at definitive surgery and diagnosis shows enrichment for M2 signatures (15). *, P < 0.05; **, P < 0.01; ***, P < 0.001. A, laive; AMP, amplified (red) ; C, censor; CR, complete remission; D, death; DS, definitive surgery; D, diagnosis; M, metastatic; MUT, mutated; NES, normalized enrichment score; NA; not amplified (blue); NA, not available (patient died before end of induction response evaluation); NS, not significant; P, progression; PD, progressive disease; PR, partial response; R, relapse; SD, stable disease; TD, toxic death; WT, wildtype.
Figure 2.
Figure 2.
Pathway-based clustering identifies four persister cell subtypes. A, UMAP of 86,901 persister nuclei from 38 surgical resection specimens. Specimens from the same patient cluster together. Numbers correspond to patient CN sample ID. B, UMAP showing the score of MYC(N) target genes [MYC(N) activity] for each persister nucleus. Yellow, high score; dark blue, low score. Three of four patients with high MYC(N) activity at time of definitive surgery died of their disease, with two patients experiencing progressive disease (CN8 and CN10), and one experiencing relapse (CN6). DoD, dead of disease. C, UMAP showing 86,901 persister nuclei clustered according to the pathway-based clustering algorithm using the top 9 most autocorrelated pathways (C > 0.5; FDR < 0.01; see “Methods” for definition of C), here with MYC(N) target genes pathway score shown. Yellow – high score, dark blue – low score. D, Gene to gene (426 genes × 426 genes) correlation heatmap. Rows and columns corresponding to the genes in the meta-modules identified by Hotspot. Red, high correlation; blue, low correlation. Meta-modules were annotated using cell-cycle and pathway enrichment analyses and are numbered as follows: 1–cycling, 2–NFκB/stemness, 3– NFκB/stress, and 4–neuronal. Genes enriched in each meta-module are depicted on the left. E, IHC staining for TOP2A and MKI67, two markers of cycling persister meta-module (#1), of a tumor with low frequency of cycling persister cells at time of definite surgery (left) and tumor with high frequency of cycling persister cells obtained from patient CN8 (right). F, IHC staining for CD44 and ATF3, two markers of the NFκB/stemness meta-module (#2), of a tumor with high NFκB/stemness cells at time of definite surgery obtained from patient CN9. G, IHC staining for FOS and EGR1, two markers of the NFκB/stress meta-module (#3), of a tumor with high NFκB/stress cells at time of definite surgery obtained from patient CN13. H, Bar plot of persister subtypes fraction of 19 surgical specimens (CN19 had no malignant nuclei identified at the time of definitive surgery) ordered in increasing order of the corresponding patients’ survival times. I, Bar plot of patients’ survival times with corresponding tumors assigned to the most abundant persister subtypes. The malignant nuclei of definitive surgery specimens from each patient were decomposed into persister subtypes as in H, and each tumor was classified according to its most abundant persister subtype. The patients’ survival times were then assigned to the corresponding tumors.
Figure 3.
Figure 3.
Persister cell phenotype is shaped by genetic alterations present at diagnosis. A, Heatmap of log2 copy ratio of chromosomes 1, 2, 3, 4, 7, 11, and 17 for 11 matched pairs with malignant cells percentage at diagnosis and definitive surgery sufficient to identify reliable copy number. Red, gain; blue, loss. B, Connected pairs plot showing the mutational burden, measured as the number of mutations per Mb, in 17 matched pairs at diagnosis and definitive surgery. C, Heatmap of median percent persister subtype fraction as a function of genetic alterations at diagnosis. del - deletion, NA - Non-Amplified. D, Bar plots of persister subtypes percentages for the CHOP and HTAPP cohorts in MYCN-amplified tumors (left) and -non-amplified tumors (right). Plots do not include tumors with MYCN amplification and TP53/ALK (N = 3, CHOP cohort). A, Amplified; NA, non-amplified; del, deletion; D, diagnosis; DS, definitive surgery; HTAPP, Human Tumor Atlas Pilot Project; ns, not significant.
Figure 4.
Figure 4.
Noncycling persister cells suppress MYC(N) activity. A, Connected pairs plot showing the decrease in percentage of cycling persister subtype at diagnosis and definitive surgery in 19 matched pairs. B, Dual IF staining for the cycling marker, TOP2A (red), and neuroblastoma marker, PHOX2B (turquoise), at diagnosis and definitive surgery in a MYCN-amplified tumor of patient CN13. Blue represents DAPI nuclear staining. C, Bar plot of persister subtypes decomposition from tumors obtained from a PDX model with MYCN-amplification (COG-424x) before and after treatment with two cycles of topotecan and cyclophosphamide. D, Dual IF staining for the cycling marker, TOP2A (red), and neuroblastoma marker, PHOX2B (turquoise), in two PDX models, one with MYCN amplification (COG-424x; left) and one with MYCN amplification and TP53 mutation (COG496x; right). Blue represents DAPI nuclear staining. E, Gene set enrichment analysis (GSEA) of DEGs between noncycling and cycling persister cells. F, Pearson correlation between MYC(N) activity score and cycling persister subtype scores (meta-module #1). G, Violin plots for MYCN mRNA expression in the malignant cells of MYCN-amplified tumors obtained from patients CN13 and CN14 at diagnosis and definitive surgery. H, IHC staining for MYCN protein in tumors obtained from patient CN13 at diagnosis and definitive surgery. I, Violin plots for MYCN mRNA expression in the malignant cells of MYCN-amplified tumors obtained from patients CN5 and CN20 at diagnosis and definitive surgery. J, IHC staining for MYCN protein in tumors obtained from patient CN5 at diagnosis and definitive surgery. K, Violin plots of MYC(N) activity scores of the malignant cells of a tumor obtained from a patient with an intermediate-risk neuroblastoma with high-risk features at diagnosis, definitive surgery, and relapse. L, Western blots for MYCN and MYC proteins of two MYCN-amplified cell lines (LAN5 and IMR5) and a MYCN-non-amplified, MYC overexpressing cell line (SKNSH) before treatment, at the end of treatment with etoposide, and at regrowth after 3 weeks. M, Dual IF staining for MYCN (red) and MKI67 (turqoise) of LAN5 prior to treatment (top) and at the end of treatment with etoposide (bottom). Blue represents DAPI nuclear staining. Green represents phalloidin staining for actin. D, diagnosis; DS, definitive surgery; U, untreated; T, treated with etoposide; R, regrowth.
Figure 5.
Figure 5.
Constitutive NFκB activation mediates cellular persistence. A, Bar plots of persister subtypes percent of three tumors obtained from three patients (CN3, CN11, and CN12) at diagnosis and definitive surgery and a tumor obtained from one patient (CN18) at diagnosis, definitive surgery, and relapse. B, Scatter plot showing NFκB basal activity, measured as the log of the median fluorescence intensity (MFI), in five cell lines as a function of their corresponding IC90 dose of topotecan. C, Dose–response curve of cell viability plot as a function of etoposide dose (log scale) for SKNSH (left) with and without RelA CAS9-CRISPR knockout. D, Dose–response curve of cell viability plot as a function of etoposide dose (log scale) for SHEP with and without RelA CAS9-CRISPR knockout. E, Scatter plot showing the NFκB/stemness score as a function of the mesenchymal score in 39 neuroblastoma cell lines (46). F, Violin plots of NFκB/stemness score in persister nuclei with high mesenchymal and reduced adrenergic scores vs. persister nuclei with low mesenchymal and high adrenergic scores. G, Western blot of mesenchymal and adrenergic markers in an adrenergic cell line, BE2C, with doxycycline-inducible PRRX1 expression along the transdifferentiation trajectory. Day 0 is day of doxycycline administration, and day 14 represents the end of assay. H, NFκB luciferase activity, measured as the relative luminescence, following induction of PRRX1 expression in BE2C. I, GSEA of DEGs between PRRX1-transduced and -untransduced BE2 and KPNYN (47) J, Senescence signature (50) scores of the persister nuclei classified according to the four persister subtypes. ADRN, adrenergic; D, diagnosis; DS, definitive surgery; MES, mesenchymal; MFI, median fluorescence intensity; ns, not significant.
Figure 6.
Figure 6.
Multiple signals trigger NFκB activation in persister cells. A, Bar plots of persister subtypes percent of three tumors obtained from patients (CN13, CN15, and CN20) at diagnosis and definitive surgery. B, Scatter plots showing the relative changes in percentage of NFκB/stemness from diagnosis to definitive surgery (left) and relative changes in percentage of NFκB/stress (right) from diagnosis to definitive surgery as a function of the relative changes in iCAFs and IL10 TAMs percentages from diagnosis to definitive surgery, respectively. C, Flow cytometry histograms for the GFP (FITC) reporter under NFκB consensus sequence in MYCN-amplified or overexpressing neuroblastoma cell lines (IMR5 and NBLS; top) and MYCN-non-amplified neuroblastoma cell lines (SKNSH and SHEP; bottom) in standard medium and conditioned medium (CM). Grey, untransduced cell line, standard medium; light green, GFP-transduced cell line, standard medium; dark green, GFP-transduced cell line, CM. D, Bar plots of cell viability of six neuroblastoma cell lines, three MYCN-amplified (IMR5, LAN5, and BE2) and three MYCN-non-amplified (NBLS, SKNSH, and SHEP,) treated with etoposide (100 nmol/L for IMR5, LAN5, and BE2 and 1 µmol/L for NBLS, 5 µmol/L for SKNSH, and 10 µmol/L for SHEP) for 3 days in standard medium and in the presence of CM from neuroblastoma, TAMs, and CAFs triple cocultures. E, Bar plots of cell viability of three neuroblastoma cell lines, BE2, NBLS, and SHEP, treated with etoposide for 3 days as above in standard medium and in the presence of CM from triple cocultures with and without the NFκB nuclear translocation inhibitor JSH-23 (1 µmol/L for BE2, 35 µmol/L for NBLS, and 100 µmol/L for SHEP). F, Bioluminescence images of NOD/SCID gamma mice arms which were subcutaneously implanted with BE2-LUC neuroblastoma cells in the presence of human TAMs and CAFs (TME) treated with etoposide + vehicle (E + V; group 1) or etoposide + JSH-23 (E + J; group 2). Top, untreated in each group. G, Bar plots of bioluminescence levels of untreated mice in each group and treated mice (E + V; group 1 and E + J; group 2). H, Bar plots of tumor size in of treated mice (E + V; group 1 and E + J; group 2). D, diagnosis; DS, definitive surgery; U, untreated.

References

    1. Matthay KK, Maris JM, Schleiermacher G, Nakagawara A, Mackall CL, Diller L, et al. . Neuroblastoma. Nat Rev Dis Primers 2016;2:16078. - PubMed
    1. Norris MD, Bordow SB, Marshall GM, Haber PS, Cohn SL, Haber M. Expression of the gene for multidrug-resistance-associated protein and outcome in patients with neuroblastoma. N Engl J Med 1996;334:231–8. - PubMed
    1. Eleveld TF, Oldridge DA, Bernard V, Koster J, Colmet Daage L, Diskin SJ, et al. . Relapsed neuroblastomas show frequent RAS-MAPK pathway mutations. Nat Genet 2015;47:864–71. - PMC - PubMed
    1. Schramm A, Köster J, Assenov Y, Althoff K, Peifer M, Mahlow E, et al. . Mutational dynamics between primary and relapse neuroblastomas. Nat Genet 2015;47:872–7. - PubMed
    1. Boeva V, Louis-Brennetot C, Peltier A, Durand S, Pierre-Eugène C, Raynal V, et al. . Heterogeneity of neuroblastoma cell identity defined by transcriptional circuitries. Nat Genet 2017;49:1408–13. - PubMed

MeSH terms