. 2024 Dec 2;14(12):2407-2429.
doi: 10.1158/2159-8290.CD-24-0190.

Botensilimab, an Fc-Enhanced Anti-CTLA-4 Antibody, Is Effective against Tumors Poorly Responsive to Conventional Immunotherapy

Affiliations

Botensilimab, an Fc-Enhanced Anti-CTLA-4 Antibody, Is Effective against Tumors Poorly Responsive to Conventional Immunotherapy

Dhan Chand et al. Cancer Discov. .

Abstract

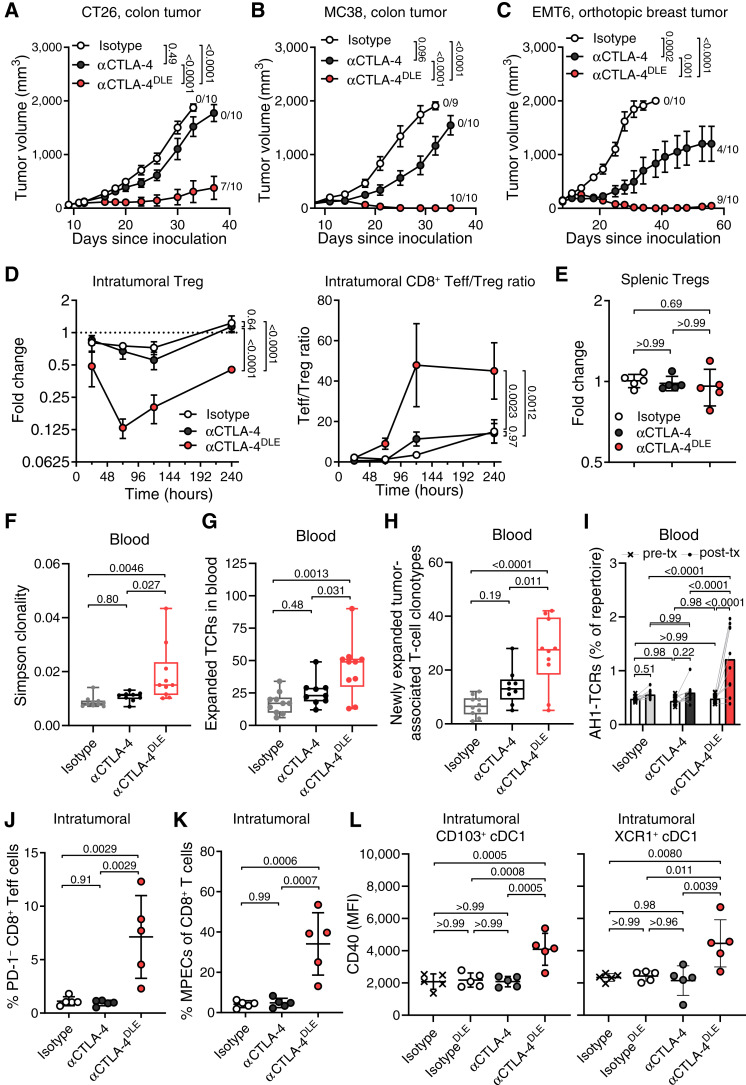
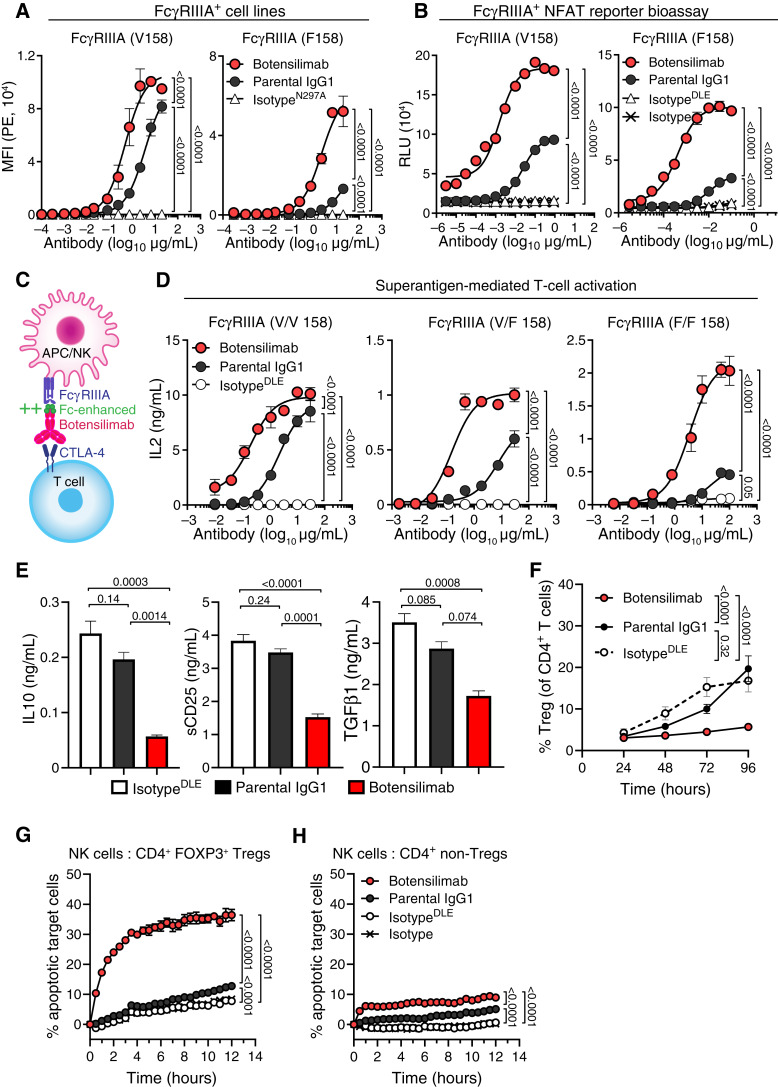
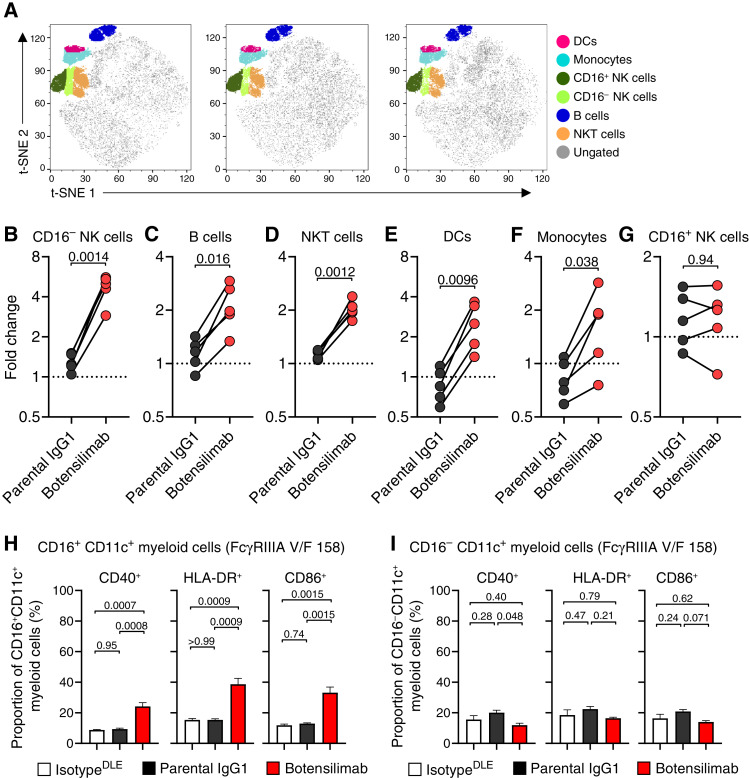
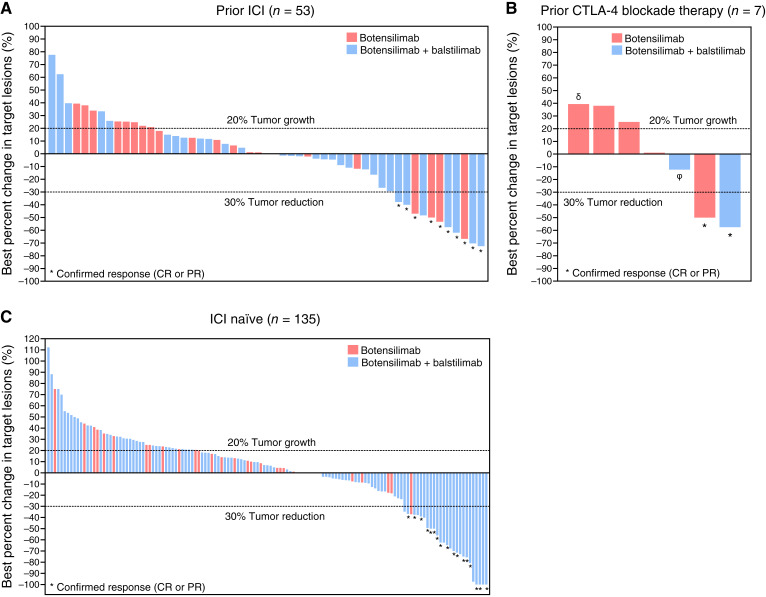
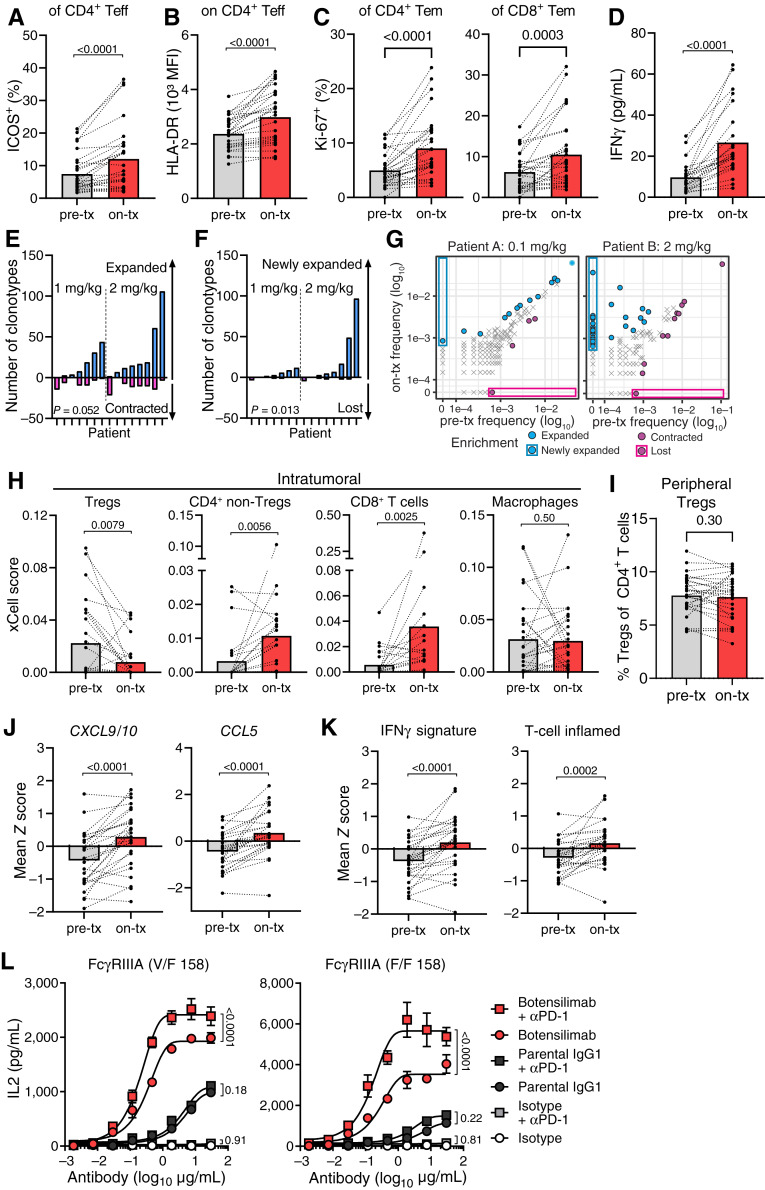
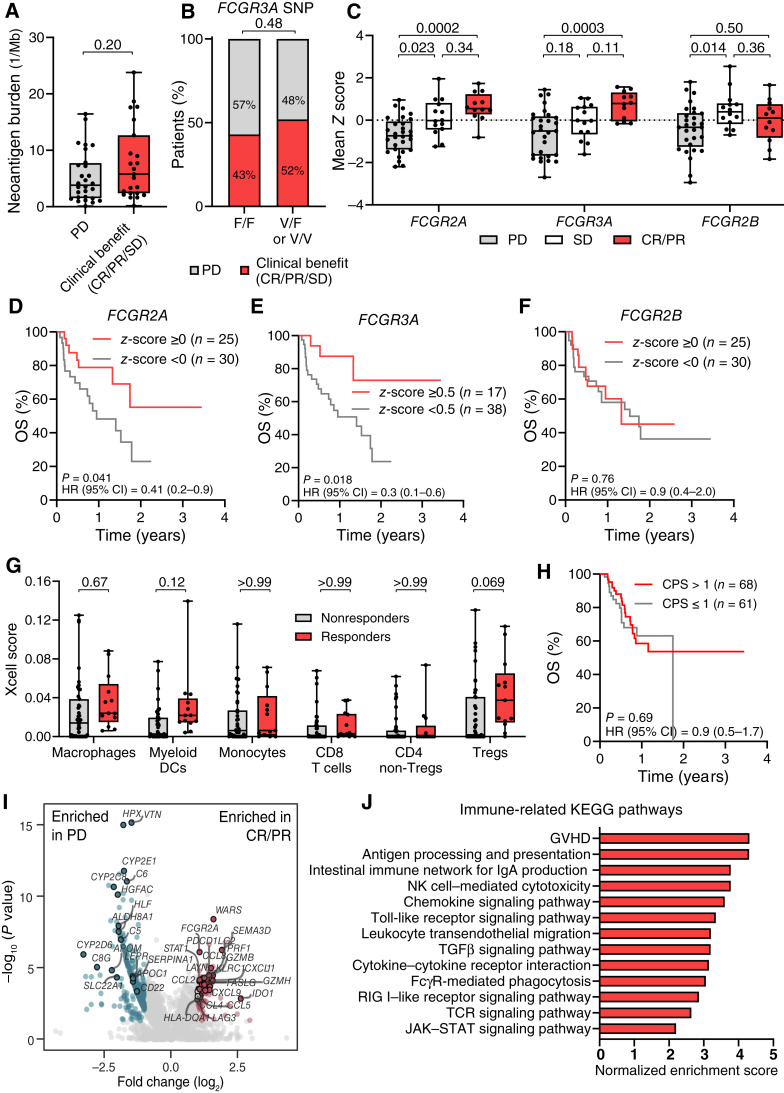
This study reveals that Fc-enhanced anti-CTLA-4 harnesses novel mechanisms to overcome the limitations of conventional anti-CTLA-4, effectively treating poorly immunogenic and treatment-refractory cancers. Our findings support the development of a new class of immuno-oncology agents, capable of extending clinical benefit to patients with cancers resistant to current immunotherapies.


Conflict of interest statement

C. Delepine reports employment with Agenus Inc and ownership of stocks of the company. A. Tanne reports employment with and being a share holder of Agenus Inc at the time he worked on this project. H. Han reports grants from Agenus Inc during the conduct of the study. S. Bourdelais reports other support from Agenus Inc outside the submitted work. J.D. Waight reports personal fees from Agenus Inc during the conduct of the study. A. Sebastin-Yague reports personal fees from Agenus Inc and MiNK Therapeutics outside the submitted work. A. Slee reports employment with Agenus Inc. J.E. Grossman reports other support from Agenus Inc during the conduct of the study. N.S. Wilson reports a patent for https://patents.google.com/patent/US11013802B2/en issued and a patent for https://patents.google.com/patent/US10323091B2/en issued. D.D. Von Hoff reports grants from Agenus Inc during the conduct of the study; other support from multiple entities outside the submitted work; and being a consultant for Agenus Inc in the past but not currently when he worked on this project. J. Stebbing reports other support from Agenus Inc from 2022 till date during the conduct of the study; being editor-in-chief in Oncogene; being on SABs/advisory boards for Eli Lilly and Company, Agenus Inc, Celltrion, Greenmantle, vTv Therapeutics, APIM, Onconox, IO Labs, Clinical ink, Zephyr AI, BenevolentAI, Biozen, Pear Bio, Sable Bio, and LinkGevity; receiving consulting fees from Lansdowne Partners and Vitruvian; being a board member for Graviton Bioscience BV, etira Therapeutics, and Portage; and being on the board of BB Biotech Healthcare Trust PLC previously. T.J. Curiel reports personal fees and other support from Agenus Inc during the conduct of the study. R.B. Stein reports personal fees from Agenus Inc during the conduct of the study; personal fees from Samsara Biocapital, ImmunoGenesis, Flame Biosciences, PolyPid, MiroBio, Caliper Life Sciences, Codify Therapeutics, XOMA, The Ohio State University DDI, Washington University School of Medicine in St. Louis, and MiNK Therapeutics outside the submitted work; and a patent for Checkpoint Modulator Antibodies pending. No disclosures were reported by the other authors.

Figures

Figure 1.
Figure 1.
αCTLA-4DLE promotes superior antitumor immunity in tumor-bearing mouse models. Tumor growth in BALB/C mice bearing (A) subcutaneous CT26 tumors (n = 10 mice/group), (B) C57BL/6 mice bearing MC38 tumors (n = 9–10 mice/group), and (C) orthotopic EMT6 breast tumors (n = 10 mice/group) treated intraperitoneally with indicated antibodies. Fractions to the right of curves in A–C are CR over total tumor number. D, FOXP3+ Tregs relative to vehicle (dashed line) and tumor CD8+ Teff to Treg ratio, and (E) fold-change splenic FOXP3+ Tregs relative to isotype 72 hours posttreatment (n = 5 mice/time point) in CT26-bearing BALB/C mice treated with indicated antibodies. F, Changes in blood TCR Simpson clonality index, (G) expanded TCR clones in blood from pre- to posttreatment, (H) number of newly expanded tumor-associated T-cell clonotypes, and (I) total frequency of tumor-specific AH1 TCR clones in blood pretreatment (pre-tx) vs. posttreatment (post-tx) in CT26-bearing BALB/C mice (n = 9–10 mice/group) treated with indicated antibodies on days 0, 3, and 6. Pretreatment Blood samples and blood and tumor collected 11 days after initial dose. J, Percent intratumoral CD8+ Teff and (K) CD8+ MPECs by flow cytometry 10 days posttreatment in CT26-bearing BALB/C mice (n = 5 mice/group). L, CD40 mean fluorescence intensity (MFI) of intratumoral CD103+ or XCR1+ type 1 cDC1 in CT26-bearing BALB/C mice (n = 5/group) treated once with indicated antibodies. Tumors evaluated by flow cytometry 7 days posttreatment. Data represented as mean ± SEM (A–D) and mean ± SD (E and J–L). In box plots, center line, median; box limits, 25th and 75th percentile; whiskers, minimum and maximum values. Data analyzed by mixed-effects models with matched data (AC) or two-way ANOVA (D and I) followed by the Tukey multiple comparisons test or one-way ANOVA followed by the Kruskal–Wallis test with Dunn correction (E–H and J–L).
Figure 2.
Figure 2.
Botensilimab enhances T-cell responsiveness independent of FcγRIIIA allele status and reduces Treg frequency. A, Binding of botensilimab, IgG1 variant of botensilimab (parental IgG1), or aglycosylated IgG1N297A isotype negative control antibody to CHO cells expressing FcγRIIIA V158 or F158 by flow cytometry. MFI, mean fluorescence intensity. B, Signaling through FcγRIIIA V158 and FcγRIIIA F158 in Jurkat cells expressing FcγRs upstream of an NFAT-dependent luciferase reporter, cocultured with CTLA-4–expressing cells and botensilimab, parental IgG1, IgG1DLE isotype, or IgG1 isotype. Luciferase expression shown as relative light units (RLU). C, Schematic depicting botensilimab binding to CTLA-4–expressing T cells and coengaging FcγRIIIA-expressing APC or (NK cells to create an immune synapse). D, IL2 secretion from SEA-stimulated healthy donor PBMC from FcγRIIIA homozygote V/V 158, FcγRIIIA heterozygote V/F 158, and FcγRIIIA homozygote F/F 158 donors treated with botensilimab, parental IgG1, or IgG1DLE isotype. E, IL10, soluble CD25 (sCD25), and TGFβ1 secretion from SEA-stimulated PBMC treated with 5 μg/mL botensilimab, parental IgG1, or IgG1DLE. FcγRIIIA heterozygote V/F 158 donor shown. F, Treg (CD3+CD4+CD25+FOXP3+) frequencies from SEA-stimulated healthy donor PBMCs treated with 5 μg/mL of botensilimab, parental IgG1, or IgG1DLE by flow cytometry (n = 4 donors). G, Dye-labeled and caspase 3/7–stained primary CD4+FOXP3+ Tregs or (H) conventional CD4+ T cells cocultured at a 1:1 ratio with FcγRIIIA-expressing NK-92 cells treated with indicated antibodies. Values measured by live imaging using confocal microscopy (n = 3). Data are represented as mean ± SEM (A, B, and D–G). Data analyzed by two-way ANOVA (A, B, D, and F–H) or one-way ANOVA (E), all followed by the Tukey multiple comparisons test.
Figure 3.
Figure 3.
Botensilimab enhances the frequency of activated myeloid, NK, B, and NKT cells. A, Global t-distributed stochastic neighbor embedding (t-SNE) maps of total live immune cells (CD45+) after stimulation with SEA in the presence of 5 μg/mL botensilimab, parental IgG1, or IgG1DLE isotype. PBMC from five FcγRIIIA V/F 158 heterozygote healthy donors were used. Six phenotypically distinct clusters identified by individual phenotypic markers by flow cytometry within concatenated total live immune cells analyzed. Log2 fold changes in (B) CD16 NK, (C) B, (D) NKT, (E) DC, (F) monocyte, and (G) CD16+ NK cell counts in each immune cell cluster between samples treated with botensilimab and parental IgG1, compared with IgG1DLE isotype (n = 5/group; data are paired). H, Activated CD16+CD11c+ (I) and CD16CD11c+ myeloid cell frequency determined by CD40, HLA-DR, and CD86 expression by flow cytometry. Representative data from an FcγRIIIA V/F 158 heterozygote donor. Data are represented as mean ± SEM (H and I). Data analyzed with a two-tailed paired t test (B–G) or one-way ANOVA followed by a Tukey multiple comparisons test (H and I).
Figure 4.
Figure 4.
Clinical response to botensilimab monotherapy and combination with balstilimab in patients with advanced solid cancers. Waterfall plot of maximal percentage change from baseline in sum of tumor target lesion diameters for patients treated with botensilimab monotherapy or in combination with balstilimab (A) who progressed on prior ICI [αPD-(L)1 and/or αCTLA-4] therapy (n = 53), (B) received prior αCTLA-4 therapy [ipilimumab, QL1706 (a mixture of αPD-1 IgG4 and αCTLA-4 IgG1; δ) or ALPN-202 (a dual PD-L1/CTLA-4 blocker and CD28 costimulator; ϕ; n = 7], or (C) received no prior ICI therapy (n = 135). Only patients treated with 1, 2, 3 mg/kg, or 150 mg of botensilimab monotherapy (red bar) or in combination with 3 mg/kg or 450 mg balstilimab (blue bar) are shown. Tumor reduction was assessed according to RECIST 1.1 criteria. Lower dotted line demarcates tumor reduction of 30%. * Indicates confirmed responses as of March 27, 2023.
Figure 5.
Figure 5.
Botensilimab enhances activated T-cell prevalence, reduces intratumoral Tregs, and upregulates genes associated with T cell–inflamed tumors in patients with advanced solid cancers. A–G, Pretreatment (pre-tx) and on-treatment (on-tx) blood samples from patients treated with 1 or 2 mg/kg botensilimab monotherapy. PBMC analyzed by flow cytometry for the (A) frequency of ICOS+ and (B) HLA-DR mean fluorescence intensity (MFI) on CD4+ Teff (CXCR3+) and (C) frequency of Ki-67+ CD4 and CD8 effector memory (Tem, CD45RO+CCR7) T-cell subsets (n = 28; on-tx: 7 days after first dose). D, Plasma IFNγ in pre- and on-tx samples (n = 23; on-tx: 24 hours after first dose). Number of (E) expanded vs. contracted and (F) newly expanded vs. lost T-cell clonotypes in pre-tx vs. on-tx blood by differential abundance analysis between baseline (pre-tx; cycle 1 day 1) and 3–4 weeks postdose (n = 15; pre-tx: cycle 1 day 1; on-tx: 3–4 weeks after first dose). P values compare expanded vs. contracted T-cell clonotypes in E and F. G, T-cell clonotype abundance in two representative patients treated with 0.1 or 2 mg/kg botensilimab every 3 weeks. CDR3 sequencing of human TCRβ chains performed using immunoSEQ. H, Intratumoral cell type enrichment scores calculated using xCell for Tregs, CD4+ non-Tregs, CD8+ T cells, and macrophages as determined from RNA-seq of pre-tx and on-tx tumor biopsies from patients treated with 1 or 2 mg/kg botensilimab monotherapy every 3 or 6 weeks ± balstilimab every 2 weeks (n = 26; on-tx: cycle 2 day 1 for every 6-week cohort, or cycle 3 day 1 for every 3-week cohort). I, Percent peripheral Treg (CD4+, CD127low/−, CD25+) subsets (n = 28; on-tx: 7 days after first dose) analyzed by flow cytometry from patients treated with 1 or 2 mg/kg botensilimab monotherapy. J, Intratumoral CXCL9 and CXCL10 and CCL5 gene expression and (K) IFNγ and T cell–inflamed gene expression signatures (53) as determined from RNA-seq of pre-tx and on-tx tumor biopsies (n = 26). L, IL2 secretion from SEA-stimulated PBMC from FcγRIIIA heterozygote V/F 158 and FcγRIIIA homozygote F/F 158 donors treated with botensilimab, parental IgG1, or IgG1DLE isotype, alone ± αPD-1 (balstilimab). Paired data points with group mean (A–D and H–K) or mean ± SEM (L). Data analyzed with the two-tailed Wilcoxon matched-paired t test (A–F and H–K) or two-way ANOVA with the Tukey multiple comparisons test (L).
Figure 6.
Figure 6.
Clinical response to botensilimab is independent of neoantigen burden or FcγR polymorphism in patients with advanced solid cancers. Clinical benefit by (A) tumor neoantigen burden (TNB) at pretreatment and (B) FCGR3A genotype in patients treated with botensilimab monotherapy (TNB: n = 35; FCGR3A genotype: n = 33) or botensilimab plus balstilimab (TNB: n = 78; FCGR3A genotype: n = 71). PD, progressive disease. TNB by whole-exome sequencing with predicted HLA binding affinity <500 nmol/L (NetMHCpan). Clinical benefit defined as patients with CR, PR, or SD for ≥12 weeks per RECIST 1.1. C,FCGR2A, FCGR3A, and FCGR2B gene expression from pretreatment tumor biopsy by RNA-seq from patients treated with botensilimab monotherapy ± balstilimab (n = 55). Mean z-scores calculated from log2-scaled transcripts per million expression counts. Survival correlation with (D) FCGR2A, (E) FCGR3A, and (F) FCGR2B gene expression in pretreatment tumor biopsies. G, Intratumoral cell type fractions from pretreatment tumor biopsies by gene set enrichment analysis of bulk RNA-seq data by xCell. H, Kaplan–Meier survival by PD-L1 positivity by IHC using a CPS cutoff of 1 (n = 129). I, Volcano plot in which each dot represents one gene, and (J) immune-related Kyoto Encyclopedia of Genes and Genomes (KEGG) pathways enriched among differentially expressed genes between responders and patients with PD, using bulk RNA-seq of pretreatment tumors. In box plots, center line, median; box limits, 25th–75th percentile; whiskers, minimum and maximum values. Data analyzed with two-tailed Mann–Whitney test (A), Fisher exact test (B), and two-way ANOVA followed by the Tukey test (C) or Šídák (G) multiple comparisons test. Survival distributions compared by the log-rank test with HR and CI indicated (D–G). Differential gene expression and gene set enrichment were performed using a Benjamini–Hochberg adjustment (I and J).

References

    1. Krummel MF, Allison JP. CD28 and CTLA-4 have opposing effects on the response of T cells to stimulation. J Exp Med 1995;182:459–65. - PMC - PubMed
    1. Tivol EA, Borriello F, Schweitzer AN, Lynch WP, Bluestone JA, Sharpe AH. Loss of CTLA-4 leads to massive lymphoproliferation and fatal multiorgan tissue destruction, revealing a critical negative regulatory role of CTLA-4. Immunity 1995;3:541–7. - PubMed
    1. Waterhouse P, Penninger JM, Timms E, Wakeham A, Shahinian A, Lee KP, et al. . Lymphoproliferative disorders with early lethality in mice deficient in Ctla-4. Science 1995;270:985–8. - PubMed
    1. Azuma M, Ito D, Yagita H, Okumura K, Phillips JH, Lanier LL, et al. . B70 antigen is a second ligand for CTLA-4 and CD28. Nature 1993;366:76–9. - PubMed
    1. Hathcock KS, Laszlo G, Dickler HB, Bradshaw J, Linsley P, Hodes RJ. Identification of an alternative CTLA-4 ligand costimulatory for T cell activation. Science 1993;262:905–7. - PubMed

MeSH terms

LinkOut - more resources