. 2024 Sep-Oct:403-404:104860.
doi: 10.1016/j.cellimm.2024.104860. Epub 2024 Jul 26.

R406 reduces lipopolysaccharide-induced neutrophil activation

Affiliations

R406 reduces lipopolysaccharide-induced neutrophil activation

Seth Warner et al. Cell Immunol. 2024 Sep-Oct.

Abstract

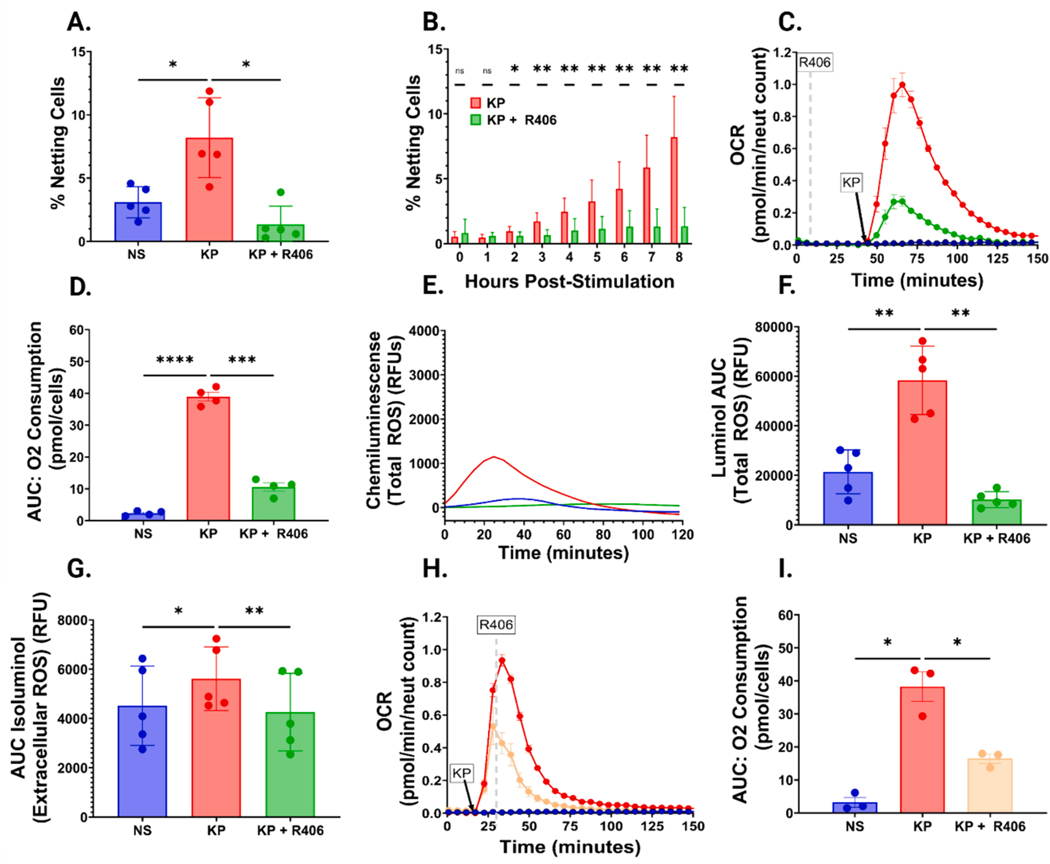
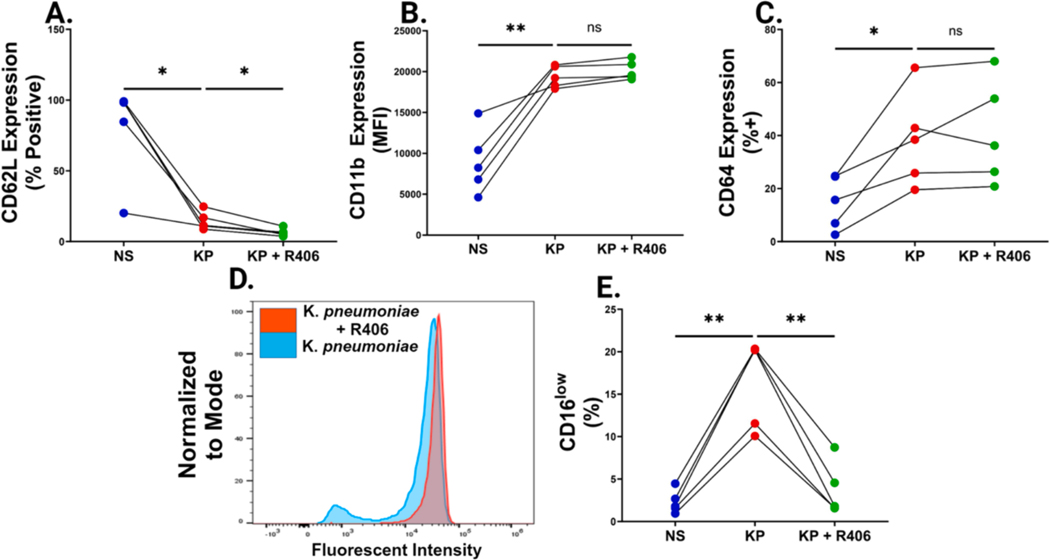
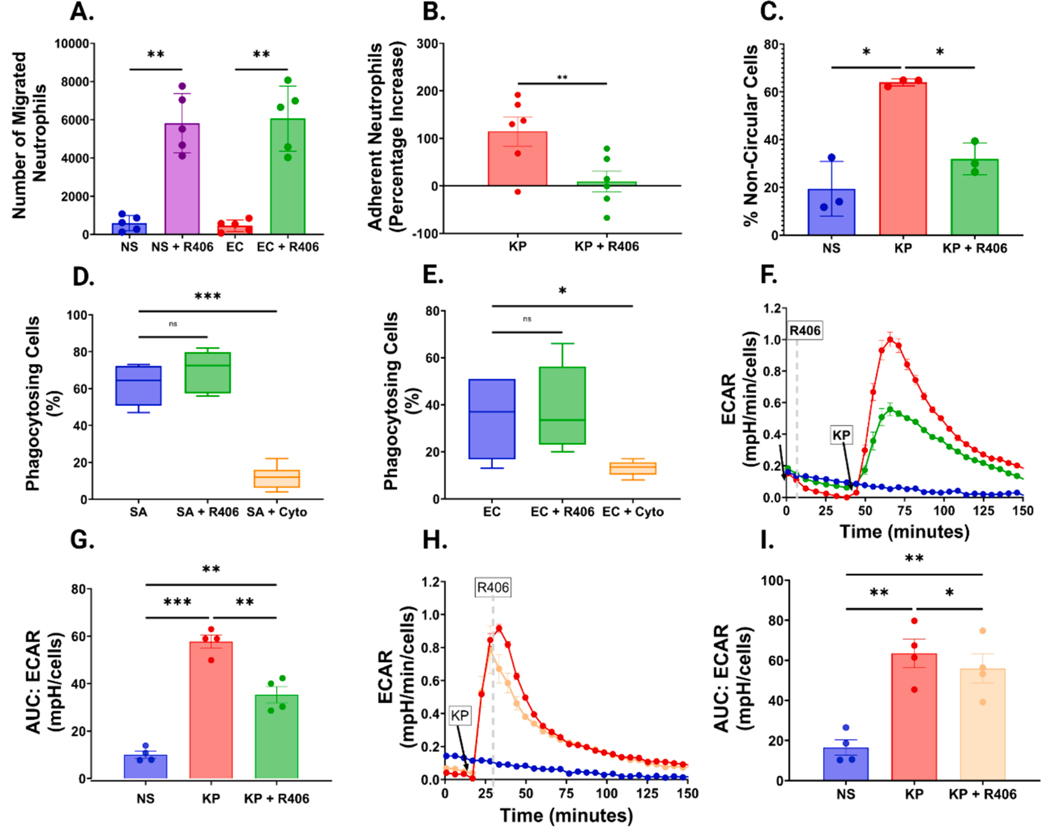
Modulating SYK has been demonstrated to have impacts on pathogenic neutrophil responses in COVID-19. During sepsis, neutrophils are vital in early bacterial clearance but also contribute to the dysregulated immune response and organ injury when hyperactivated. Here, we evaluated the impact of R406, the active metabolite of fostamatinib, on neutrophils stimulated by LPS. We demonstrate that R406 was able to effectively inhibit NETosis, degranulation, ROS generation, neutrophil adhesion, and the formation of CD16low neutrophils that have been linked to detrimental outcomes in severe sepsis. Further, the neutrophils remain metabolically active, capable of releasing cytokines, perform phagocytosis, and migrate in response to IL-8. Taken together, this data provides evidence of the potential efficacy of utilizing fostamatinib in bacterial sepsis.

Keywords: Neutrophils; Sepsis; Spleen tyrosine kinase.


Conflict of interest statement

Declaration of competing interest The authors declare that they have no known competing financial interests or personal relationships that could have appeared to influence the work reported in this paper.

Figures

Fig. 1.
Fig. 1.. R406 effectively inhibits LPS mediated NETosis and ROS generation.
(A) Bar chart comparing the percentage of non-stimulated cells (NS), K. pneumoniae LPS (5 μg/mL) stimulated cells (KP), or K. pneumoniae LPS (5 μg/mL) stimulated cells preincubated with 1 μM R406 (KP+R406) at the conclusion of eight-hour stimulation. All P values calculated utilizing the one-way ANOVA described previously unless stated otherwise. (B) Stacked bar chart comparing the percentage of KP vs KP+R406 neutrophils undergoing NETosis over the course of 8 h. P-values computed using multiple paired parametric t-tests of the percentage of NETing cells every hour over the course of eight hours. (C) Representative graph demonstrating an increase in oxygen consumption rate (OCR) in cells stimulated with 5 μg/mL of K. pneumoniae LPS (red line) relative to cells stimulated with the same concentration of LPS plus 1 μM R406 (green line) and control non-stimulated cells (blue line). (D) Bar chart comparing the AUC of the total oxygen consumption of cells stimulated as described in (C). (E) Kinetic graph showing increases in chemiluminescence (Total ROS generation) in neutrophils stimulated with 1 μg/mL of K. pneumoniae LPS (red line) relative to neutrophils stimulated with the same concentration of LPS+R406 (green line), and non-stimulated cells (blue line) from one representative experiment. (F) Bar chart comparing the total AUC of cells stimulated as described in (E). (G) Bar chart showing the total AUC of the same conditions as described as (E), with chemiluminescence representing only external ROS generation. (H) Representative graph demonstrating an increase in oxygen consumption rate (OCR) with the same conditions described in (E), with the yellow line showing cells stimulated with the same concentration of LPS plus 1 μM R406 administered 10 min after LPS stimulation. (I) Bar chart comparing total AUC across the three conditions shown in (H).
Fig. 2.
Fig. 2.. R406 decreases neutrophil degranulation while having no effect on cytokine release.
(A) Volcano plots showcasing the levels of neutrophil degranulation markers, MPO, lactoferrin, and MMP9 were measured in the cell supernatant one hour post stimulation in non-stimulated cells, cell stimulated with 1 μg/mL of K. pneumoniae LPS, and cells stimulated with 1 μg/mL of K. pneumoniae LPS plus 1 μM R406. Dotted lines represent the median as well as 25th and 75th quartile for each analyte. P values were computed using one-way ANOVA for all comparison. (B) Volcano plots showcasing the concentration of soluble TNF-α, IL6, and IL-1β in the supernatant 1 h post stimulation in the same groups as (A).
Fig. 3.
Fig. 3.. R406 shows little effect on classic neutrophilic sepsis markers, but blocks CD16 shedding
(A) Paired dot plots comparing the percentage of CD62L+ neutrophils, determined by FMO controls, one hour after stimulation in non-stimulated cells as well as cells stimulated with 1 μg/mL of K. pneumoniae LPS with or without 1 μM R406. All P values were determined by one way ANOVA as described previously. (B) Paired dot plots comparing the increase in CD11b Mean Fluorescent Intensity (MFI) across the same groups as described in (A). (C) Paired dot plots comparing the percentage of CD64+ neutrophils, determined by FMO controls, in the same groups as described in (A). (D) Representative histogram showcasing the distinct CD16low population arising after one hour of K. pneumoniae stimulated neutrophils (blue) that is absent in cells preincubated with 1 μM R406 (red). (E) Paired dot plots comparing the percentage of CD16low neutrophils in the same groups as described in (A).
Fig. 4.
Fig. 4.. R406 has diverse effects on neutrophil migration, adhesion, shape, phagocytosis, and metabolism.
(A) Bar graph showing the number of neutrophils migrating over one-hour in response to IL-8. Neutrophils were either not stimulated (NS) or exposed to 10 ng/mL E. coli (EC) LPS, with or without preincubation with 1 μM R406. All P values were computed by one-way ANOVA as previously described. (B) Bar graph comparing the percentage increase of neutrophils adhered to HUVEC cells relative to non-stimulated cells in cells stimulated with 100 ng/mL of K. pneumoniae LPS with or without preincubation with 1 μM R406. (C) Bar graph showcasing the percentage of non-circular cells, in non-stim cells (NS), and cells stimulated with 1 μg/mL K. pneumoniae LPS with or without R406. (D) Box and whisker graph showcasing the percentage of total cells undergoing phagocytosis Cells were either incubated with 1 μg of pHrodo® Green Staphylococcus aureus (SA) bioparticles either with (SA+R406) or without (SA) preincubation with 1 μM R406 or 10 μg/mL of Cytochalasin D (SA+Cyto), Boxes show mean value as well as 25th and 75th percentile of data. Whiskers represent minimum and maximum of each data set. (E) Box and whisker plot showing percentage of cells undergoing phagocytosis as shown in (D), but neutrophils were plated with 1 μg of pHrodo® Green E. coli bioparticles. (F) Representative kinetic graph showcasing the increase in the extracellular acidification rate of the media surrounding neutrophils as measured by the Agilent Seahorse in cells stimulated with 5 μg/mL of K. pneumoniae LPS (red line) relative to cells stimulated with the same concentration of LPS plus 1 μM R406 (green line) and a control non-stimulated cells (blue line). (G) AUC of extracellular acidification rate of the conditions outlined in (F). (H) Representative kinetic graph showcasing the increase in the extracellular acidification rate of the media as described in (F), with the yellow line representing cells stimulated with 5 μg/mL of K. pneumoniae LPS followed by 1 μM R406 exposure 10 min post stimulation. (I) AUC of extracellular acidification rate of the conditions outlined in (H).

References

    1. Rhee C, Dantes R, Epstein L, Murphy DJ, Seymour CW, Iwashyna TJ, Kadri SS, Angus DC, Danner RL, Fiore AE, et al., Incidence and trends of sepsis in US hospitals using clinical vs claims data, 2009–2014, J. Am. Med. Assoc. 318 (13) (2017) 1241–1249. - PMC - PubMed
    1. Kadri SS, Rhee C, Strich JR, Morales MK, Hohmann S, Menchaca J, Suffredini AF, Danner RL, Klompas M, Estimating ten-year trends in septic shock incidence and mortality in United States academic medical centers using clinical data, Chest 151 (2) (2017) 278–285. - PMC - PubMed
    1. Zhang F, Liu AL, Gao S, Ma S, Guo SB, Neutrophil dysfunction in sepsis, Chin. Med. J. (Engl) 129 (22) (2016) 2741–2744. - PMC - PubMed
    1. Kovach MA, Standiford TJ, The function of neutrophils in sepsis, Curr. Opin. Infect. Dis. 25 (3) (2012) 321–327. - PubMed
    1. Denning NL, Aziz M, Gurien SD, Wang P, DAMPs and NETs in sepsis, Front. Immunol. 10 (2019) 2536. - PMC - PubMed

MeSH terms

LinkOut - more resources