. 2024 Sep 3;36(9):2146-2155.e5.
doi: 10.1016/j.cmet.2024.07.002. Epub 2024 Jul 30.

Development of a functional beige fat cell line uncovers independent subclasses of cells expressing UCP1 and the futile creatine cycle

Affiliations

Development of a functional beige fat cell line uncovers independent subclasses of cells expressing UCP1 and the futile creatine cycle

Ariana Vargas-Castillo et al. Cell Metab. .

Abstract

Although uncoupling protein 1 (UCP1) is established as a major contributor to adipose thermogenesis, recent data have illustrated an important role for alternative pathways, particularly the futile creatine cycle (FCC). How these pathways co-exist in cells and tissues has not been explored. Beige cell adipogenesis occurs in vivo but has been difficult to model in vitro; here, we describe the development of a murine beige cell line that executes a robust respiratory response, including uncoupled respiration and the FCC. The key FCC enzyme, tissue-nonspecific alkaline phosphatase (TNAP), is localized almost exclusively to mitochondria in these cells. Surprisingly, single-cell cloning from this cell line shows that cells with the highest levels of UCP1 express little TNAP, and cells with the highest expression of TNAP express little UCP1. Immunofluorescence analysis of subcutaneous fat from cold-exposed mice confirms that the highest levels of these critical thermogenic components are expressed in distinct fat cell populations.

Keywords: Alpl gene; SV40 large T antigen; TNAP; UCP1; aP2-Prdm16 transgenic mice; functional beige cell line; futile creatine cycle; immortalized beige adipocytes; thermogenesis.


Conflict of interest statement

Declaration of interests The authors declare no competing interests.

Figures

Figure 1.
Figure 1.. Immortalized adipocyte precursors from Prdm16 transgenic mice (SV40-Prdm16 cell line) retain their beige phenotype
(A) Left panel, scheme of immortalization procedure; right panel, photos of the developed cell lines SV40-WT and SV40-Prdm16 on day 8 of adipocyte differentiation. Photos were taken with 4x objective. (B) Left panel, oxygen consumption rate (OCR) of SV40-WT and SV40-Prdm16 adipocytes. Acute stimulated respiration was measured by adding 10 μM Forskolin. Right panel, bar graphs represent quantification of mitochondrial function parameters. Data are represented as mean ± SEM. Unpaired t-test, *p<0.05, n= 5. Oligo, oligomycin; CCCP, carbonyl cyanide m-chlorophenylhydrazone; R, rotenone; A, antimycin A. (C) RT-qPCR of canonical thermogenic genes and Futile Creatine Cycle-related genes after 4h treatment with 0.5 mM IBMX. Data are represented as mean ± SEM. Two-way ANOVA, post hoc Dunnett vs SV40 WT + Vehicle (DMSO), *p<0.05, n=3.
Figure 2.
Figure 2.. SV40-Prdm16 adipocytes have an active Futile Creatine Cycle
(A) Western blot of mitochondria lysate from SV40-WT and SV40-Prdm16 adipocytes showing TNAP and UCP1 protein expression. HSP60 and TOMM20 are mitochondrial markers. Non-mitochondrial fractions were also measured from the same preparations. Actin was used as a cytoplasmic control protein. (B) Upper panels, oxygen consumption rate (OCR) of SV40-Prdm16 adipocytes after overnight treatment with 2mM β-GPA or vehicle (water). Bar graphs represent quantification of mitochondrial function parameters. Data are represented as mean ± SEM. Unpaired t-test, *p<0.05, n=6-7. Lower panels, OCR of SV40-Prdm16 adipocytes after one hour treatment with 33μM and 100μM SBI-425 (TNAP inhibitor) vs vehicle (DMSO). Bar graphs represent quantification of mitochondrial function parameters. Data are represented as mean ± SEM. One-way ANOVA, post hoc Dunnett vs vehicle (DMSO), *p<0.05, n=6-7. Acute stimulated respiration was measured by adding 10μM Forskolin (Fsk). Treatments were included in the media during the whole experiment. (C) Effect of 0.01 mM creatine on OCR in isolated mitochondria from SV40-Prdm16 adipocytes under ADP-limiting concentrations (0.3 mM). Data are represented as mean ± SEM. Unpaired t-test, *p<0.05, n=8.
Figure 3.
Figure 3.. Clones from parental SV40-Prdm16 cell line reveal at least two subclasses of thermogenic adipocytes, a UCP1 population and an FCC population
(A) Correlation of the relative mRNA expression of Alpl and Ucp1 in the 96 adipogenic clonal cell lines isolated from parental SV40-Prdm16 cell line after 4h treatment with 0.5 mM IBMX. Data are represented as mean. Spearman correlation, n=3. (B) Western blot of mitochondria lysate from clones #37 & #79 (Alpl-dominant) and #59 & #67 (Ucp1-dominant) showing TNAP and UCP1 protein expression. HSP60 and TOMM20 are mitochondrial markers. (C) Representative confocal images from clone #37 (Alpl-dominant) and clone #59 (Ucp1-dominant) co-stained with mitochondrial marker HSP60 (red), TNAP (green) and UCP1 (magenta) after 12h 0.5mM IBMX treatment. Scale bars, 10 μm (D) Left panel, Forskolin induced respiration is reduced in clones #37 & #79 (Alpl-dominant), but not in clones #59 & #67 (Ucp1-dominant) (right panel), after acute pretreatment in port A with 33μM SBI-425 (TNAP inhibitor) or vehicle (DMSO). Data are represented as mean ± SEM. Unpaired t-test, *p<0.05, n=5.
Figure 4.
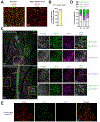
Figure 4.. UCP1high adipocytes and TNAPhigh adipocytes are identified in different cell populations in the iWAT from cold exposed WT mice
(A) Widefield fluorescence images of iWAT sections showing TNAP (green) is mainly localized in mitochondria from cold exposed WT mice. HSP60 (red) is a mitochondrial marker. Adipo-Alpl knockout mice were used to validate the specificity of the antibody. n=3 mice per group. Scale bars, 50 μm. (B) Percentage of colocalization between TNAP and HSP60 (mitochondrial marker) from panel A was calculated by overlap coefficient (a modification of Pearson’s correlation). Calculations were conducted by analyzing 250 photos from whole iWAT of three WT mice using Cellprofiler software. (C) Representative confocal images from the inguinal area of cold exposed mice showing the different adipocyte subclasses throughout the tissue. Cropped photos show magnification for better visualization of TNAP-enriched adipocytes (TNAPhi/UCP1low), UCP1-enriched adipocytes (UCP1hi/TNAPlow) and both TNAP/UCP1-enriched adipocytes (TNAPhi/UCP1hi). TNAP in green, UCP1 in magenta and Perilipin in grey, which is a marker for adipocyte identity. n=3. Scale bars, 100 and 50 μm. (D) Percentage of adipocyte subclasses in Dorsolumbar (DL), lymph node (LN) and inguinal (ING) areas of iWAT corresponding to 3 cold-exposed WT mice. Quantified sections correspond to the core of the tissue. Fluorescence intensities from 3369 adipocytes were calculated using Cellpose and analyzed with Cellprofiler sorfware. (E) Representative confocal image showing the TNAPhi population (green) in human deep neck brown fat (at basal conditions). COX4 (red), a mitochondrial marker, was used to normalize brightness. UCP1 (magenta) was below detection limit. Scale bars, 50 μm

References

    1. Lowell BB, and Spiegelman BM (2000). Towards a molecular understanding of adaptive thermogenesis. Nature 404, 652–660. 10.1038/35007527. - DOI - PubMed
    1. Cohen P, and Spiegelman BM (2015). Brown and Beige Fat: Molecular Parts of a Thermogenic Machine. Diabetes 64, 2346–2351. 10.2337/db15-0318. - DOI - PMC - PubMed
    1. Harms M, and Seale P (2013). Brown and beige fat: development, function and therapeutic potential. Nat Med 19, 1252–1263. 10.1038/nm.3361. - DOI - PubMed
    1. Rosen ED, and Spiegelman BM (2014). What we talk about when we talk about fat. Cell 156, 20–44. 10.1016/j.cell.2013.12.012. - DOI - PMC - PubMed
    1. Fearon K, Strasser F, Anker SD, Bosaeus I, Bruera E, Fainsinger RL, Jatoi A, Loprinzi C, MacDonald N, Mantovani G, et al. (2011). Definition and classification of cancer cachexia: an international consensus. Lancet Oncol 12, 489–495. 10.1016/S1470-2045(10)70218-7. - DOI - PubMed

LinkOut - more resources