
Quantification of escape from X chromosome inactivation with single-cell omics data reveals heterogeneity across cell types and tissues

Yoshihiko Tomofuji et al. Cell Genom. .

Abstract

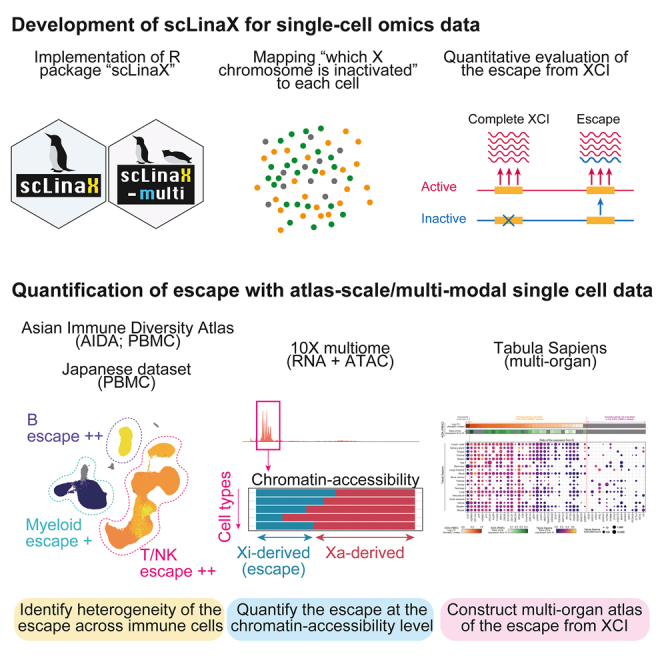
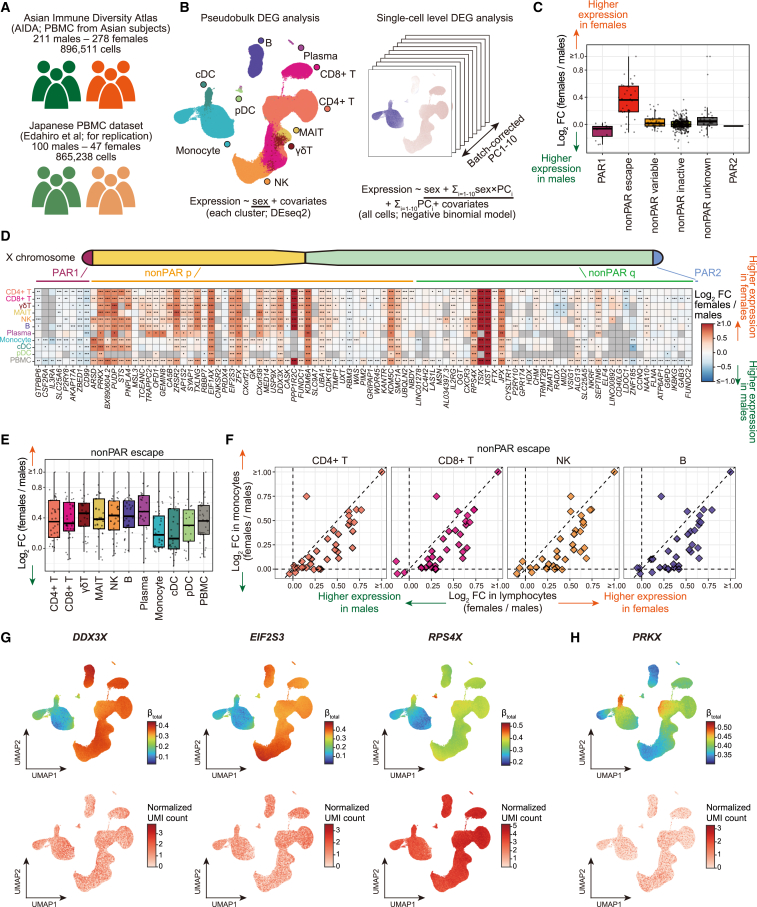
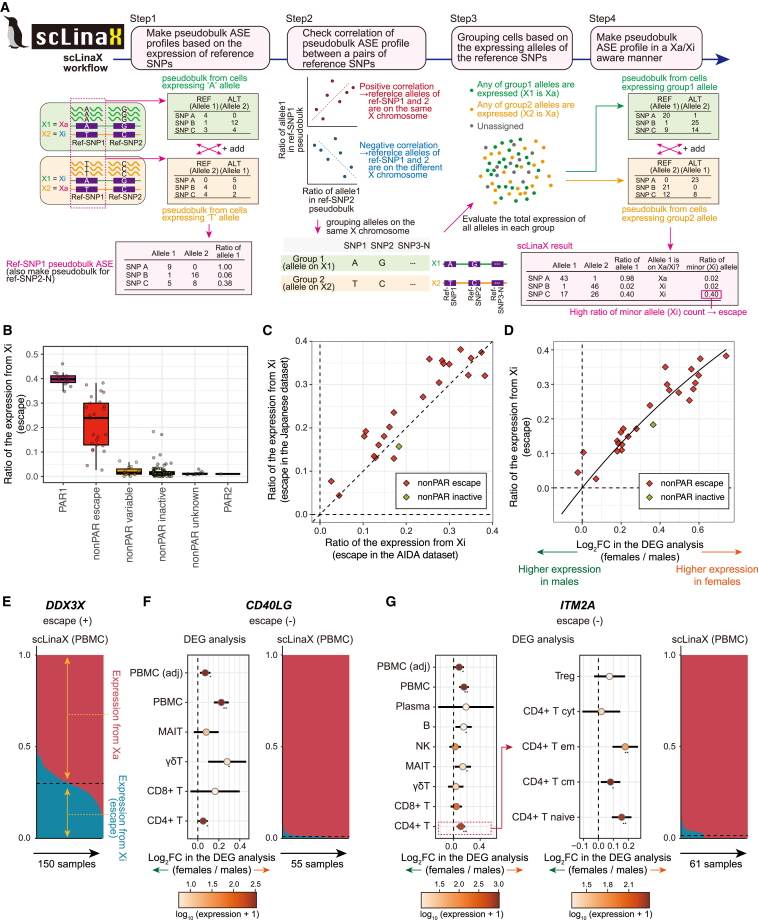
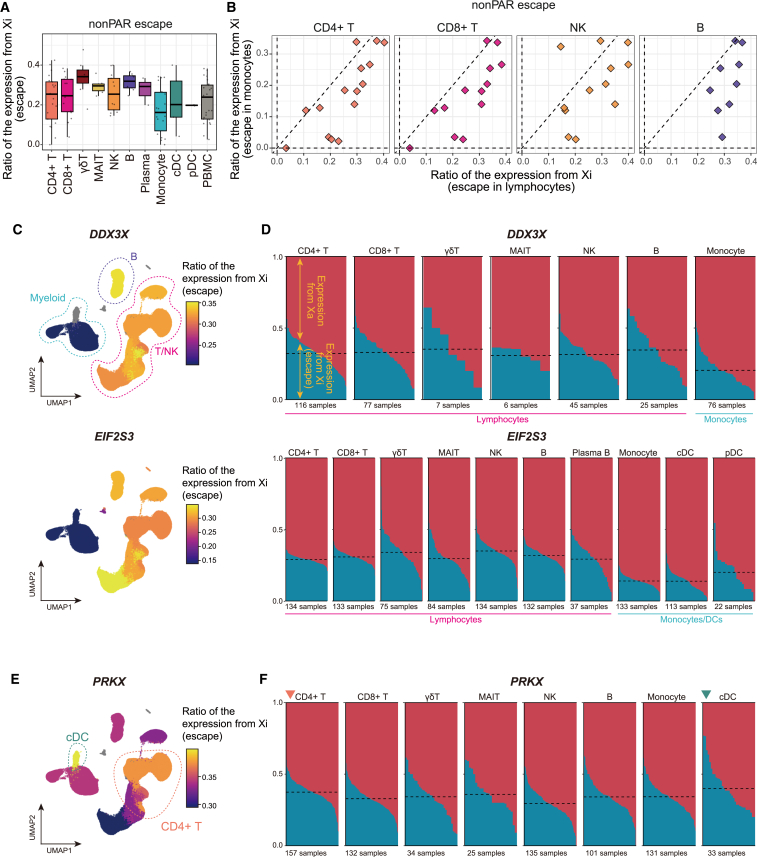
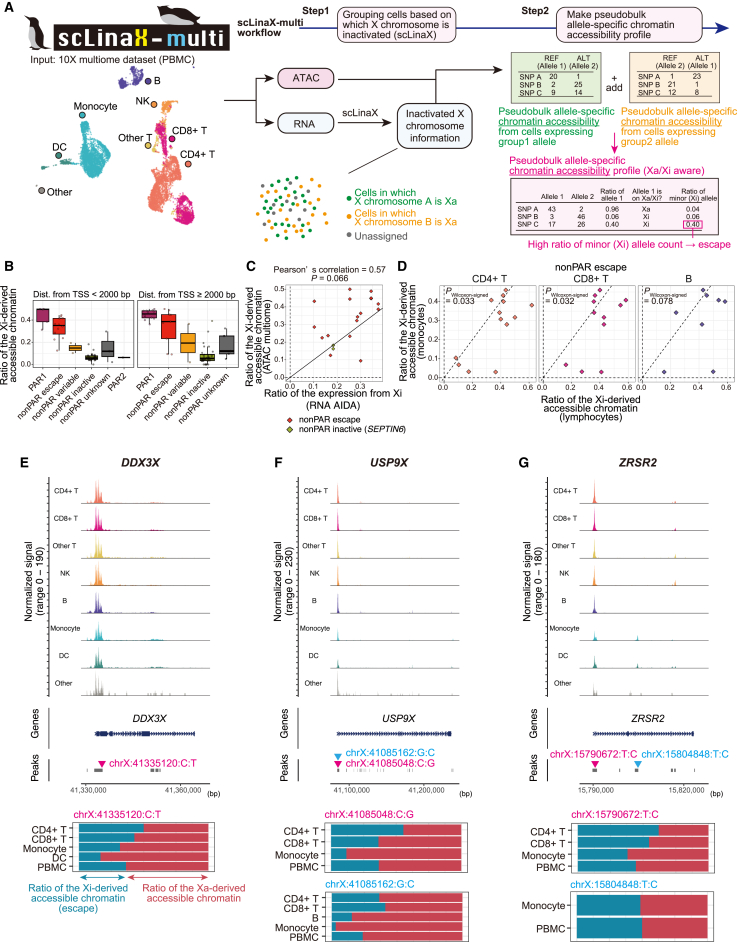
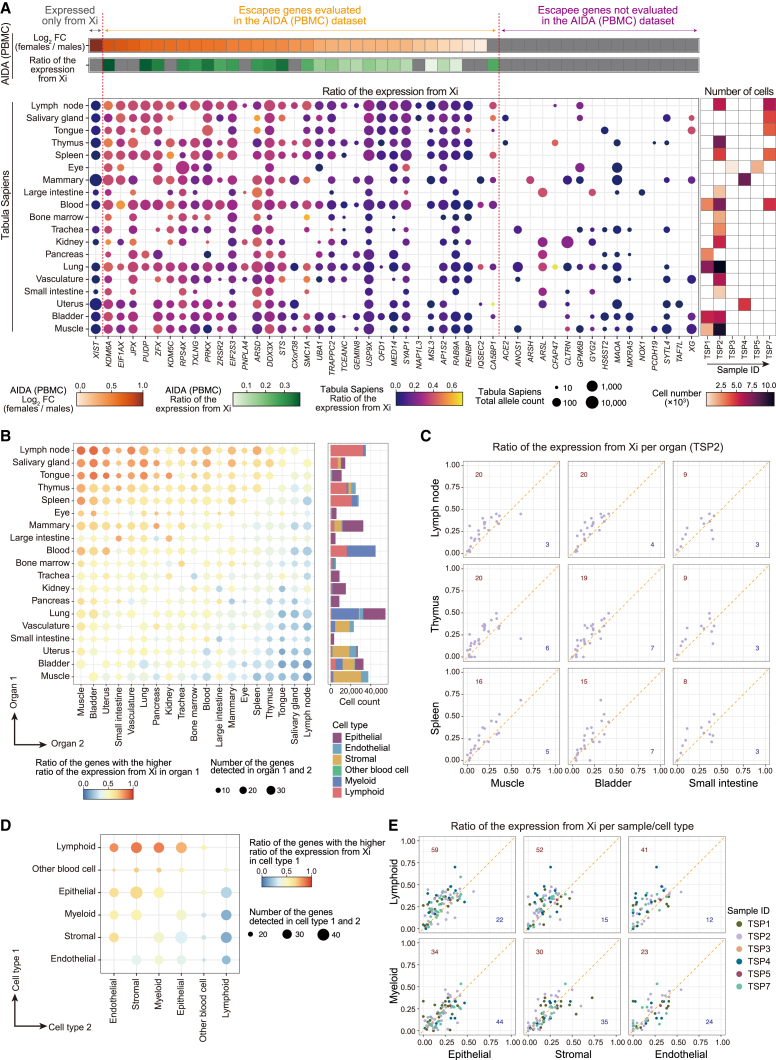
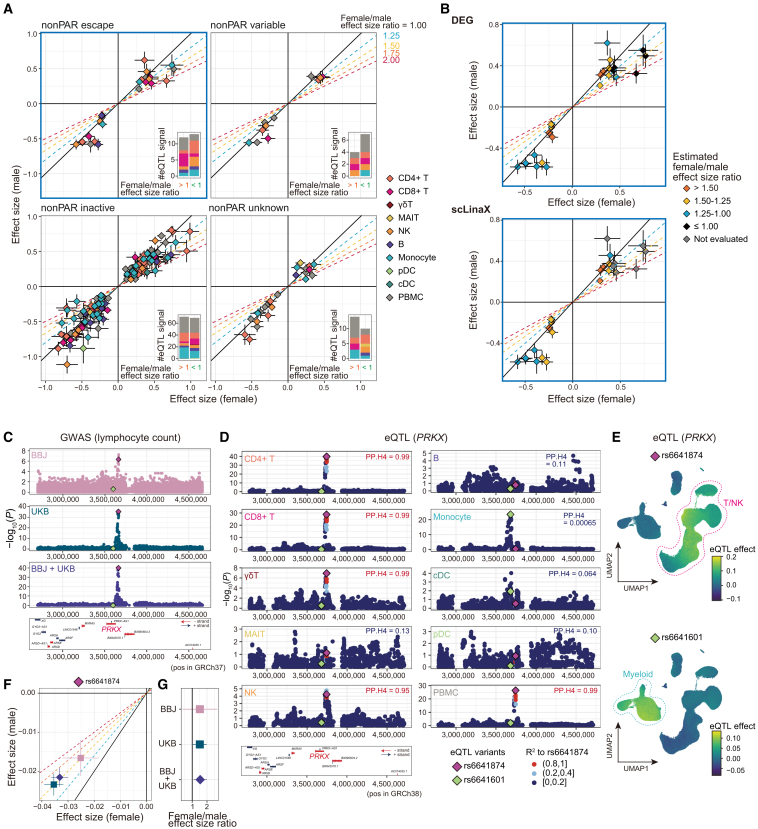
Several X-linked genes escape from X chromosome inactivation (XCI), while differences in escape across cell types and tissues are still poorly characterized. Here, we developed scLinaX for directly quantifying relative gene expression from the inactivated X chromosome with droplet-based single-cell RNA sequencing (scRNA-seq) data. The scLinaX and differentially expressed gene analyses with large-scale blood scRNA-seq datasets consistently identified the stronger escape in lymphocytes than in myeloid cells. An extension of scLinaX to a 10x multiome dataset (scLinaX-multi) suggested a stronger escape in lymphocytes than in myeloid cells at the chromatin-accessibility level. The scLinaX analysis of human multiple-organ scRNA-seq datasets also identified the relatively strong degree of escape from XCI in lymphoid tissues and lymphocytes. Finally, effect size comparisons of genome-wide association studies between sexes suggested the underlying impact of escape on the genotype-phenotype association. Overall, scLinaX and the quantified escape catalog identified the heterogeneity of escape across cell types and tissues.

Keywords: X chromosome; sex differences; single-cell omics.


Conflict of interest statement

Declaration of interests The authors declare no competing interests.

Figures

None
Graphical abstract
Figure 1
Figure 1
Pseudobulk and single-cell-level differentially expressed gene analyses suggested escape from XCI across immune cells (A) The scRNA-seq datasets used in this study. (B) The DEG analysis methods used in this study (STAR Methods, Data S1). (C) A boxplot represents log2 fold changes in the gene expression between sexes. Genes are grouped according to the XCI status annotated in the previous study. (D) A heatmap represents differential gene expression between sexes. The colors of the tiles represent log2 fold changes in the gene expression between sexes. Only genes that satisfied Bonferroni-corrected significance thresholds at least in one cell type are shown. ∗p < 0.05. ∗∗Per-cell-type false discovery ratio (FDR) <0.05. ∗∗∗Bonferroni-corrected p < 0.05. (E) A boxplot represents log2 fold changes of the escapee gene expression between sexes across cell types. (F) Scatterplots represent pairwise comparisons of the log2 fold changes of the escapee gene expression between sexes. The y axes represent the log2 fold changes in monocytes and the x axes represent the log2 fold changes in lymphocytes. The dashed lines represent x = 0, x = y, and y = 0. (G and H) UMAPs represent the per-cell effect sizes of the sex in the single-cell-level DEG analysis calculated as a sum of the effect sizes of sex and sex × batch-corrected PCs (STAR Methods, top) and gene expression (bottom). Genes that show a stronger degree of escape in lymphocytes than monocytes (G) and other patterns of heterogeneity of effect sizes (H) are indicated. The p values for the interaction between sex and batch-corrected PCs were <1 × 10−200 (G) and 1.5 × 10−12 (H). DEG, differentially expressed genes; PC, principal component; PAR, pseudoautosomal region; PBMC, peripheral blood mononuclear cells; scRNA-seq, single-cell RNA-seq; UMAP, uniform manifold approximation and projection; XCI, X chromosome inactivation.
Figure 2
Figure 2
scLinaX, a method to quantify escape from XCI using droplet-based scRNA-seq data (A) A schematic illustration of scLinaX. (B) A boxplot represents the estimated ratio of the expression from Xi. Genes are grouped according to the XCI status annotated in the previous study. (C) A plot represents the concordance of the ratio of the expression from Xi between the AIDA dataset (x axis) and the Japanese dataset (y axis). Genes that are annotated as escapee genes and the SEPTIN6 gene are included. The black line indicates x = y. Pearson’s correlation = 0.92 with a 95% confidence interval (CI) of 0.82–0.97. (D) A plot represents the relationship between the log2 fold changes in the DEG analysis (x axis) and the ratio of the expression from Xi (y axis). Genes that are annotated as escapee genes and the SEPTIN6 gene are included. The curved line indicates the theoretical relationship under the assumption that total gene expression in males and Xa-derived gene expression in females are at the same level. Pearson’s correlation = 0.94 with a 95% CI of 0.87–0.97. (E) A plot representing the ratio of the expression from Xa and Xi at an individual level for the DDX3X gene. The dashed black horizontal line represents the mean ratio of the expression from Xi across samples. (F and G) Forest plots represent the log2 fold changes in the DEG analysis for each cell type (left) and plots on the right represent the ratio of the expression from Xa and Xi at an individual level. The error bars indicate 95% CI. The colors of the dots represent the log-scaled mean normalized count calculated by DEseq2 (baseMean). ∗p < 0.05. ∗∗Per-cell-type FDR <0.05. The dashed black horizontal line represents the mean ratio of the expression from Xi across samples. AIDA, Asian Immune Diversity Atlas; ALT, alternative allele; ASE, allele-specific expression; REF, reference allele; SNP, single-nucleotide polymorphism; Xa, active X chromosome; Xi, inactive X chromosome.
Figure 3
Figure 3
The scLinaX-based quantification of escape from XCI across immune cell types (A) A boxplot represents the estimated ratio of the expression from Xi for escapee genes across cell types. (B) Scatterplots represent pairwise comparisons of the ratio of the expression from Xi for escapee genes. The dashed lines represent x = 0, x = y, and y = 0. (C) UMAPs colored according to the ratio of the expression from Xi estimated for each cell type. Representative genes that showed a higher ratio of expression from Xi in lymphocytes than monocytes, the DDX3X and EIF2S3 genes, are indicated. Cell types whose ratio of the expression from Xi could not be estimated are colored gray. (D) The ratio of the expression from Xa and Xi at an individual level for the DDX3X and EIF2S3 genes. The dashed horizontal line represents the mean ratio of the expression from Xi across samples for each cell type. Since the definition of alleles derived from Xa and Xi is consistent within the same individual, the ratio of expression from Xi may exceed 0.5 in some cell types. (E) A UMAP colored according to the ratio of the expression from Xi estimated for each cell type. The PRKX gene, which shows a unique pattern of heterogeneity of escape across cell types, is indicated. (F) The ratio of the expression from Xa and Xi at an individual level for the PRKX gene.
Figure 4
Figure 4
scLinaX-multi, a method to estimate the chromatin accessibility of Xi from multi-modal single-cell omics data (A) A schematic illustration of the scLinaX-multi (Data S4; STAR Methods). (B) Boxplots represent the estimated ratio of the accessible chromatin derived from Xi for peaks within 2 kbp of TSS (left) and ≥2 kbp distant from TSS (right). Peaks are grouped according to the XCI status of the nearest gene. (C) A plot representing the relationship between the ratio of the expression from Xi (RNA level, x axis) and the ratio of the accessible chromatin derived from Xi (y axis) for each peak-nearest gene pair. Genes that are annotated as escape genes or showed evidence of escape in the scLinaX analysis (ratio of the expression from Xi > 0.15) are indicated. The black line indicates x = y. When a single gene has multiple peaks, the average across the peaks for the ratio of the Xi-derived accessible chromatin is used for the calculation of Pearson’s correlation. (D) Scatterplots represent pairwise comparisons of the accessible chromatin derived from Xi for peaks whose nearest genes are escapee genes. The y axes represent the ratio of the expression from Xi in monocytes and the x axes represent the ratio of the expression from Xi in lymphocytes. The dashed lines represent x = 0, x = y, and y = 0. The p values are calculated by the Wilcoxon signed-rank test. (E–G) The results of the scLinaX-multi for the representative peaks around escapee genes, namely DDX3X (E), USP9X (F), and ZRSR2 (G). Normalized tag counts across cell types are indicated with peak information (top). The ratio of the accessible chromatin derived from Xa and Xi across cell types is indicated as bar plots (bottom) with information on which SNPs are used for the analysis. Since the definition of alleles derived from Xa and Xi is consistent within the same individual, the ratio of expression from Xi may exceed 0.5 in some cell types. ATAC, assay for transposase-accessible chromatin; TSS, transcription start site.
Figure 5
Figure 5
Quantitative evaluation of escape from XCI with a human multi-organ atlas of single-cell transcriptome data (A) The ratio of the expression from Xi across organs from the Tabula Sapiens dataset (y axis) for escapee genes (x axis). (The XIST gene is the exception, showing the expression from Xa.) The color and size of the dots represent the ratio of the expression from Xi and the total allele count. Heatmaps above the dot plot represent the log2 fold change of gene expression between sexes (orange) and the ratio of the expression from Xi (green) calculated from the AIDA dataset. The heatmap on the right of the dot plot represents the number of cells used for the scLinaX analysis across organs and samples. (B) The results of the pairwise comparison of the ratio of the expression from Xi across organs. The color of the dots represents the ratio of the genes whose ratio of the expression from Xi is higher in organ 1 (y axis) than in organ 2 (x axis). The size of the dots represents the number of genes used for each comparison. The bar plots on the right of the dot plot represent the numbers and types of the cells that were used for the scLinaX analysis. (C) The pairwise comparisons of the ratio of the expression from Xi for escapee genes. The y- and x axes represent the ratio of the expression from Xi in lymphoid tissues and organs with a relatively weak degree of escape, respectively. Since these organs are commonly evaluated in a sample TSP2, data from TSP2 are presented. The dashed line represents x = y. The numbers in each plot indicate the number of genes that are located in the x > y (lower right, blue) and x < y (upper left, red). (D) The results of the pairwise comparison of the ratio of the expression from Xi across cell types. (E) The pairwise comparisons of the ratio of the expression from Xi for each escapee gene and individual. The y axes represent the ratio of the expression from Xi in immune cell types (top, lymphoid; bottom, myeloid) and the x axes represent the ratio of the expression from Xi in other cell types. The color of the points represents each sample.
Figure 6
Figure 6
Detection of differential effect sizes between sexes in the genotype-phenotype association analysis (A) The effect sizes of the significant eQTL signals (p < 5 × 10−8) in the female-only (x axis) and male-only (y axis) analyses, separately for each XCI status. The error bars indicate standard errors. The color of the plots indicates the cell type in which the eQTL signals are identified. The oblique lines correspond to the female/male effect size ratios described in the plots. The bar plots in the lower right of each plot indicate the number of eQTL signals that have larger effect sizes in females (left) and males (right). (B) Scatterplots for escapee genes (A, upper left) are colored according to the estimated female/male effect size ratio based on the DEG analysis (top) and scLinaX analysis (bottom). Genes that were not evaluated in the scLinaX analyses are colored gray. (C) The association between PRKX gene loci and lymphocyte counts in the BBJ analysis, the UKB analysis, and the BBJ + UKB meta-analysis. The rs6641874 (top variant in the BBJ + UKB meta-analysis and T cells eQTL analysis) and rs6641601 (top variant in the monocytes eQTL analysis) are colored purple and green, respectively. Genes located around the PRKX gene region are indicated at the bottom of the plots. (D) Locus plots for the eQTL analysis of the PRKX gene across cell types. R2, a measure of linkage disequilibrium (LD) to the rs6641874, is indicated by the color of the dots. Results of the colocalization analyses (PP.H4) with lymphocyte count GWASs in BBJ are indicated in the upper right of the plots. (E) UMAPs represent the per-cell eQTL effect sizes of the variants in the single-cell-level eQTL analysis calculated (STAR Methods). Associations for PRKX genes rs6641874 (top) and rs6641601 (bottom) are indicated. The p values for the interaction between genotypes and batch-corrected PCs were 2.7 × 10−91 (top) and 2.4 × 10−51 (bottom). (F) The effect sizes of the rs6641874 in the female-only (x axis) and male-only (y axis) lymphocyte count GWAS analyses in each cohort. The error bars indicate standard errors. (G) The female/male effect size ratios of the rs6641874 in the lymphocyte count GWAS analyses in each cohort. The error bars indicate 95% CI.

References

    1. Balaton B.P., Brown C.J. Escape Artists of the X Chromosome. Trends Genet. 2016;32:348–359. doi: 10.1016/j.tig.2016.03.007. - DOI - PubMed
    1. Tukiainen T., Villani A.-C., Yen A., Rivas M.A., Marshall J.L., Satija R., Aguirre M., Gauthier L., Fleharty M., Kirby A., et al. Landscape of X chromosome inactivation across human tissues. Nature. 2017;550:244–248. doi: 10.1038/nature24265. - DOI - PMC - PubMed
    1. Dunford A., Weinstock D.M., Savova V., Schumacher S.E., Cleary J.P., Yoda A., Sullivan T.J., Hess J.M., Gimelbrant A.A., Beroukhim R., et al. Tumor-suppressor genes that escape from X-inactivation contribute to cancer sex bias. Nat. Genet. 2017;49:10–16. doi: 10.1038/ng.3726. - DOI - PMC - PubMed
    1. Souyris M., Cenac C., Azar P., Daviaud D., Canivet A., Grunenwald S., Pienkowski C., Chaumeil J., Mejía J.E., Guéry J.-C. TLR7 escapes X chromosome inactivation in immune cells. Sci. Immunol. 2018;3 doi: 10.1126/sciimmunol.aap8855. - DOI - PubMed
    1. Syrett C.M., Paneru B., Sandoval-Heglund D., Wang J., Banerjee S., Sindhava V., Behrens E.M., Atchison M., Anguera M.C. Altered X-chromosome inactivation in T cells may promote sex-biased autoimmune diseases. JCI Insight. 2019;4 doi: 10.1172/jci.insight.126751. - DOI - PMC - PubMed

LinkOut - more resources