. 2024 Sep;300(9):107607.
doi: 10.1016/j.jbc.2024.107607. Epub 2024 Jul 30.

Autoregulatory mechanism of enzyme activity by the nuclear localization signal of lysine-specific demethylase 1

Affiliations

Autoregulatory mechanism of enzyme activity by the nuclear localization signal of lysine-specific demethylase 1

Dulmi Senanayaka et al. J Biol Chem. 2024 Sep.

Abstract

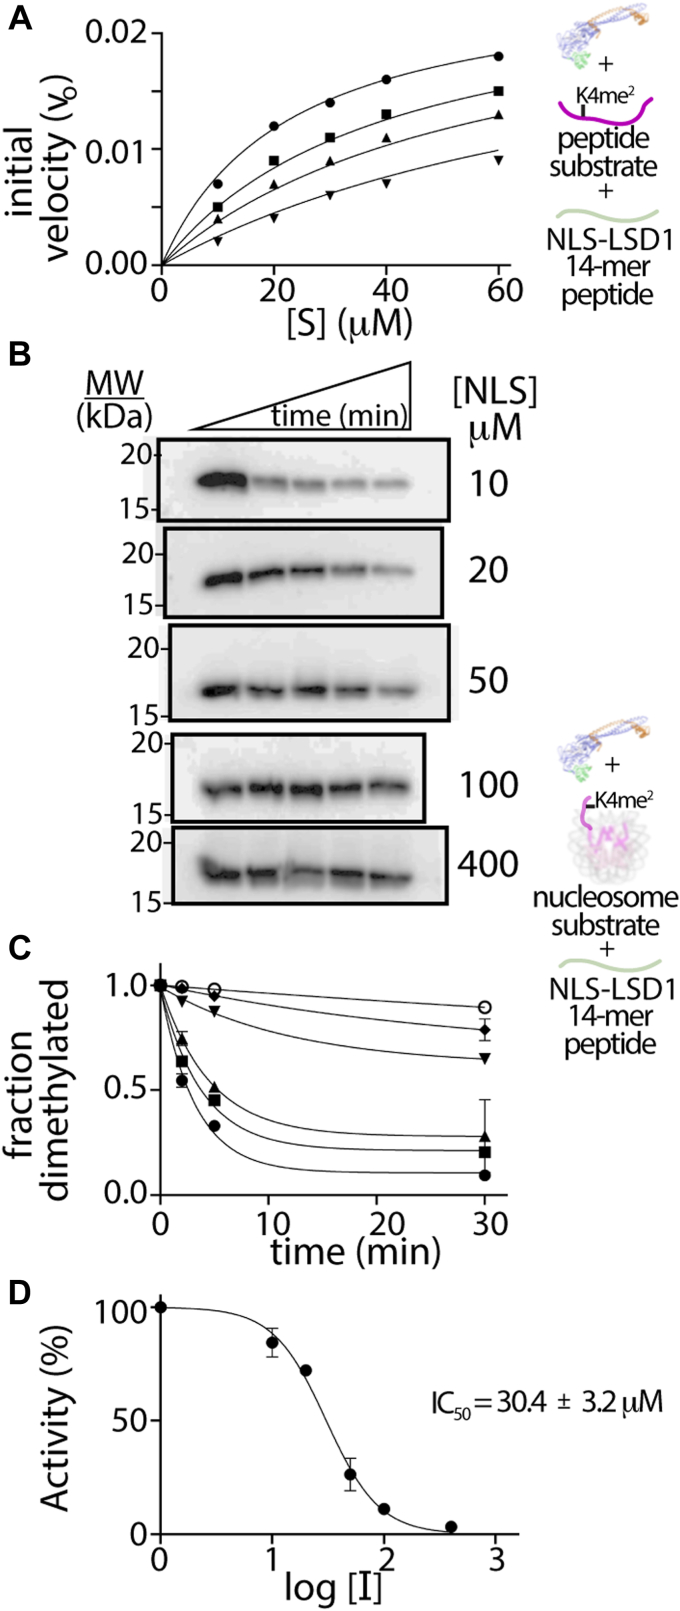
The N-terminal region of the human lysine-specific demethylase 1 (LSD1) has no predicted structural elements, contains a nuclear localization signal (NLS), undergoes multiple posttranslational modifications (PTMs), and acts as a protein-protein interaction hub. This intrinsically disordered region (IDR) extends from core LSD1 structure, resides atop the catalytic active site, and is known to be dispensable for catalysis. Here, we show differential nucleosome binding between the full-length and an N terminus deleted LSD1 and identify that a conserved NLS and PTM containing element of the N terminus contains an alpha helical structure, and that this conserved element impacts demethylation. Enzyme assays reveal that LSD1's own electropositive NLS amino acids 107 to 120 inhibit demethylation activity on a model histone 3 lysine 4 dimethyl (H3K4me2) peptide (Kiapp ∼ 3.3 μM) and histone 3 lysine 4 dimethyl nucleosome substrates (IC50 ∼ 30.4 μM), likely mimicking the histone H3 tail. Further, when the identical, inhibitory NLS region contains phosphomimetic modifications, inhibition is partially relieved. Based upon these results and biophysical data, a regulatory mechanism for the LSD1-catalyzed demethylation reaction is proposed whereby NLS-mediated autoinhibition can occur through electrostatic interactions, and be partially relieved through phosphorylation that occurs proximal to the NLS. Taken together, the results highlight a dynamic and synergistic role for PTMs, intrinsically disordered regions, and structured regions near LSD1 active site and introduces the notion that phosphorylated mediated NLS regions can function to fine-tune chromatin modifying enzyme activity.

Keywords: NMR; autoinhibition; histone demethylase; inhibition mechanism; intrinsically disordered protein; nuclear localization signal (NLS); nucleosome; structural biology.


Conflict of interest statement

Conflict of interest The authors declare that they have no conflicts of interest with the contents of this article.

Figures

Figure 1
Figure 1
Structure of the LSD1-CoREST-nucleosome complex, emphasizing disordered regions that reside near the active site cleft.A, the LSD1-CoREST-nucleosome structure (PDB 6VYP). Within the black box region, the H3 histone tail (purple dash), 170 residue N-terminal tail extends from the SWIRM domain (green dash) of LSD1, the C terminus extends from CoREST (orange dash), and extranucleosomal DNA (gray) all reside within 4 to 18 Å from LSD1’s catalytic pocket. Interactions between LSD1 (blue/green), CoREST (orange), histones (pink), and DNA (gray) are required for H3K4me2 demethylation. B, schematic of CoREST and LSD1, and sequence conservation of an N terminus region spanning residues 106 to 150 of LSD1. Phosphorylation-methylation modifications (black/blue asterisks) and residues encompassing the nuclear localization signal (NLS (green), 112 to 117) in this region of LSD1 are noted. C, the H3 tail sequence can include phosphorylation (black) and methyl modifications (red asterisks). CoREST, corepressor for repressor element 1 silencing transcription factor; H3K4me2, histone 3 lysine 4 dimethyl; LSD, lysine-specific demethylase; NLS, nuclear localization signal; PDB, Protein Data Bank; SWIRM, The Swi3p, Rsc8p and Moira protein domains.
Figure 2
Figure 2
Comparative binding and activity on nucleosomes by ΔN (171–852) and full-length LSD1. SPR titration series of (A) ΔN LSD1 (171–852)–CoREST (286–482) and (B) full-length LSD1 (1–852)-CoREST (286–482) to 147 bp mononucleosomes. Sensorgram data show differential response units (RU) over time, measuring binding to mononucleosomes immobilized via biotinylated DNA on a sensor chip. In (A-B), nucleosomes were subject to 5 (dark blue), 10 (blue) 2 (dark red), 50 (magenta), 100 (pink), 200 (orange), 300 (turquoise), 400 (cyan), 500 (light orange), and 2000 nM (green) purified LSD1-CoREST. Differences in the response units (RU) versus protein concentration and fitted data (Fig. S2) revealed the apparent binding dissociation constants (Kd). Western blot activity assays show H3K4me2 nucleosome demethylation by (C) ΔN LSD1 (ΔN, 171–852)–CoREST (286–482) and (D) full-length LSD1 (FL, 1–852) in complex with CoREST (286–482). Reactions with enzyme (20 and 2 μM, see Fig. S4 for all blots) and in buffer 50 mM Hepes (pH 8.0), 50 mM KCl, 5% glycerol, 1 mM Tris(2-carboxyethyl)phosphine were initiated with 100 nM nucleosome substrate. The degree of inhibition was measured using H3K4me2 specific antibody relative to the amount of H3 in each lane using H3 antibody. E-F, quantitation of the H3K4me2 antibody signal relative to the H3 antibody signal at enzyme concentration (2, 5, 10, and 20 μM) over time enabled an analysis of LSD1’s demethylation activity. Image disclosure: Fig. S3A (20 and 2 μM experiments) are redundant with Figs. 2C and S3B (20 and 2 μM experiments) are redundant with Fig.ure 2D. Thus, the same data were used to produce both figures. Image justification: images are shown together in the context of the entire Western blot assay series (N = 2). Analysis of the data and all time course experiments enabled the quantification of LSD1 activity on H3K4me2 nucleosome substrates in vitro. CoREST, corepressor for repressor element 1 silencing transcription factor; H3K4me2, histone 3 lysine 4 dimethyl; LSD, lysine-specific demethylase; SPR, surface plasmon resonance.
Figure 3
Figure 3
Conserved N-terminal LSD1 region (NT-LSD1, 100–151) contains an α-helix and binds the ΔN LSD1 (171–852) – CoREST (286–482) complex.A, analysis of SPR data of a ΔN LSD1 complex to an immobilized NT-LSD1 polypeptide (aa. 100–151). The immobilized, biotinylated NT-LSD1 was subject to 25, 50, 100, 200, 500, and 1000 nM purified ΔN LSD1-CoREST. Analysis of SPR data revealed a binding dissociation constant (Kd) for the conserved N terminus of LSD1 to ΔN LSD1. This NT-LSD1 polypeptide has much weaker, nonspecific binding to nucleosomes (Fig. S3). Image disclosure: Figure 3A is redundant with Fig. S5B and the same data were used to produce both figures. Justification: Figure 3A represents the analysis of raw sensorgram data in Support Fig. S5A. Reuse of Support Fig. S5B thereby consolidates all source data associated with this specific series of SPR experiments. B, 15N HSQC NMR spectrum (298 K) of a 0.5 mM 15N LSD1-NT polypeptide, with experimentally determined backbone amide resonance assignments (BMRB 27615). C, low energy predictions of the NT-LSD1 region (100–151) are shown with an identified helix (NT-helix, 135–148) forming within the conserved N-terminal region. Two representative models were generated from CS-Rosetta and subject to AMBER simulation (see structure calculation methods). Predicted structures corroborate experimental data from CD spectroscopy, 15N-NOESY-HSQC and Talos + NMR data (Fig. S6) and X-ray crystallography (PDB 6WC6). CoREST, corepressor for repressor element 1 silencing transcription factor; HSQC, heteronuclear single quantum coherence; LSD, lysine-specific demethylase; PDB, Protein Data Bank; SPR, surface plasmon resonance.
Figure 4
Figure 4
Autoinhibition of demethylation by LSD1’s own nuclear localization signal region. ΔN LSD1 demethylation on an H3K4me2 peptide substrate in the presence of three peptides spanning the conserved N terminus of LSD1 was performed (Fig. S7), yet only A) the NLS containing peptide (aa 107–120, NLS-LSD1 (green)) resulted in enzyme inhibition (Kiapp ∼ 3.3 ± 0.6 μM, Table S2) on model peptide substrates. A Kiapp value was determined based upon NLS-LSD1 peptide concentrations (0 μM (circles), 2.5 μM (squares), 5 μM (triangles), and 10 μM (inverted triangles)) and various H3K4me2 peptide substrate concentrations (10, 20, 30, 40, and 60 μM) (N = 2). B, Western blot assays showing ΔN LSD1 catalyzed demethylation on H3K4me2 nucleosome substrates as probed using an anti-H3K4me2 antibody in the presence of increasing NLS-LSD1 peptide (10–400 μM) over time (0, 2, 5, 30, and 120 min). C, quantification of blot image intensities based upon the relative fraction of dimethylated nucleosomes from anti-H3K4me2 and control anti-H3 antibodies. The kobserved parameters were determined for 0 (black circle), 10 μM (square), 20 μM (triangle), 50 μM (inverted triangles), 100 μM (diamonds), and 400 μM (open circles) NLS-LSD1 peptide concentrations (N = 2). D, relative percent activity (%) versus inhibitor concentrations (log [I]), revealing the IC50 (30.4 ± 3.2 μM) for the NLS-LSD1 peptide on LSD1-based demethylation on H3K4me2 nucleosomal substrates. H3K4me2, histone 3 lysine 4 dimethyl; LSD, lysine-specific demethylase; NLS, nuclear localization signal.
Figure 5
Figure 5
Comparison of the catalytic efficiency of LSD1 constructs on H3K4me2 nucleosomal substrates suggests phosphorylation of T110/S111 partially relieves autoinhibition. A plot of kobservedversus enzyme [E] concentration enables the determination of comparative kmax/K1/2 values for (A) ΔN LSD1, (B) full-length (aa 1–852) LSD1, and (C) an T110D/S111D full-length (aa 1–852) LSD1 on H3K4me2 nucleosome substrates. (Fig. S11). For AC, A schematic of the ΔN LSD1-CoREST, full-length LSD1-CoREST, and full-length LSD1 (T110D/S111D)-CoREST with LSD1 (blue/green) and CoREST (orange) engaging with nucleosomes (DNA (gray) and histones (pink, H3 and light pink (all other histones)) is shown. CoREST, corepressor for repressor element 1 silencing transcription factor; H3K4me2, histone 3 lysine 4 dimethyl; LSD, lysine-specific demethylase.
Figure 6
Figure 6
Comparative 20 μs molecular dynamics simulation of histone 3 and NLS peptides near the LSD1 active site pocket.A, APBS electrostatic surface map of the LSD1 structure (red, electronegative, to blue, electropositive, with ramp levels −64.132–64.132 in complex with nucleosome H3 tail (pink). Structure from PDB 6VYP. Ten trajectory models (gray-black backbone cartoon) of the H3 tail (aa 3–11) spanning the 20 μs Amber simulation inform on the conformational dynamics within the active site pocket. A comparison of the primary sequence and N to C terminal directionality of the H3 (aa 3–14) with the reverse directionality of the human LSD1’s N-terminal region (aa 109–118) are shown. The locations of methylation (blue) and the phosphorylations on H3 and LSD1 are noted and where the approximate phosphorylation sites could be positioned is highlighted in the (A) and (B). B, APBS electrostatic surface map with ten trajectory models (gray-black backbone cartoon) spanning an identical 20 μs Amber simulation with the NLS peptide (LSD1, aa 110–117, green). Initial placement of the NLS peptide at the surface of LSD1 was derived from crystal soaking studies, where high salt LSD1-CoREST crystals were soaked with an NLS peptide. This experiment revealed weak difference density, indicative of low occupancy NLS ligand binding (Fig. S12A). It is likely that high salt crystal conditions contribute to the low occupancy of the electrostatic-based NLS-active site interaction. Nonetheless, a 20 μs Amber simulation informed on the “residence” time and relative stabilization of the NLS peptide near LSD1’s active site pocket. CoREST, corepressor for repressor element 1 silencing transcription factor; LSD, lysine-specific demethylase; NLS, nuclear localization signal; PDB, Protein Data Bank.

References

    1. Marabelli C., Marrocco B., Mattevi A. The growing structural and functional complexity of the LSD1/KDM1A histone demethylase. Curr. Opin. Struct. Biol. 2016;41:135–144. - PubMed
    1. Burg J.M., Link J.E., Morgan B.S., Heller F.J., Hargrove A.E., McCafferty D.G. KDM1 class flavin-dependent protein lysine demethylases. Biopolymers. 2015;104:213–246. - PMC - PubMed
    1. Soshnev A.A., Josefowicz S.Z., Allis C.D. Greater than the sum of parts: complexity of the dynamic epigenome. Mol. Cell. 2016;62:681–694. - PMC - PubMed
    1. McGinty R.K., Tan S. Recognition of the nucleosome by chromatin factors and enzymes. Curr. Opin. Struct. Biol. 2016;37:54–61. - PMC - PubMed
    1. Shi Y., Lan F., Matson C., Mulligan P., Whetstine J.R., Cole P.A., et al. Histone demethylation mediated by the nuclear amine oxidase homolog LSD1. Cell. 2004;119:941–953. - PubMed

MeSH terms

LinkOut - more resources