. 2024 Sep;65(9):100609.
doi: 10.1016/j.jlr.2024.100609. Epub 2024 Jul 30.

Single-cell profiling of surface glycosphingolipids opens a new dimension for deconvolution of breast cancer intratumoral heterogeneity and phenotypic plasticity

Affiliations

Single-cell profiling of surface glycosphingolipids opens a new dimension for deconvolution of breast cancer intratumoral heterogeneity and phenotypic plasticity

Jiřina Procházková et al. J Lipid Res. 2024 Sep.

Abstract

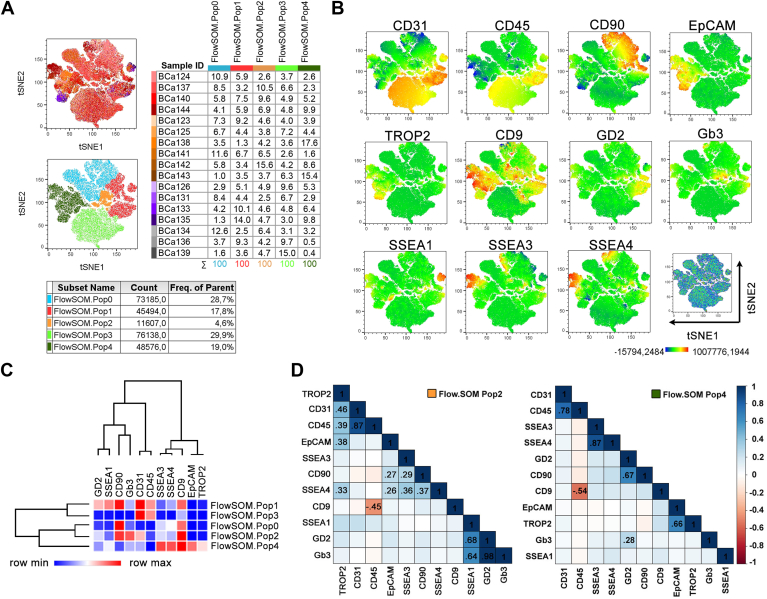
Glycosylated sphingolipids (GSLs) are a diverse group of cellular lipids typically reported as being rare in normal mammary tissue. In breast cancer (BCa), GSLs have emerged as noteworthy markers associated with breast cancer stem cells, mediators of phenotypic plasticity, and contributors to cancer cell chemoresistance. GSLs are potential surface markers that can uniquely characterize the heterogeneity of the tumor microenvironment, including cancer cell subpopulations and epithelial-mesenchymal plasticity (EMP). In this study, mass spectrometry analyses of the total sphingolipidome in breast epithelial cells and their mesenchymal counterparts revealed increased levels of Gb3 in epithelial cells and significantly elevated GD2 levels in the mesenchymal phenotype. To elucidate if GSL-related epitopes on BCa cell surfaces reflect EMP and cancer status, we developed and rigorously validated a 12-color spectral flow cytometry panel. This panel enables the simultaneous detection of native GSL epitopes (Gb3, SSEA1, SSEA3, SSEA4, and GD2), epithelial-mesenchymal transition markers (EpCAM, TROP2, and CD9), and lineage markers (CD45, CD31, and CD90) at the single-cell level. Next, the established panel was used for the analysis of BCa primary tumors and revealed surface heterogeneity in SSEA1, SSEA3, SSEA4, GD2, and Gb3, indicative of native epitope presence also on non-tumor cells. These findings further highlighted the phenotype-dependent alterations in GSL surface profiles, with differences between epithelial and stromal cells in the tumor. This study provides novel insights into BCa heterogeneity, shedding light on the potential of native GSL-related epitopes as markers for EMP and cancer status in fresh clinical samples. The developed single-cell approach offers promising avenues for further exploration.

Keywords: breast cancer; epithelial cells; glycosphingolipids; phenotypic plasticity; stromal-like cells; surface profiling.


Conflict of interest statement

Conflict of interest The authors declare that they have no conflicts of interest with the contents of this article.

Figures

None
Graphical abstract
Fig. 1
Fig. 1
Alterations of sphingolipid metabolism in in vitro models of breast EMT. A: The metabolic origin of glycosylated sphingolipids investigated in this study is summarized in a simplified scheme. GSL species analyzed for surface expression are underlined. Species in grey color were not analyzed by HPLC-MS/MS. B: Normalized levels of GSL species are shown in supplemental Fig. S1A and herein visualized as the ratio between HMLE and HMLE-EMT cells. GSL species significantly enriched in HMLE cells are shown in green, and those significantly enriched in HMLE-EMT cells in red and gray color depict no statistical significance (three independent repetitions done in technical triplicate, ∗P < 0.01, paired t test). C: Surface presence of native epitope recognized by GD2 antibody was analyzed by flow cytometry in in vitro breast EMT models, i.e. HMLE/EMT and MCF10A LXSN/V12 (n = 3, ∗P < 0.01; unpaired t test). D: Relative mRNA levels of genes encoding enzymes of GSL metabolism were measured in HMLE and HMLE-EMT cells; genes significantly upregulated or downregulated in mesenchymal cells are depicted by an asterisk (three independent repetitions in technical duplicate, P < 0.05; unpaired t test).
Fig. 2
Fig. 2
Surface profiling of breast in vitro epithelial and mesenchymal cell lines. A: Protein levels of EMT markers were detected in total lysates harvested from the panel of breast cell lines. The figure represents 1 of 3 biological repetitions; uncropped western blots from all 3 repetitions are shown in supplemental Figs. S6 and S7. The arrow depicts a specific band for ZEB1 protein, and molecular weight (M.W.) is shown for each protein in kilodaltons (kDa). PC1 and PC2 stand for positive controls. B–F: Cell lines were stained with a multi-color panel of antibodies specified in supplemental Table S3 and analyzed for the presence of surface GSL-related epitopes and EMT markers. Concatenate of 15.000 cells per sample preceded to two-dimensional reduction analysis performed by FitSNE algorithm to show heterogeneity in surface expression of analyzed molecules in depicted cell lines. B: tSNE map of pooled sample colored by (C) expression of EMT markers and GSLs or by (D) identified FlowSOM clusters. The table shows the percentual distribution of samples in individual FlowSOM clusters. E: Heatmap depicts hierarchical clustering and expression intensity of GSLs in identified FlowSOM clusters. F: Correlation matrix of analyzed epitopes as calculated from single cell measurements of fluorescent intensities.
Fig. 3
Fig. 3
The strategy of clinical samples surface profiling. Breast tissue samples were processed according to the standard experimental procedure summarized in panel 1 and described in the methods. Single-cell suspensions were stained with a panel of antibodies specified in supplemental Table S3 and analyzed without lineage selection for intratumoral heterogeneity (panel 2A) or with lineage selection for phenotypical plasticity (panel 2B) to address hypotheses summarized in panels 3A and 3B, respectively.
Fig. 4
Fig. 4
Surface profiling of GSL-related epitopes in breast tumors. Single suspensions isolated from primary breast tumors were stained with a multi-color panel of antibodies specified in supplemental Table S3 and analyzed for the presence of surface GSL-related epitopes and EMT markers. The pool of cells (15.000 per sample) from 17 patients was reduced by the FitSNE algorithm to show intratumoral heterogeneity in the expression of surface molecules. A: tSNE maps are colored by Sample ID (up) or by FlowSOM clusters (down). Tables show the percentual distribution of samples in individual FlowSOM clusters (up) or distribution of FlowSOM clusters (down) in pooled cells. B: tSNE maps colored by surface expression of analyzed epitopes. C: Heatmap depicts hierarchical clustering and expression intensity of GSLs in identified FlowSOM clusters. D: FlowSOM cluster-specific correlation matrices of analyzed epitopes as calculated from single-cell fluorescence intensities. Only statistically significant correlation coefficients r > 0.25 (blue) or r < −0.25 (red) are shown.
Fig. 5
Fig. 5
Surface profiling of GSL-related epitopes in epithelial and stromal-like tumor cells. A: Median fluorescence indexes (MFI) were calculated for each GSL-related epitope detected on the surface of epithelial or stromal-like cells (bar charts). tSNE maps located below bar charts visualize the surface expression pattern of each GSL in either epithelial cancer cells (blue frame) or in stromal-like cancer cells (yellow frame). Data were evaluated by unpaired t test; the P-value describing the difference in epitope expression between epithelial and stromal-like cancer cells is shown in the upper corner of each bar chart and highlighted in bold when significant, P < 0.05. B: Tukey plots show MFI values of surface GSLs or EMT markers in epithelial or stromal-like cells detected in non-tumor or tumor samples stratified based on ER status. Data were evaluated for statistical significance by ANOVA test with Holm post-hoc P value correction; P values ∼0.05 are shown.

References

    1. Hakomori S., Kannagi R. Glycosphingolipids as tumor-associated and differentiation markers. J. Natl. Cancer Inst. 1983;71:231–251. - PubMed
    1. Fox N., Damjanov I., Knowles B.B., Solter D. Immunohistochemical localization of the mouse stage-specific embryonic antigen 1 in human tissues and tumors. Cancer Res. 1983;43:669–678. - PubMed
    1. Igarashi Y., Kannagi R. Glycosphingolipids as mediators of phenotypic changes associated with development and cancer progression. J. Biochem. 2010;147:3–8. - PubMed
    1. Cazet A., Julien S., Bobowski M., Burchell J., Delannoy P. Tumour-associated carbohydrate antigens in breast cancer. Breast Cancer Res. 2010;12:204. - PMC - PubMed
    1. Marquina G., Waki H., Fernandez L.E., Kon K., Carr A., Valiente O., et al. Gangliosides expressed in human breast cancer. Cancer Res. 1996;56:5165–5171. - PubMed

Substances