. 2024 Nov:122:241-255.
doi: 10.1016/j.bbi.2024.07.044. Epub 2024 Jul 30.

Elevated antibody binding to striatal cholinergic interneurons in patients with pediatric acute-onset neuropsychiatric syndrome

Affiliations

Elevated antibody binding to striatal cholinergic interneurons in patients with pediatric acute-onset neuropsychiatric syndrome

Jian Xu et al. Brain Behav Immun. 2024 Nov.

Abstract

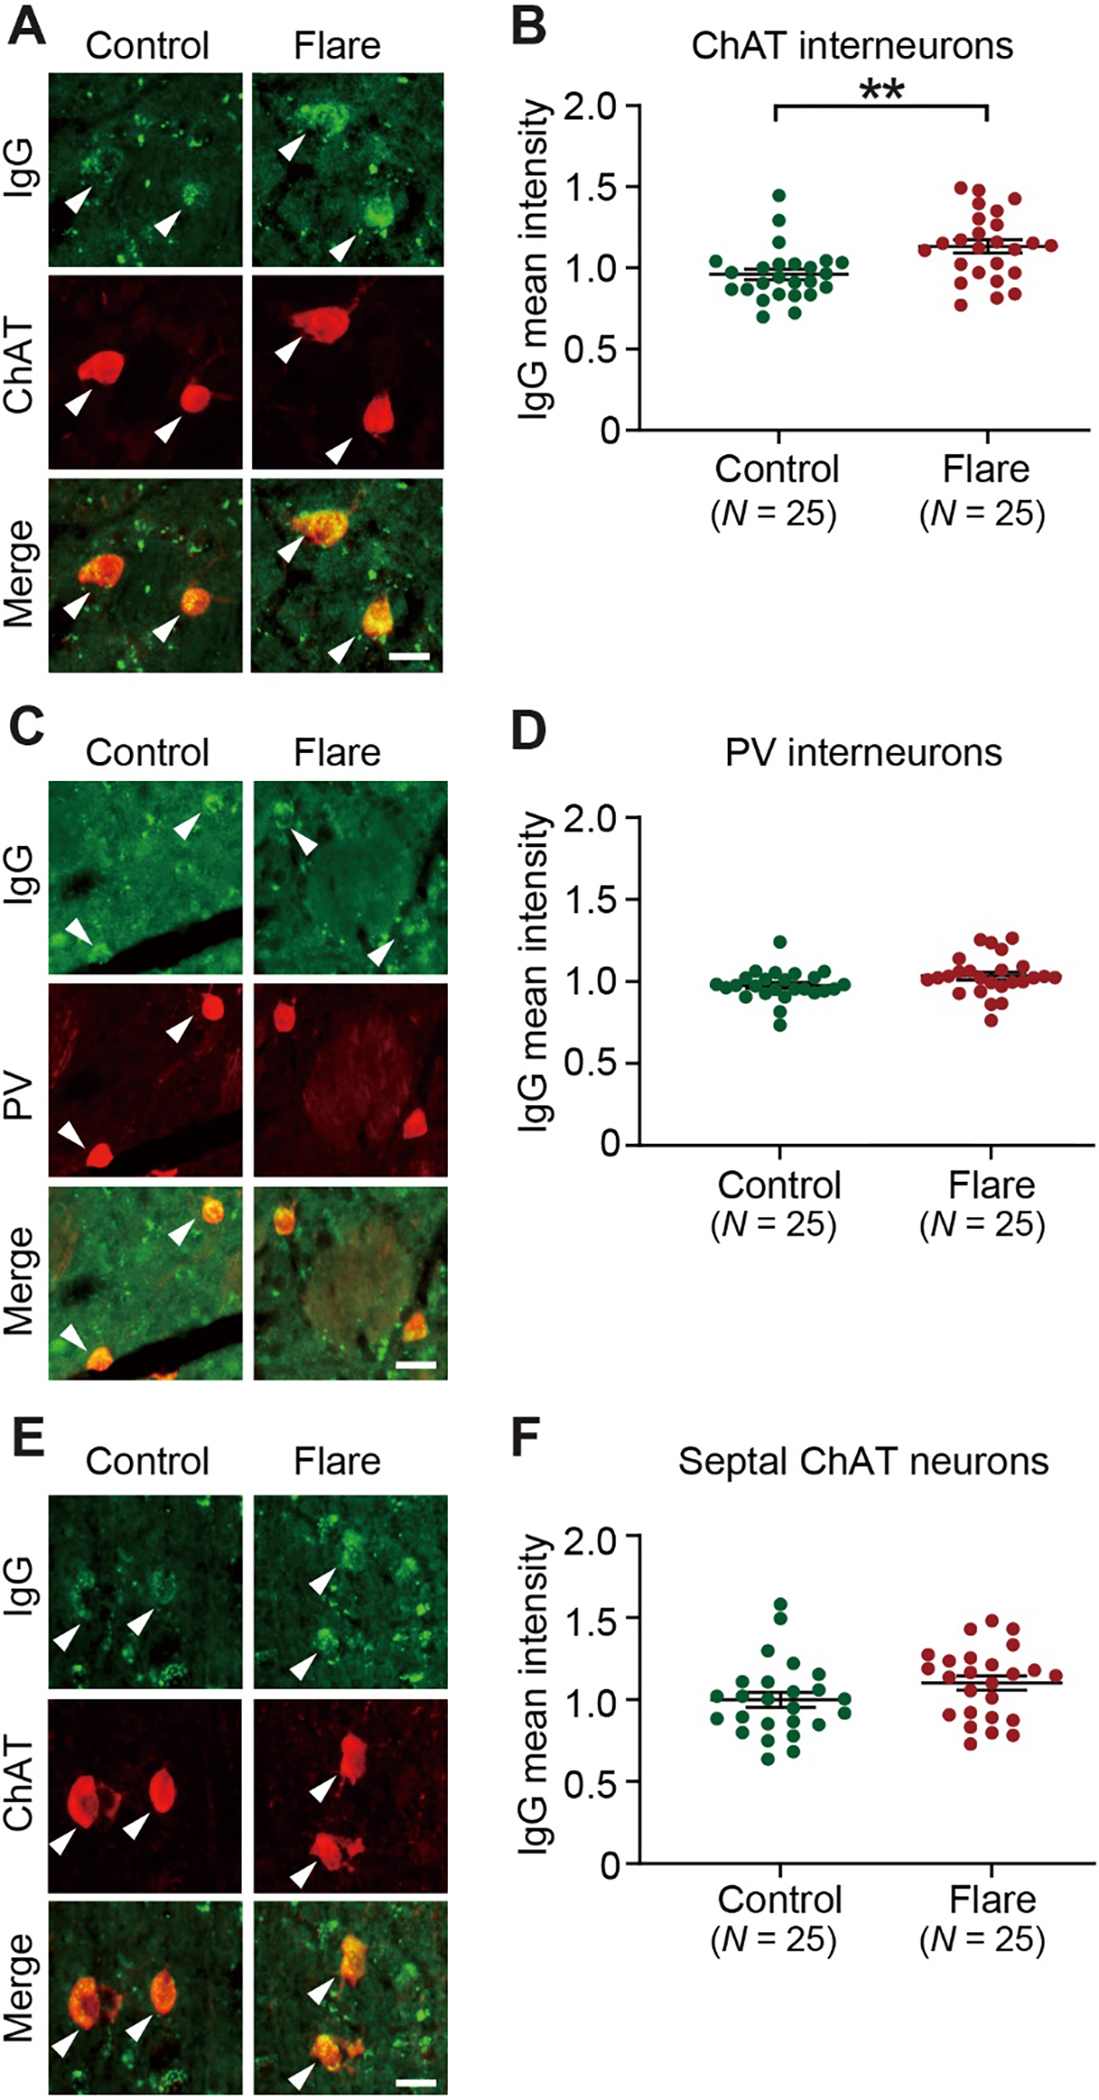
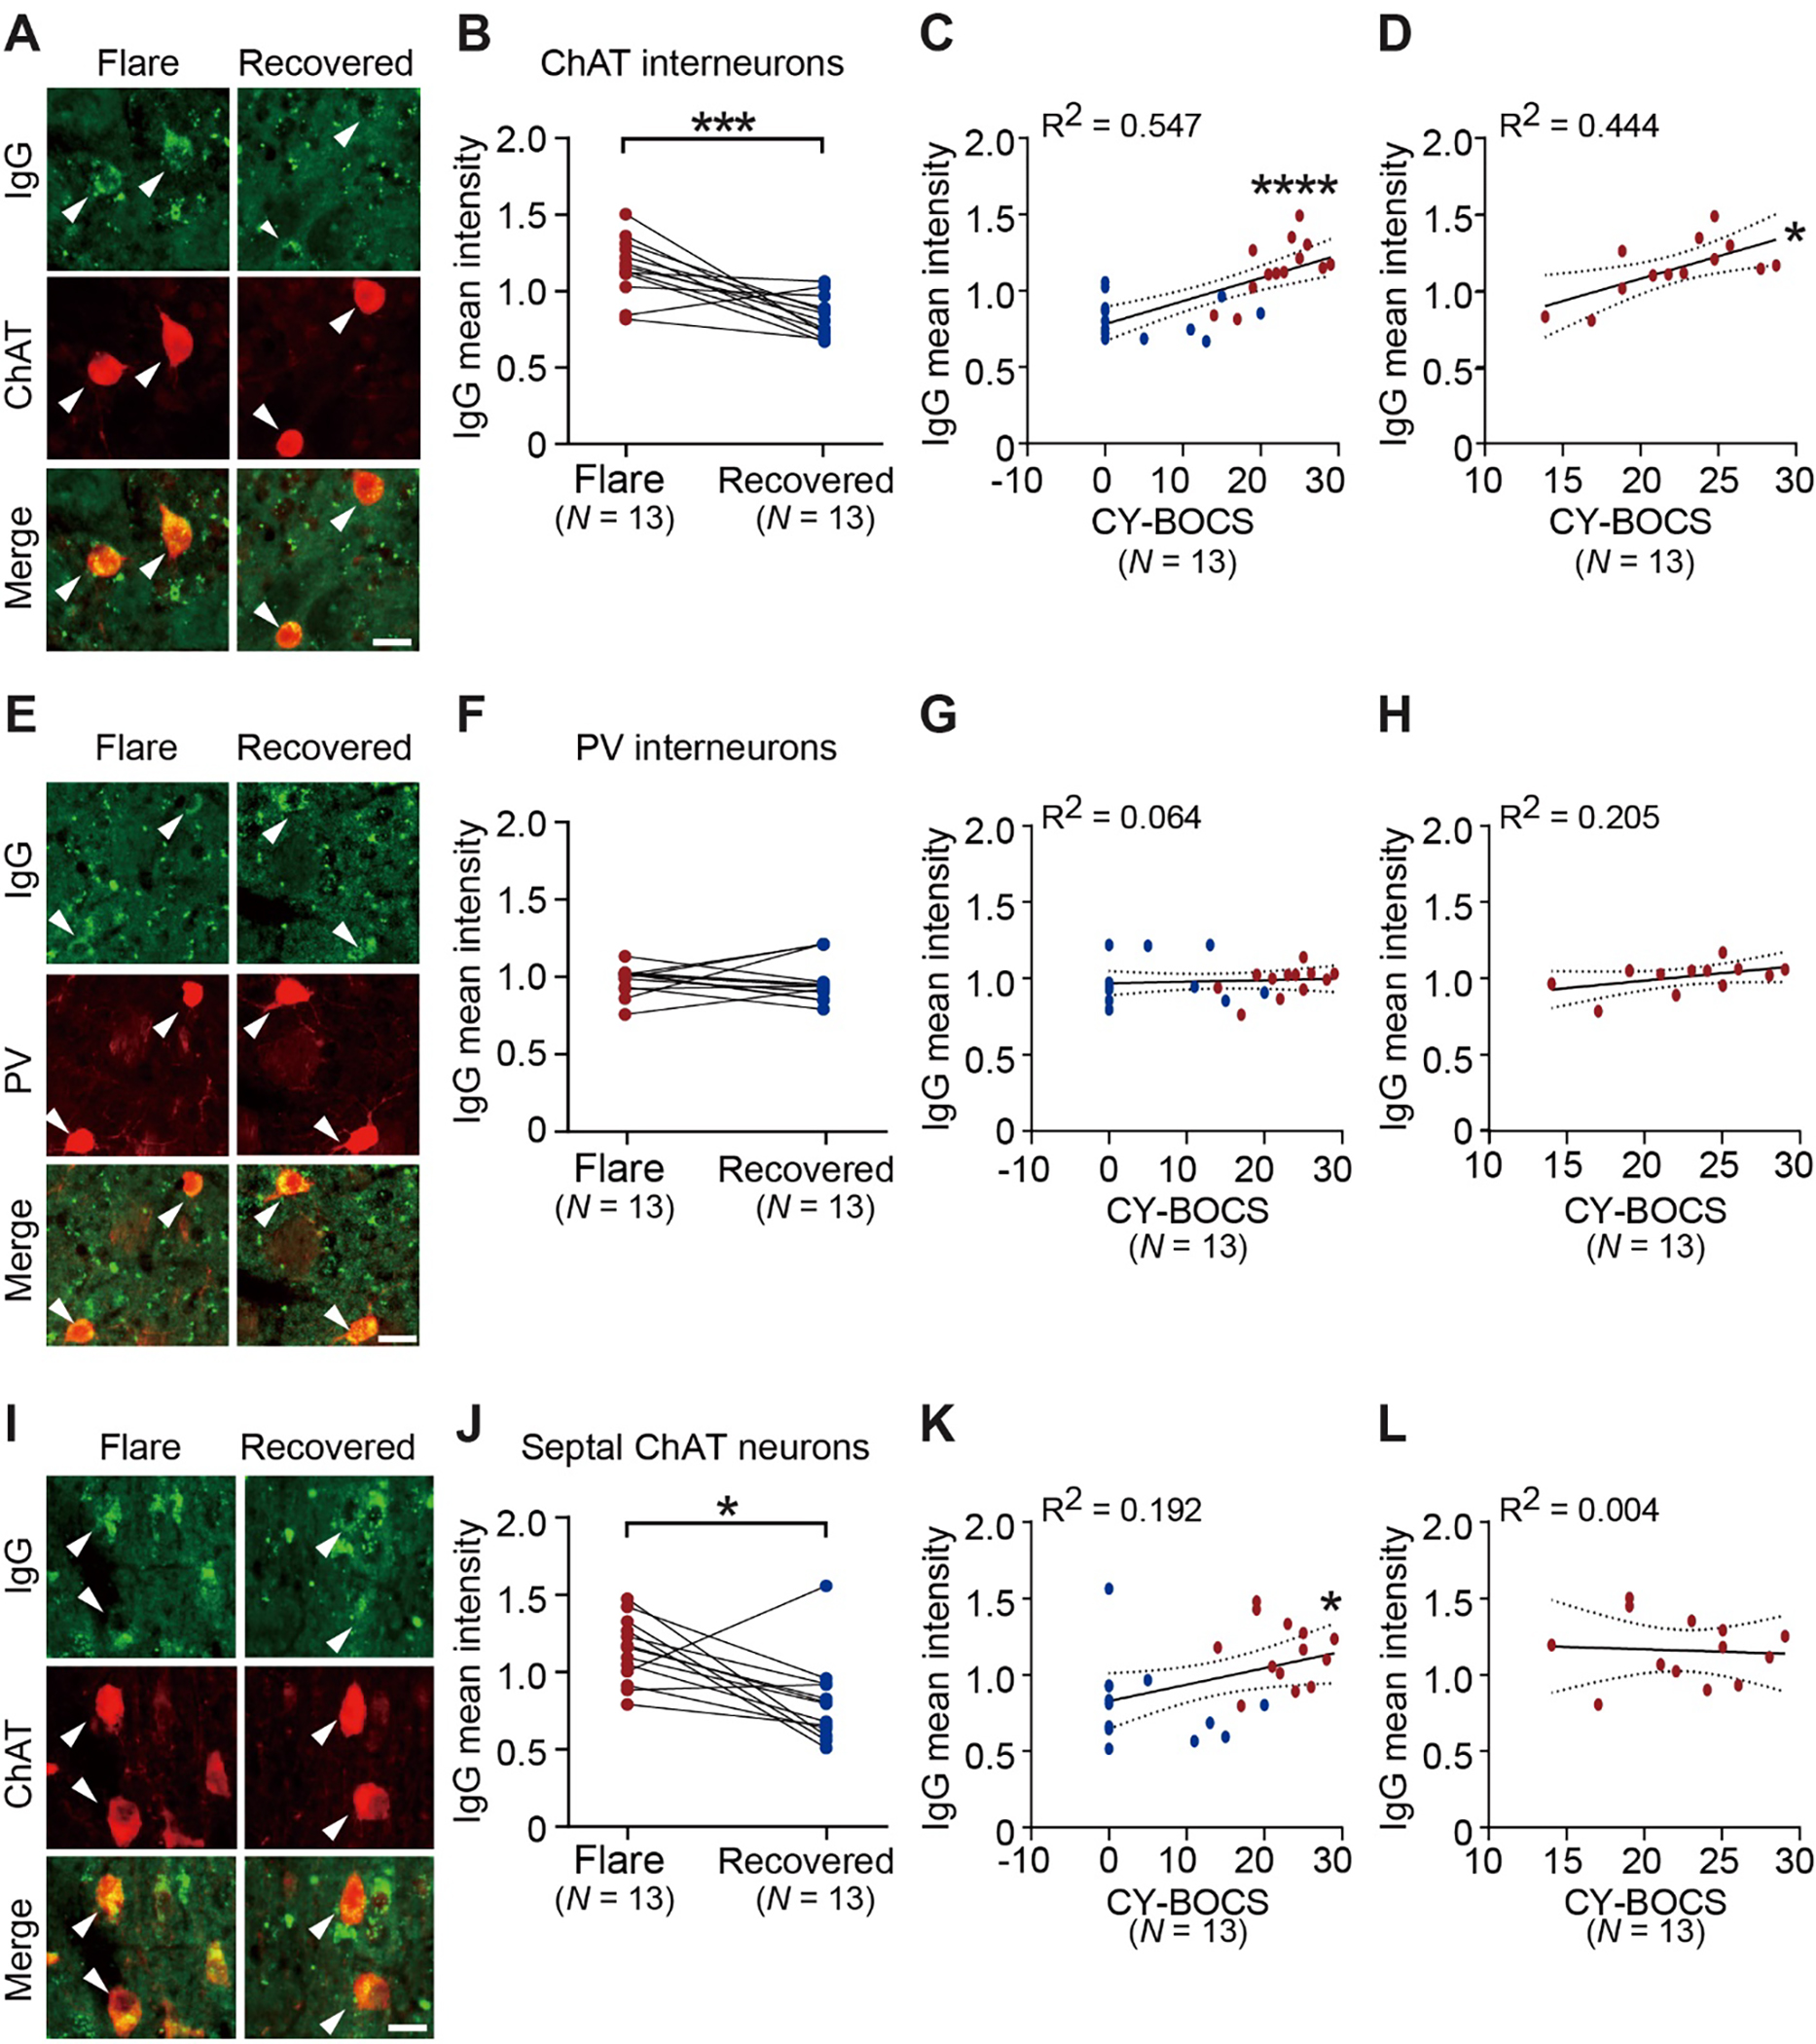
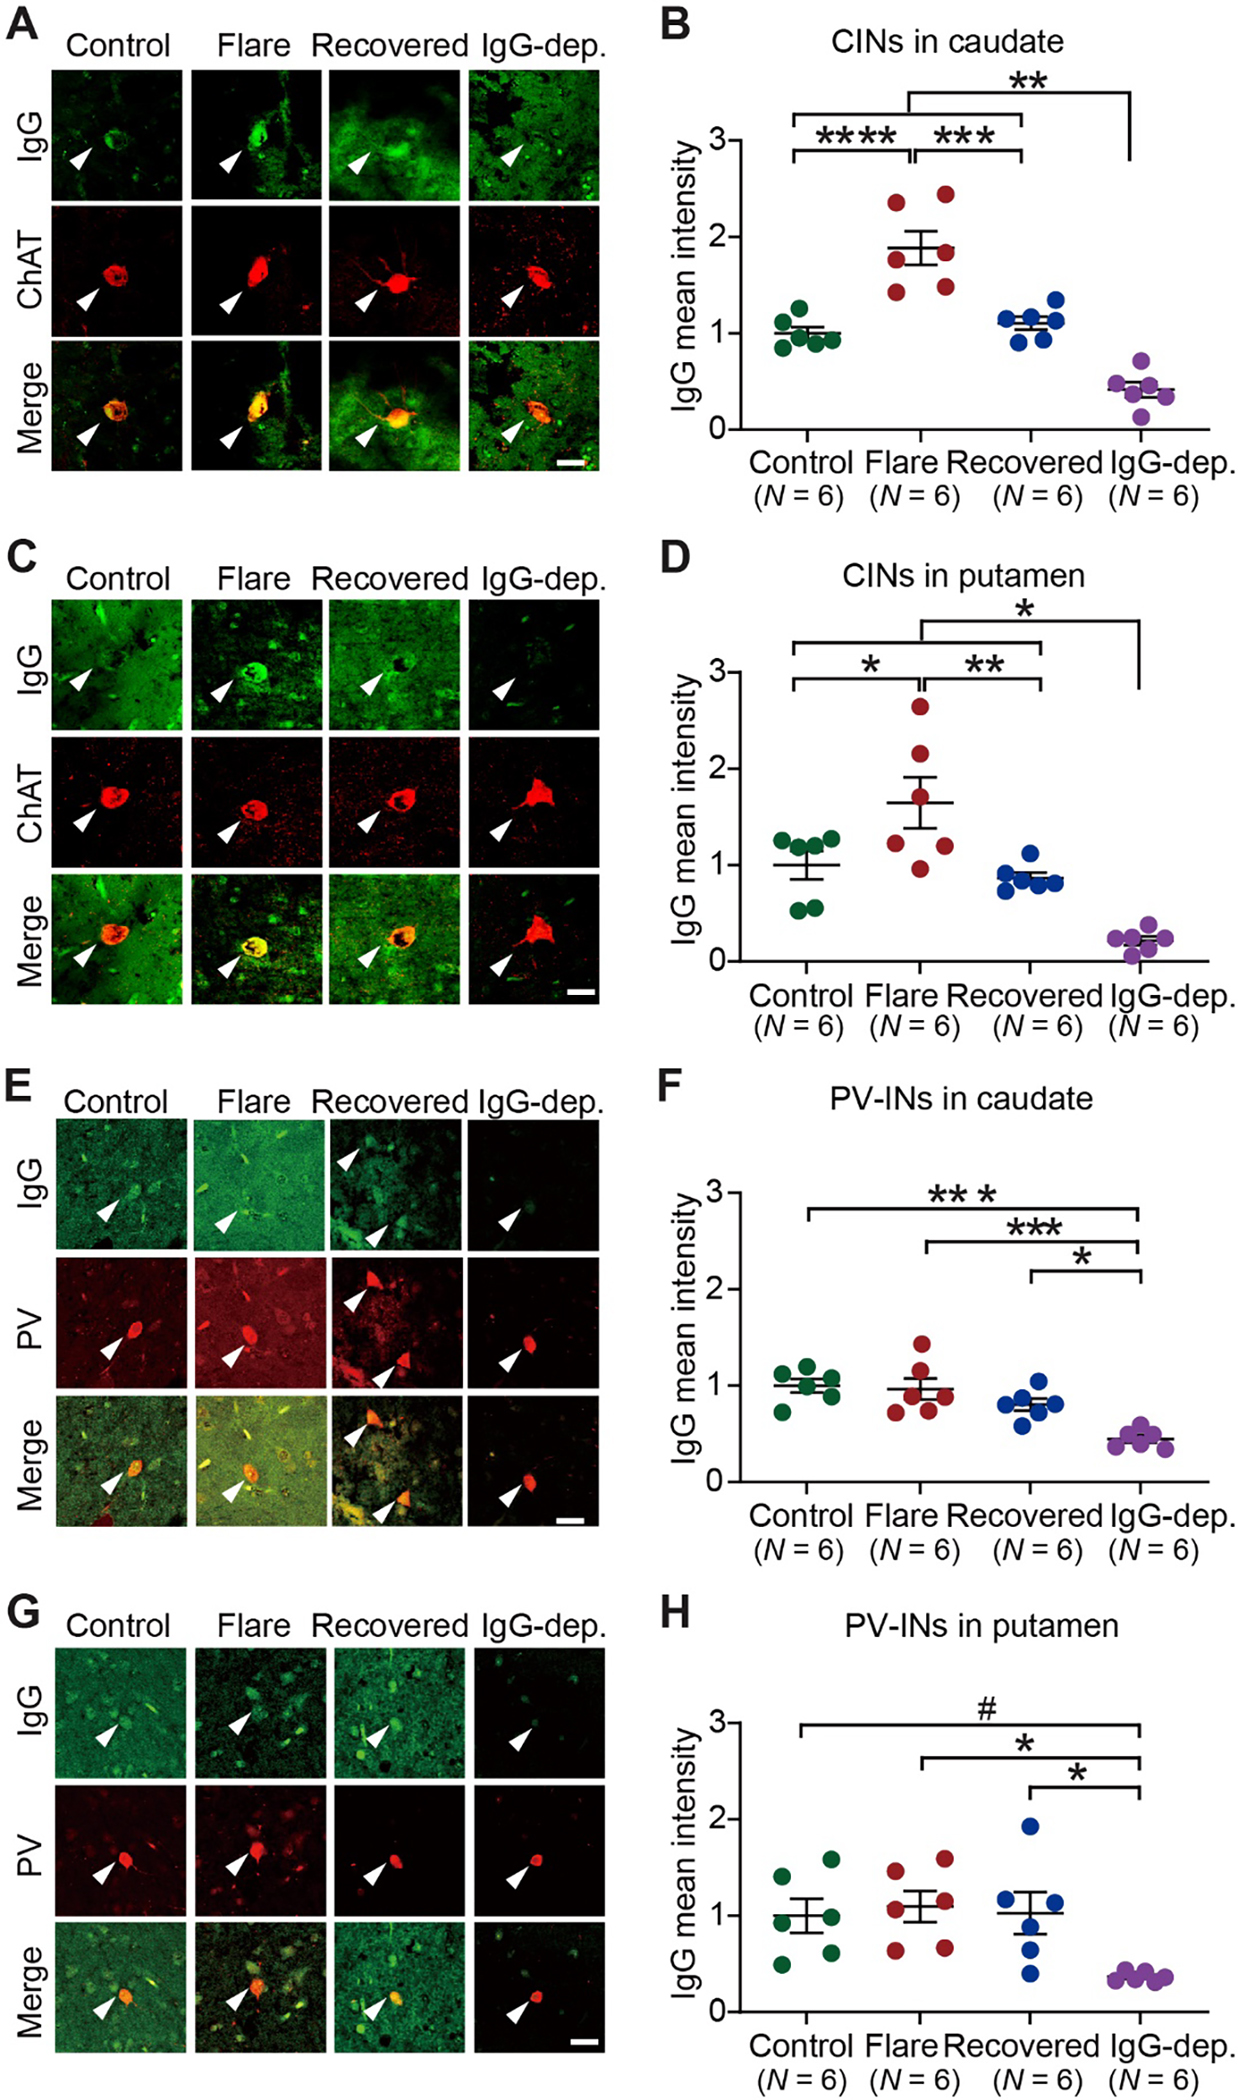
Pediatric Acute-onset Neuropsychiatric Syndrome (PANS) is characterized by the abrupt onset of significant obsessive-compulsive symptoms (OCS) and/or severe food restriction, together with other neuropsychiatric manifestations. An autoimmune pathogenesis triggered by infection has been proposed for at least a subset of PANS. The older diagnosis of Pediatric Autoimmune Neuropsychiatric Disorder Associated with Streptococcus (PANDAS) describes rapid onset of OCD and/or tics associated with infection with Group A Streptococcus. The pathophysiology of PANS and PANDAS remains incompletely understood. We recently found serum antibodies from children with rigorously defined PANDAS to selectively bind to cholinergic interneurons (CINs) in the striatum. Here we examine this binding in children with relapsing and remitting PANS, a more heterogeneous condition, collected in a distinct clinical context from those examined in our previous work, from children with a clinical history of Streptococcus infection. IgG from PANS cases showed elevated binding to striatal CINs in both mouse and human brain. Patient plasma collected during symptom flare decreased a molecular marker of CIN activity, phospho-riboprotein S6, in ex vivo brain slices; control plasma did not. Neither elevated antibody binding to CINs nor diminished CIN activity was seen with plasma collected from the same children during remission. These findings replicate what we have seen previously in PANDAS and support the hypothesis that at least a subset of PANS cases have a neuroimmune pathogenesis. Given the critical role of CINs in modulating basal ganglia function, these findings confirm striatal CINs as a locus of interest in the pathophysiology of both PANS and PANDAS.

Keywords: Antibody binding; Cholinergic interneurons; Dorsal striatum; Neuronal activity; OCD; PANDAS; PANS; Phospho-rpS6; Plasma autoantibodies.


Conflict of interest statement

Declaration of Competing Interest The authors declare the following financial interests/personal relationships which may be considered as potential competing interests: Dr. Pittenger has served as a consultant and received research funding in the past year for Biohaven Pharmaceuticals, Transcend Therapeutics, Ceruvia Lifesciecnes, Freedom Biosciences, and Nobilis Therapeutics, and royalties from Oxford University Press, all for work unrelated to the current results. He is an inventor on a patent applications related to the use of neurofeedback and of psychedelic drugs for the treatment of OCD, also unrelated to this work. Dr. Che has received research funding from Duraviva Pharma for work unrealted to the current results. All other authors report no competing interests. The authors have declared that no conflict of interest exists.

Figures

Fig. 1.
Fig. 1.. Elevated binding of PANS IgG to striatal cholinergic interneurons in adult mouse brains.
A. Representative images of immunohistochemical staining for human IgG (green) and choline acetyltransferase (ChAT, red) after incubation of mouse brain slices with diluted PANS flare and control plasmas. Arrowheads indicate human IgG binding to ChAT-positive interneurons in the mouse striatum. B. IgG from PANS “flare” plasmas showed elevated binding to ChAT interneurons relative to IgG from control plasmas (2-tailed independent sample t-test: t[48] = 3.263, p = 0.002; Cohen’s d = 0.922). C. Representative images of immunohistochemical staining of human IgG (green) and parvalbumin (PV, red). Arrowheads indicate human IgG binding to PV-positive interneurons. D. Plasma IgG binding to PV interneurons did not significantly differ between PANS “flare” and control groups (2-tailed independent sample t-test: t[48] = 1.915, p = 0.061). E. Representative images of immunohistochemical staining of human IgG (green) and choline acetyltransferase (ChAT, red) in the medial septal nuclei. Arrowheads indicate human IgG binding to ChAT-positive neurons. F. Plasma IgG binding to septal ChAT neurons did not significantly differ between PANS “flare” and controls (2-tailed independent sample t-test: t[48] = 1.627, p = 0.110). Data are shown as mean ± S.E.M. Each data point represents the mean value obtained from 6 mice treated with a single plasma. **p < 0.01; Numbers in parentheses indicate sample size.. Scale bars: 20 μm.
Fig. 2.
Fig. 2.. IgG binding to cholinergic interneurons in adult mouse brain is reduced in plasmas drawn from PANS subjects during symptom recovery.
A. Representative images of immunohistochemical staining of human IgG (green) and choline acetyltransferase (ChAT, red) in the mouse striatum. Arrowheads indicate human IgG binding to ChAT-positive interneurons. B. IgG binding to ChAT interneurons was decreased during symptom recovery, relative to plasma collected during symptom flare (paired t-test: t[12] = 4.534, p = 0.0007; Cohen’s d = 1.258). C. IgG binding to striatal ChAT interneurons correlated with CY-BOCS scores (Spearman’s correlation: R2 = 0.547, p < 0.0001) in all the cases shown in B. D. PANS “flare” IgG binding to striatal ChAT interneurons correlated with CY-BOCS scores (Pearson’s correlation: R2 = 0.444, p = 0.013). E. Representative images of immunohistochemical staining of human IgG (green) and parvalbumin (PV, red). Arrowheads indicate human IgG binding to PV-positive interneurons. F. IgG binding to PV interneurons did not differ between PANS “flare” and “recovered” groups (Wilcoxon paired signed-rank test: W = −3, p = 0.946). G. IgG binding to striatal PV interneurons did not correlate with CY-BOCS scores (Spearman’s correlation: R2 = 0.064, p = 0.202). H. PANS “flare” IgG binding to striatal PV interneurons did not correlate with CY-BOCS scores (Pearson’s correlation: R2 = 0.205, p = 0.121). I. Representative images of immunohistochemical staining of human IgG (green) and choline acetyltransferase (ChAT, red). Arrowheads indicate human IgG binding to ChAT-positive neurons in the medial septum (septal ChAT neurons). J. IgG binding to septal ChAT neurons was decreased in the “recovered” samples relative to PANS “flare” (Wilcoxon paired signed-rank test: W = −69, p = 0.013; r(equivalent) = 0.473). K. Across all samples, IgG binding to septal ChAT neurons showed a slight but significant correlation with CY-BOCS scores (Spearman’s correlation: R2 = 0.192, p = 0.025). L. PANS “flare” IgG binding to septal ChAT neurons did not correlate with CY-BOCS scores (Pearson’s correlation: R2 = 0.004, p = 0.833). Data are shown as mean ± S.E.M. Each data point represents mean value obtained from 6 mice for each plasma. *p < 0.05, ***p < 0.001, ****p < 0.0001; Numbers in parentheses indicate sample size. Dotted lines in correlation analyses (C, D, G, H, K and L) indicate 95% confidence intervals. Scale bars: 20 μm.
Fig. 3.
Fig. 3.. PANS IgG shows elevated binding to cholinergic interneurons in human brain slices.
A, C. Representative images of immunohistochemical staining of human IgG (green) and choline acetyltransferase (ChAT, red) in human caudate (A) and putamen (C). Arrowheads indicate human IgG binding to CINs. See Figs S6 and S7 for additional images. B, D. PANS “flare” IgG showed elevated binding to CINs in human caudate and putamen. In caudate (B), a significant main effect was found (one-way ANOVA: F(3, 20) = 32.16, p < 0.0001, η2 = 0.828). Tukey’s post hoc tests revealed elevated IgG binding in the PANS “flare” group relative to the control group (Control vs Flare, p < 0.0001). This elevation was reversed in the “recovered” group (Flare vs Recovered, p = 0.0002). No difference was found between control and “recovered” samples (Control vs Recovered, p = 0.930). All three group showed higher IgG fluorescence intensity relative to PANS “flare” plasmas from which IgG was depleted (p < 0.01). In putamen (D), a significant main effect was found (one-way ANOVA: F(3, 20) = 14.26, p < 0.0001, η2 = 0.681). Tukey’s post hoc tests revealed elevated IgG binding in the PANS “flare” group relative to the control group (Control vs Flare, p = 0.037). This elevation was lost in the “recovered” group (Flare vs Recovered, p = 0.010). No difference was found between the control and “recovered” groups (Control vs Recovered, p = 0.930). All three group showed higher IgG fluorescence intensity relative to PANS “flare” plasmas from which IgG was depleted (p < 0.05). E, G. Representative confocal images of immunohistochemical staining of human IgG (green) and parvalbumin (PV, red) in human caudate (E) and putamen (G). Arrowheads indicate human IgG binding to PV-positive interneurons. F, H. PANS “flare” IgG did not show elevated binding to PV-positive interneurons. In caudate (F), a significant main effect was found (one-way ANOVA: F(3, 20) = 11.42, p = 0.0001, η2 = 0.631). IgG binding in the PANS “flare” group did not differ from that of the control group (Control vs Flare, p = 0.987) or the “recovered” group (Flare vs Recovered, p = 0.445). No difference was found between the control and “recovered” groups (Control vs Recovered, p = 0.278). All three group showed higher IgG fluorescence intensity relative to PANS “flare” plasmas from which IgG was depleted (Control vs IgG-dep, p = 0.0002; Flare vs IgG-dep, p = 0.0005; Recovered vs IgG-dep, p = 0.015). In putamen (H), a significant main effect was found (F(3, 20) = 4.440, p = 0.0151, η2 = 0.400). IgG binding in the PANS “flare” group did not differ from that of the control group (Control vs Flare, p = 0.975), or the “recovered” group (Flare vs Recovered, p = 0.990). No difference was found between the control and “recovered” groups (Control vs Recovered, p = 0.999). All three group showed higher IgG fluorescence intensity relative to PANS “flare” plasmas from which IgG was depleted (Control vs IgG-dep, p = 0.052; Flare vs IgG-dep, p = 0.022; Recovered vs IgG-dep, p = 0.041). Data are shown as mean ± S.E.M. Each data point represents mean value obtained from 2 post-mortem human brains for each plasma. *p < 0.05, **p < 0.01, ***p < 0.001, ****p < 0.0001, #p = 0.052; Numbers in parentheses indicate sample size. Scale bars: 20 μm.
Fig. 4.
Fig. 4.. PANS plasma reduces spontaneous activity in striatal cholinergic interneurons.
Acute mouse striatal slices were treated with plasma from control subjects (Con), PANS “flare” (Flare), PANS “recovered” (Recov.), and PANS flare plasmas from which IgG was depleted (IgG-dep.). A. Representative images of immunohistochemical staining for phospho-rpS6 (p-rpS6, green) and choline acetyltransferase (ChAT, red). Arrowheads indicate p-rpS6/ChAT co-labeled ChAT interneurons. B. A significant main effect was found (F[3, 20] = 5.673, p = 0.0056, η2 = 0.460). Control plasma did not significantly alter p-rpS6 relative to vehicle (one-sample t-test: t[5] = 1.879, p = 0.119). PANS “flare” plasma reduced phosphorylation levels of rpS6 in striatal CINs compared to control, at trend level (Con vs Flare, p = 0.079). This reduction was not seen in “recovered” plasma from the same subjects (Flare vs Recov, p = 0.046), or after IgG depletion in PANS “flare” plasma (Flare vs IgG-dep, p = 0.004). p-rpS6 levels did not differ between the control, “recovered”, or IgG-depleted groups (Con vs Recov, p = 0.993; Con vs IgG-dep, p = 0.500; Recov vs IgG-dep, p = 0.664). C. p-rpS6 levels correlated negatively with plasma IgG binding to striatal CINs (shown in Fig. 1A,B and Fig. 2A,B) after plasma incubation (R2 = 0.547, p = 0.004). D. p-rpS6 levels in CINs correlated negatively with CY-BOCS scores after plasma incubation (R2 = 0.355, p = 0.045). E. For each PANS “flare”-“recovered” pair, the difference in IgG binding to striatal CINs (Fig. 2A,B) correlated negatively with difference in p-rpS6 levels after plasma incubation (R2=0.767, p = 0.022). F. Representative images of immunohistochemical staining of phospho-rpS6 (p-rpS6, green) and parvalbumin (PV, red) in striatal slices after plasma treatment. Arrowheads indicate p-rpS6/PV co-staining. G. p-rpS6 levels in striatal PV interneurons remained unchanged after plasma incubation (one-way ANOVA: F(3, 20) = 0.306, p = 0.821). H. p-rpS6 levels did not correlate with plasma IgG binding to PV interneurons (shown in Fig. 1C, D and Fig. 2C, D) after plasma incubation (R2 = 0.029, p = 0.499). I. p-rpS6 levels in PV interneurons did not correlate with CY-BOCS scores after plasma incubation (R2 = 0.072, p = 0.393). J. For each PANS “flare”-“recovered” pair, the difference in IgG binding to striatal PV interneurons did not correlate with change in p-rpS6 levels after plasma incubation (R2 = 0.101, p = 0.314). Data are shown as mean ± S.E.M. Each data point represents mean value obtained from slices from 5 mice treated with a single plasma. Pairwise comparisons were performed using Tukey’s post hoc test. *p < 0.05, **p < 0.01, #p = 0.079; Numbers in parentheses indicate sample size. Correlation was determined by linear regression analysis using Pearson’s correlation (C, E, H and J) or Spearman’s correlation (D and I). Dotted lines in correlation analyses (C-E and H-J) indicate 95% confidence intervals. Scale bars: 20 μm.

References

    1. Agmon-Levin N, Damoiseaux J, Kallenberg C, Sack U, Witte T, Herold M, Bossuyt X, Musset L, Cervera R, Plaza-Lopez A, Dias C, Sousa MJ, Radice A, Eriksson C, Hultgren O, Viander M, Khamashta M, Regenass S, Andrade LE, Wiik A, Tincani A, Rönnelid J, Bloch DB, Fritzler MJ, Chan EK, Garcia-De La Torre I, Konstantinov KN, Lahita R, Wilson M, Vainio O, Fabien N, Sinico RA, Meroni P, Shoenfeld Y, 2014. International recommendations for the assessment of autoantibodies to cellular antigens referred to as anti-nuclear antibodies. Ann Rheum Dis 73, 17–23. doi: 10.1136/annrheumdis-2013-203863 - DOI - PubMed
    1. Allen AJ, Leonard HL, Swedo SE, 1995. Case study: a new infection-triggered, autoimmune subtype of pediatric OCD and Tourette’s syndrome. J Am Acad Child Adolesc Psychiatry 34, 307–311. doi: 10.1097/00004583-199503000-00015 - DOI - PubMed
    1. Apicella P, 2007. Leading tonically active neurons of the striatum from reward detection to context recognition. Trends Neurosci 30, 299–306. doi: 10.1016/j.tins.2007.03.011 - DOI - PubMed
    1. Baschong W, Suetterlin R, Laeng RH, 2001. Control of autofluorescence of archival formaldehyde-fixed, paraffin-embedded tissue in confocal laser scanning microscopy (CLSM). J Histochem Cytochem 49, 1565–1572. doi: 10.1177/002215540104901210 - DOI - PubMed
    1. Ben-Pazi H, Stoner JA, Cunningham MW, 2013. Dopamine receptor autoantibodies correlate with symptoms in Sydenham’s chorea. PLoS One 8, e73516. doi: 10.1371/journal.pone.0073516 - DOI - PMC - PubMed

MeSH terms

Supplementary concepts