. 2024 Jul 31;7(10):e202402651.
doi: 10.26508/lsa.202402651. Print 2024 Oct.

Rit1-TBC1D10B signaling modulates FcγR-mediated phagosome formation in RAW264 macrophages

Affiliations

Rit1-TBC1D10B signaling modulates FcγR-mediated phagosome formation in RAW264 macrophages

Youhei Egami et al. Life Sci Alliance. .

Abstract

Phagocytosis is an important immune response that protects the host from pathogen invasion. Rit1 GTPase is known to be involved in diverse cellular processes. However, its role in FcγR-mediated phagocytosis remains unclear. Our live-cell imaging analysis revealed that Rit1 was localized to the membranes of F-actin-rich phagocytic cups in RAW264 macrophages. Rit1 knockout and expression of the GDP-locked Rit1 mutant suppressed phagosome formation. We also found that TBC1D10B, a GAP for the Rab family GTPases, colocalizes with Rit1 in the membranes of phagocytic cups. Expression and knockout studies have shown that TBC1D10B decreases phagosome formation in both Rab-GAP activity-dependent and -independent manners. Notably, the expression of the GDP-locked Rit1 mutant or Rit1 knockout inhibited the dissociation of TBC1D10B from phagocytic cups. In addition, the expression of the GTP-locked Rit1 mutant promoted the dissociation of TBC1D10B in phagocytic cups and restored the rate of phagosome formation in TBC1D10B-expressing cells. These data suggest that Rit1-TBC1D10B signaling regulates FcγR-mediated phagosome formation in macrophages.


Conflict of interest statement

The authors declare that they have no conflict of interest.

Figures

Figure 1.
Figure 1.. Rit1 is expressed in RAW264 cells and bone marrow–derived macrophages.
(A) RT–PCR analysis of Rit1 mRNA expression in RAW264 cells, bone marrow–derived macrophages, NIH3T3 cells, and C2C12 myoblasts was conducted. GAPDH mRNA was used as an internal control. Similar results were obtained from three independent experiments. (B) Comparison of Rit1 protein levels in RAW264 cells, bone marrow–derived macrophages, NIH3T3 cells, and C2C12 myoblasts. Rit1 protein was detected by Western blotting using an anti-Rit1 antibody. GAPDH was used as an internal control for normalization. Notably, Rit1 is expressed in RAW264 cells and bone marrow–derived macrophages.
Figure 2.
Figure 2.. GFP-Rit1 is localized to membranes that form phagosomes during FcγR-mediated phagocytosis.
RAW264 cells transfected with GFP-Rit1 were exposed to IgG-Es and observed by laser confocal microscopy. The upper panels show the phase-contrast images. The elapsed time is indicated at the top of the figure. The binding of IgG-Es to the cell surface, marked by squares, was set as time 0. It is noteworthy that Rit1 is associated with membranes that form phagosomes (t = 3 min). Between 0 and 30 phagosomes per cell were observed. The insets show higher-magnification images of the boxed regions of the cells. The upper and lower panels show representative images from four independent experiments. The corresponding video is shown in Video 1. Scale bar: 10 μm.
Figure 3.
Figure 3.. Rit1 and F-actin colocalize in phagocytic cups.
Live RAW264 macrophages co-expressing TagRFP-Rit1 and GFP-LifeAct were put into contact with IgG-Es and observed by confocal microscopy. The top panels show the phase-contrast images. The elapsed time is indicated at the top. TagRFP-Rit1 and GFP-LifeAct colocalized at the phagocytic cup (t = 3 min). Subsequently, both proteins were detached from the membranes of the newly formed phagosomes. Between 0 and 30 phagosomes per cell were observed. Images are representative of three independent experiments. The corresponding video is shown in Video 2. Scale bar: 10 μm.
Figure 4.
Figure 4.. Expression of the GDP-bound mutant Rit1-S35N inhibits phagosome formation.
To quantify FcγR-dependent phagosome formation, RAW264 cells transiently expressing GFP (mock), GFP-Rit1-WT, GFP-Rit1-Q79L, or GFP-Rit1-S35N were incubated with IgG-Es for 20 min at 37°C. The cells on the coverslips were fixed after disruption of extracellularly exposed IgG-Es. The efficiency of IgG-E engulfment (gray bars) was calculated based on 50 transfected and 50 untransfected cells. The results are presented as the percentage of control (untransfected) cells. The mean ± SEM of four independent replicates is plotted. Note the inhibition of phagosome formation in cells transfected with the GDP-bound mutant of Rit1. For the binding assay, RAW264 cells expressing the indicated proteins were incubated with IgG-Es for 30 min at 4°C. After brief washing in PBS, the cells on the coverslips were fixed. The efficiency of IgG-E binding to cells (open bars) was calculated. The data are presented as the mean ± SEM of three independent replicates. *P < 0.05, compared with GFP-transfected cells (mock) (one-way ANOVA followed by Dunnett’s test).
Figure 5.
Figure 5.. Depletion of endogenous Rit1 suppresses FcγR-mediated phagocytosis.
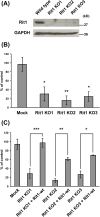
(A) RAW264 macrophages transfected with pSpCas9(BB)-2A-puro-Rit1 encoding Cas9 protein and gRNA for Rit1 were diluted and selected as single clones with puromycin. The knockout of the Rit1 protein was validated by Western blotting analysis using an antibody against Rit1. GAPDH was used as the internal control. (B) The efficiency of IgG-E uptake was calculated based on 50 cells knocked out for Rit1 and 50 cells transfected with pSpCas9(BB)-2A-puro plasmid (mock) or 50 untransfected (control) cells. The results are displayed as the mean ± SEM percentage compared with control cells for three independent replicates. *P < 0.05; **P < 0.01 compared with mock-transfected cells (one-way ANOVA followed by Dunnett’s test). (C) The efficiency of phagosome formation was calculated based on cells knocked out for Rit1, Rit1-KO cells overexpressing GFP-Rit1-WT, and pSpCas9n(BB)-2A-puro (mock) transfected or untransfected (control) cells. The number of internalized IgG-Es in 50 cells was counted in each replicate. The results are presented as the mean ± SEM of four independent replicates. It is noteworthy that the decrease in phagosome formation in Rit1-KO cells was rescued by overexpression of Rit1-WT. ***P < 0.001 compared with Rit1-KO1 cells. **P < 0.01 compared with Rit1-KO2 cells. *P < 0.05, compared with Rit1-KO3 cells (one-way ANOVA followed by Tukey’s test).
Figure S1.
Figure S1.. Expression of Rit1-WT or GTP-bound mutant Rit1-Q79L but not defective PM-targeting mutants Rit1-WT-W204A or Rit1-Q79L-W204A, restores phagosome formation.
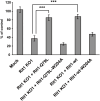
The efficiency of phagosome formation was calculated based on Rit1-KO cells, Rit1-KO cells expressing GFP-Rit1-WT, Rit1-Q79L, Rit1-WT-W204A or Rit1-Q79L-W204A, and pSpCas9n(BB)-2A-puro (mock) transfected cells or untransfected (control) cells. The number of internalized IgG-Es in 50 cells was counted in each replicate. The results are the means ± SEM of four independent replicates. ***P < 0.001 versus corresponding Rit1-KO cells (one-way ANOVA followed by Tukey’s test).
Figure 6.
Figure 6.. Localization of TBC1D10A, TBC1D10B, and TBC1D10C during FcγR-mediated phagocytosis.
(A, B, C) Live RAW264 cells transfected with GFP-TBC1D10A (A), GFP-TBC1D10B (B), and GFP-TBC1D10C (C) were allowed to interact with IgG-Es. Time-lapse images of cells expressing each construct indicated were acquired by confocal microscopy. Phase-contrast images are shown in the upper panels. The elapsed time is shown at the top of the figure. Notably, TBC1D10B accumulates intensely in the membranes of forming phagosomes (t = 10 min, (B)). RAW264 cells transfected with GFP-TBC1D10A exhibited between 0 and 6 phagosomes per cell. For cells transfected with GFP-TBC1D10B, between 0 and 3 phagosomes per cell were observed. Cells expressing GFP-TBC1D10C showed between 0 and 8 phagosomes per cell. The upper and lower panels are representative images from four independent experiments. Scale bar: 5 μm. (D) Quantification of the recruitment levels of TBC1D10A, TBC1D10B, and TBC1D10C at the phagocytic cup. Maximum values of fluorescence intensity were measured at the phagocytic cup in each cell transfected with GFP-TBC1D10A, GFP-TBC1D10B, GFP-TBC1D10C, or GFP (Mock). The fluorescence intensity of GFP-TBC1D10A, GFP-TBC1D10B, GFP-TBC1D10C, and GFP was normalized to that of a region in the cytoplasm. Values represent the mean ± SEM of three independent replicates (n = 3; 30 phagocytic cups in more than five cells in each condition were assessed per replicate). *P < 0.05; ***P < 0.001 versus corresponding GFP-transfected cells (mock) (one-way ANOVA followed by Dunnett’s test).
Figure 7.
Figure 7.. Effect of TBC1D10A, TBC1D10B, and TBC1D10C expression on FcγR-mediated phagosome formation.
RAW264 macrophages expressing each construct indicated were incubated with IgG-Es. The efficiency of phagosome formation (gray bars) and IgG-E binding (open bars) was calculated based on 50 transfected cells and 50 non-transfected cells. The results were expressed as a percentage of control (non-transfected) cells. The data shown are the mean ± SEM of three independent experiments. ***P < 0.001 versus corresponding mock-transfected cells (one-way ANOVA followed by Dunnett’s test). The expression of TBC1D10A-WT, TBC1D10B-WT, and TBC1D10C-WT has an inhibitory effect on IgG-E uptake. Notably, inhibition of phagosome formation was also found in cells expressing the GAP activity–deficient mutant TBC1D10B-R395A.
Figure 8.
Figure 8.. TBC1D10B-KO promotes phagosome formation.
(A) RAW264 cells were transfected with pSpCas9n(BB)-2A-puro-TBC1D10B encoding Cas9 protein and gRNA for TBC1D10B. Transfected cells were diluted and selected as single clones using puromycin. The depletion of TBC1D10B protein was confirmed by Western blot analysis using an antibody against TBC1D10B. GAPDH protein was used as an internal control. (B) Efficiency of IgG-E uptake was calculated based on 50 TBC1D10B-KO cells and 50 cells transfected with pSpCas9n(BB)-2A-puro plasmid (mock) or 50 non-transfected (control) cells. The results are shown as the mean ± SEM percentage compared with control cells for four independent experiments. *P < 0.05, compared with mock-transfected cells (t test).
Figure 9.
Figure 9.. Time-lapse imaging showing localization of TBC1D10B and Rit1during FcγR-mediated phagocytosis.
Time-lapse images of FcγR-mediated phagocytosis in cells co-expressing GFP-TBC1D10B-WT (green) and TagRFP-Rit1-WT (red) were acquired by confocal microscopy. TBC1D10B and Rit1 transiently colocalized at the membrane of phagocytic cups (arrows). Arrowheads indicate newly internalized phagosomes. Representative images are shown. The corresponding video is shown in Video 3. Scale bar: 10 μm.
Figure S2.
Figure S2.. The effect of TBC1D10A, TBC1D10B, and TBC1D10C expression on the activation levels of Rit1.
(A) COS-7 cells were co-transfected with either GFP-TBC1D10B-WT and Flag-Rab35-WT, GFP-TBC1D10B-R395A and Flag-Rab35-WT, or GFP and Flag-Rab35-WT. Cell lysates were prepared and incubated with GST–ANKR. Proteins associated with GST–ANKR were pulled down using Glutathione Sepharose beads. GTP-Rab35 (top panel), total Rab35 (second panel), and GFP fusion proteins (third panel) were detected by immunoblotting. The arrowhead indicates a nonspecific band. GST–ANKR was stained with Ponceau S (bottom panel). (B) COS-7 cells were co-transfected with Myc-Rit1-WT and each indicated plasmid. Glutathione Sepharose beads coupled with GST–RGL3 were incubated with cell lysates. Proteins bound to the beads were analyzed by Western blotting. GTP-Rit1(top panel), total Rit1(second panel), and GFP fusion protein (third panel) are shown. GST–RGL3 was stained with Ponceau S (bottom panel). The expression of TBC1D10A, TBC1D10B, and TBC1D10C did not affect Rit1 activation. Similar results were obtained from three independent experiments.
Figure 10.
Figure 10.. Expression of the GTP-bound mutant Rit1-Q79L promotes TBC1D10B dissociation from phagocytic cups and restores TBC1D10B-mediated inhibition of phagosome formation.
(A, B) Time-lapse images of cells co-expressing GFP-TBC1D10B-WT (green) and TagRFP-Rit1-S35N (red) (A), and Rit1-KO cells expressing GFP-TBC1D10B-WT (B) were acquired by confocal microscopy. During FcγR-mediated phagocytosis, TBC1D10B remained associated with phagocytic cups for a long time in cells expressing Rit1-S35N or Rit1-KO cells. Scale bar: 10 μm. (C) RAW264 cells were co-transfected with GFP-TBC1D10B-WT (green) and TagRFP-Rit1-Q79L (red), allowed to contact with IgG-Es, and observed by confocal microscopy. Scale bar: 10 μm. (D) Quantification of the dissociation time of TBC1D10B from the phagosomal membrane during phagosome formation. Live RAW264 cells expressing GFP-TBC1D10B-WT (control) or co-expressing GFP-TBC1D10B-WT and TagRFP-Rit1-Q79L were observed by microscopy. The GFP-TBC1D10B fluorescence intensity at the phagosomal membrane was measured. The fluorescence intensity of GFP-TBC1D10B was normalized by dividing it by the value of the fluorescence intensity of a region in the cytoplasm. We calculated the duration of time (s) during which the normalized values at the phagosomal membrane remained greater than 1. Values represent the mean ± SEM of three independent replicates (n = 3; 20 IgG-Es binding sites in more than five cells in each condition were assessed per replicate). **P < 0.01 compared with control transfected cells (Student’s test). (E) RAW264 cells transfected with TBC1D10B and/or Rit1 construct(s) were incubated with IgG-Es. The efficiency of phagosome formation was calculated based on 50 transfected and 50 non-transfected (control) cells. The results are expressed as the mean ± SEM percentage comp43ared with control cells for four independent experiments. **P < 0.01; ***P < 0.001 versus corresponding mock-transfected cells. ##P < 0.01; ###P < 0.001 versus the corresponding cells transfected with TBC1D10B-WT. †††P < 0.001 versus corresponding cells transfected with TBC1D10B-R395A (one-way ANOVA followed by Tukey’s test).

Similar articles

References

    1. Araki N, Johnson MT, Swanson JA (1996) A role for phosphoinositide 3-kinase in the completion of macropinocytosis and phagocytosis by macrophages. J Cell Biol 135: 1249–1260. 10.1083/jcb.135.5.1249 - DOI - PMC - PubMed
    1. Araki N, Hatae T, Furukawa A, Swanson JA (2003) Phosphoinositide-3-kinase-independent contractile activities associated with fcgamma-receptor-mediated phagocytosis and macropinocytosis in macrophages. J Cell Sci 116: 247–257. 10.1242/jcs.00235 - DOI - PubMed
    1. Cai W, Andres DA (2014) Mtorc2 is required for rit-mediated oxidative stress resistance. PLoS One 9: e115602. 10.1371/journal.pone.0115602 - DOI - PMC - PubMed
    1. Campellone KG, Welch MD (2010) A nucleator arms race: Cellular control of actin assembly. Nat Rev Mol Cell Biol 11: 237–251. 10.1038/nrm2867 - DOI - PMC - PubMed
    1. Chesneau L, Dambournet D, Machicoane M, Kouranti I, Fukuda M, Goud B, Echard A (2012) An arf6/rab35 gtpase cascade for endocytic recycling and successful cytokinesis. Curr Biol 22: 147–153. 10.1016/j.cub.2011.11.058 - DOI - PubMed

LinkOut - more resources