. 2024 Jul 31;15(1):6443.
doi: 10.1038/s41467-024-50472-0.

Single-cell profiling identifies a CD8bright CD244bright Natural Killer cell subset that reflects disease activity in HLA-A29-positive birdshot chorioretinopathy

Affiliations

Single-cell profiling identifies a CD8bright CD244bright Natural Killer cell subset that reflects disease activity in HLA-A29-positive birdshot chorioretinopathy

Pulak R Nath et al. Nat Commun. .

Abstract

Birdshot chorioretinopathy is an inflammatory eye condition strongly associated with MHC-I allele HLA-A29. The striking association with MHC-I suggests involvement of T cells, whereas natural killer (NK) cell involvement remains largely unstudied. Here we show that HLA-A29-positive birdshot chorioretinopathy patients have a skewed NK cell pool containing expanded CD16 positive NK cells which produce more proinflammatory cytokines. These NK cells contain populations that express CD8A which is involved in MHC-I recognition on target cells, display gene signatures indicative of high cytotoxic activity (GZMB, PRF1 and ISG15), and signaling through NK cell receptor CD244 (SH2D1B). Long-term monitoring of a cohort of birdshot chorioretinopathy patients with active disease identifies a population of CD8bright CD244bright NK cells, which rapidly declines to normal levels upon clinical remission following successful treatment. Collectively, these studies implicate CD8bright CD244bright NK cells in birdshot chorioretinopathy.


Conflict of interest statement

The authors declare competing interests.

Figures

Fig. 1
Fig. 1. Flow-cytometry profiling revealed altered Natural killer (NK) cell composition in peripheral blood of birdshot uveitis.
A Schematic representation of flow cytometry of major immune cell lineages in fresh peripheral blood of 139 uveitis patients (UV) and 80 age-, sex-matched healthy controls (HC). Figure is created with BioRender.com (www.biorender.com), released under a Creative Commons Attribution-NonCommercial-NoDerivs 4.0 International license. B Flow-cytometry quantification of the percentage of NK cells in the peripheral blood of uveitis patients (Uveitis) compared to healthy controls (Healthy). Healthy n = 80; Uveitis n = 139. ***P = 0.0006. Data are presented as mean values ± SEM. Source data are provided as a Source Data file. C Flow-cytometry analysis of NK cells (CD3-CD19-CD56+) in the fresh blood of different uveitis subgroups indicate the significant expansion of NK cells were restricted to birdshot, definite sarcoidosis and serpiginous sub-groups of uveitis cohort. Values are presented in the form of box and whiskers plot and represent medians with ranges (Whiskers: two-sided Tukey test). Healthy n = 80; Uveitis n = 139; WDS n = 18; Birdshot n = 18; VKH n = 15; Definite Sarcoidosis n = 8; Presumed Sarcoidosis n = 8; Serpiginous n = 7; Undifferentiated n = 65. P values are from non-parametric Mann–Whitney U test, ****P < 0.0001, ***P = 0.0006, **P = 0.004, *P = 0.02. WDS, White Dot Syndromes; VKH, Vogt–Koyanagi–Harada disease. Source data are provided as a Source Data file. D The flow-cytometry gating strategy for CD56bright and CD56dim subsets of NK cells using CD56 and CD16 in peripheral blood. E NK cell and CD56bright and CD56dim subset quantification in peripheral blood of birdshot uveitis (BCR-UV) and age-matched healthy controls (HC). HC n = 15; BCR-UV n = 18. P values are from two-sided unpaired t test, ***P = 0.0004, **P = 0.002, *P = 0.01. Data are presented as mean values ± SEM. Source data are provided as a Source Data file. F The fluorescence intensity of TNF and IFN-γ produced by all NK cells, as determined by flow cytometry analysis upon stimulation with Lymphocyte Activation Cocktail (BD Biosciences). Analysis was conducted by stimulating PBMCs and flow-gating on NK cells from BCR-UV (red) and healthy controls (HC, blue). HC n = 8; BCR-UV n = 8. Statistical analysis was done using one-way ANOVA- Tukey’s multiple comparisons test; P values are indicated above the histograms. Source data are provided as a Source Data file.
Fig. 2
Fig. 2. Single-cell RNAseq analysis identifies transcriptional NK cell subsets.
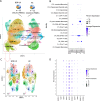
A UMAP plot of 306,425 PBMCs from 12 birdshot uveitis patients (BCR-UV) and 12 healthy controls (HC). The identified lineage clusters are highlighted (color-coded). B Dot plot showing the expression profile of NK surface marker-encoding genes across the annotated cell clusters identified in A. C UMAP plots of NK cells gated from the C4_Natural Killer cells cluster in A comparing NK subclusters in BCR-UV and HC. The 12 transcriptional NK cell subclusters are color-coded. D Dot plot showing the expression profile of NK surface marker encoding genes in each of the subclusters as identified in C.
Fig. 3
Fig. 3. Single-cell RNAseq analysis delineates NK cell subsets associated with birdshot uveitis.
A A total of 306,425 PBMCs from 12 birdshot uveitis patients (BCR-UV) and 12 healthy controls (HC) are analyzed by single-cell RNAseq. Dot plot shows two-sided proportion test analysis of NK cell clusters gated from the C4_Natural Killer cells cluster in Fig. 2A and comparing between BCR-UV and HC. Significant differences at a false discovery rate of 5% [FDR < 0.05] and log2 fold difference = [Log2(FD)], are indicated in red. The data points represent log2 fold difference, with error bars showing the estimated 95% confidence interval, based on the distribution of bootstrapped log2 fold differences. B Heatmap of the gene expression profile of highly expressed genes (n = 10 unique genes) in clusters 1, 2, 6, and 10 of NK cells as identified in A.
Fig. 4
Fig. 4. CD244bright CD8bright NK cell subset is significantly expanded in peripheral blood of birdshot uveitis patients.
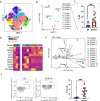
A t-SNE plot of flow cytometry data from Healthy control (HC) n = 11, birdshot uveitis (BCR-UV) n = 18. Clusters identified by FlowSOM analysis (n = 12 clusters) are shown. B Comparison of the frequency of NK clusters between BCR-UV and Healthy controls. The -log10 (nominal P values) are from a two-sided likelihood ratio test. Significantly different clusters 0, 4, and 5 are highlighted. Source data are provided as a Source Data file. C Scatter plot of the frequency of cells of cluster 0 in peripheral blood in patients versus controls. HC n = 11, BCR-UV n = 18. ***P = 0.002. Data are presented as mean values ± SEM. Source data are provided as a Source Data file. D Heatmap showing the mean fluorescent intensity (MFI) of surface markers in NK clusters. Source data are provided as a Source Data file. E Principal component analysis (PCA) of NK clusters based on expression of surface markers. Source data are provided as a Source Data file. F Representative dot plots and corresponding frequency of CD8a+CD244+ NK cells in the peripheral blood of Healthy controls (HC, blue) and birdshot uveitis patients (BCR-UV, red). HC, n = 10; BCR-UV, n = 15. Statistical comparison is done using two-sided unpaired t test. ***P = 0.0003. Data are presented as mean values ± SEM. Source data are provided as a Source Data file.
Fig. 5
Fig. 5. IL-15/IL-18-mediated stimulation increased CD244 expression in NK cells and CD8 + NK cells birdshot uveitis patients show elevated activation profile.
A Histograms of the surface expression of CD69 and CD244, after 48 hrs stimulation of isolated peripheral blood NK cells from healthy donors. with recombinant human IL-15, IL-18 and CXCL-16 proteins. n = 3 B Frequencies of TNF and IFN-γ producing CD8+ NK cells, as determined by flow cytometry analysis upon stimulation with Lymphocyte Activation Cocktail (BD Biosciences). Analysis was conducted using PBMCs from BCR-UV (red) and NK cells from healthy controls (HC, blue). HC n = 5; BCR-UV n = 5. Statistical analysis was done using one-way ANOVA- Tukey’s multiple comparisons test; ****P < 0.0001, ***P = 0.0003. Data are presented as mean values ± SEM. Source data are provided as a Source Data file. C CD56+ CD8+CD244+ NK cell population (representative gating strategy is shown on the left) from age-matched BCR-UV patients and healthy controls (HC) are tested for the surface expression of NKG2D (CD314) and NKp30 (CD337) proteins (bar plots on the right). n = 6. **P = 0.001. Data are presented as mean values ± SEM. Source data are provided as a Source Data file.D CD244+CD8A+ cells from C4_Natural Killer Cells cluster in the single-cell RNAseq analysis (subcluster shown as in Fig. 2A) were analyzed for the expression of transcripts of the indicated inflammation-associated genes in BCR-UV and HC. The double positive population expressing at least one transcript copy of CD244 and CD8A were more in BCR-UV and expressed more inflammation-associated genes compared to the HC.
Fig. 6
Fig. 6. Response to systemic immunomodulatory therapy is accompanied by normalization of circulating CD8+ CD244+ NK cells in patients.
A Representative Fluorescein angiography (FA) image the left and right eye of a birdshot uveitis (BCR-UV) patient at baseline and after 1 year of systemic immunomodulatory therapy. B Histograms are showing the expression of CD8a and CD244 proteins in circulating CD56dim CD16+ NK cell surface of healthy control (HC), BCR-UV patient at the baseline (Base) and on month 6 (M06) and year 1 (Y01). Values within the box indicate the mean fluorescent intensity (MFI) of CD8a and CD244 proteins. C Representative flow plots show staining of CD8 and CD244 proteins within CD56dim CD16+ NK cells in the blood of healthy control (HC), BCR-UV patient at baseline with no treatment (Base), and longitudinally at follow-up visits at month 6 (M06) and year 1 (Y01) after treatments. D Frequencies of CD244 and CD8 double positive cells within CD56dim CD16+ NK population in age-matched healthy control (HC) and in BCR-UV at baseline (Base) and treatment follow up visits. HC, n = 10; Baseline, n = 15; Month 03, n = 4; Month 06, n = 4 and Year 01, n = 15. Statistical comparison is done using one-way ANOVA- Tukey’s multiple comparisons test. *P = 0.01. Data are presented as mean values ± SEM. Source data are provided as a Source Data file.

References

    1. Rothova, A. et al. Causes and frequency of blindness in patients with intraocular inflammatory disease. Br. J. Ophthalmol.80, 332–336 (1996). 10.1136/bjo.80.4.332 - DOI - PMC - PubMed
    1. Howe, L. J. et al. Choroidal abnormalities in birdshot chorioretinopathy: an indocyanine green angiography study. Eye (Lond.)11, 554–559 (1997). 10.1038/eye.1997.142 - DOI - PubMed
    1. Kiss, S. et al. Birdshot retinochoroidopathy. Int Ophthalmol. Clin.46, 39–55 (2006). 10.1097/00004397-200604620-00006 - DOI - PubMed
    1. Shah, K. H. et al. Birdshot chorioretinopathy. Surv. Ophthalmol.50, 519–541 (2005). 10.1016/j.survophthal.2005.08.004 - DOI - PubMed
    1. Testi, I. et al. Peripheral capillary non-perfusion in birdshot retinochoroiditis: a novel finding on ultra-widefield fluorescein angiography. Ocul. Immunol. Inflamm.28, 1192–1195 (2020). 10.1080/09273948.2020.1758157 - DOI - PubMed

MeSH terms

LinkOut - more resources